. 2023 Mar 6;222(3):e202204010.
doi: 10.1083/jcb.202204010. Epub 2023 Jan 13.

Myelination generates aberrant ultrastructure that is resolved by microglia

Affiliations

Myelination generates aberrant ultrastructure that is resolved by microglia

Minou Djannatian et al. J Cell Biol. .

Abstract

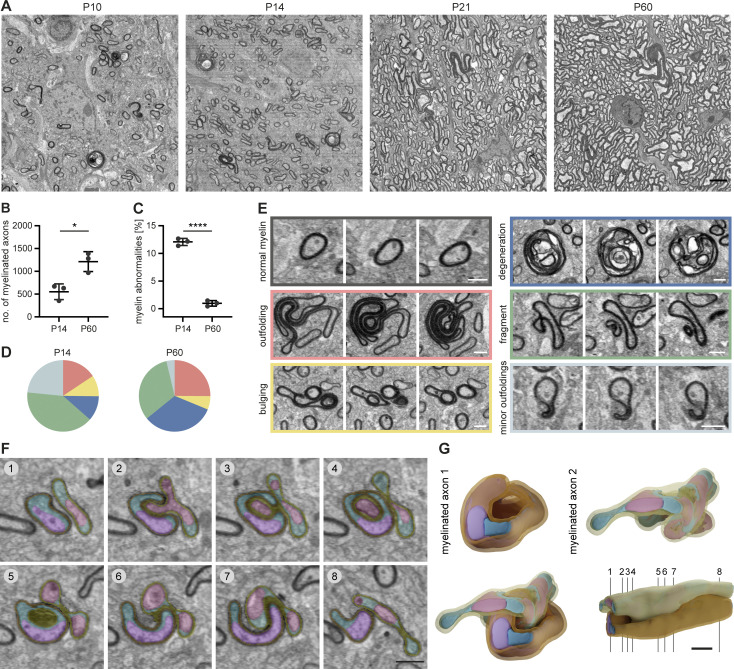
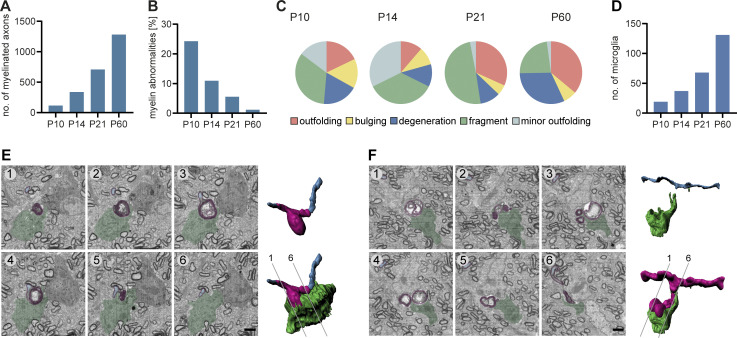
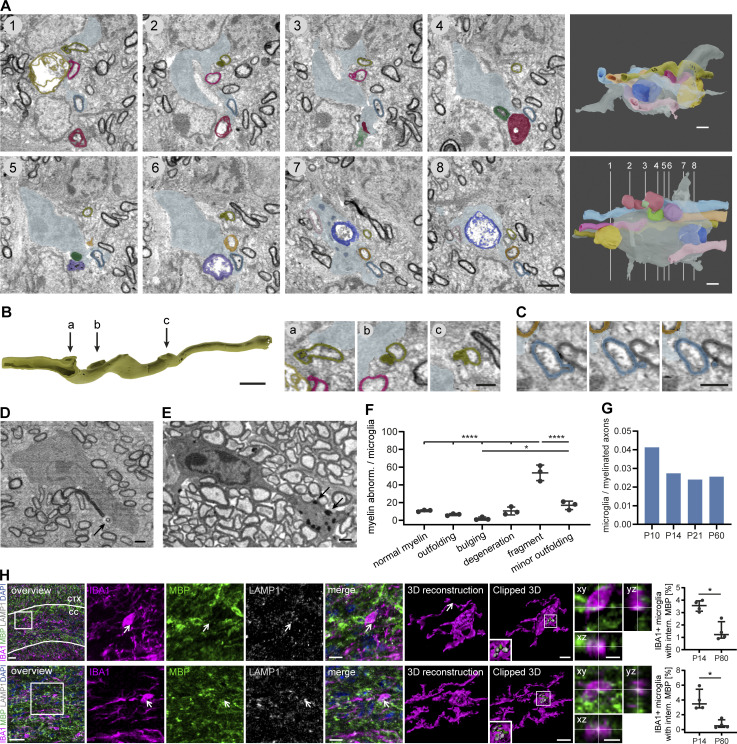
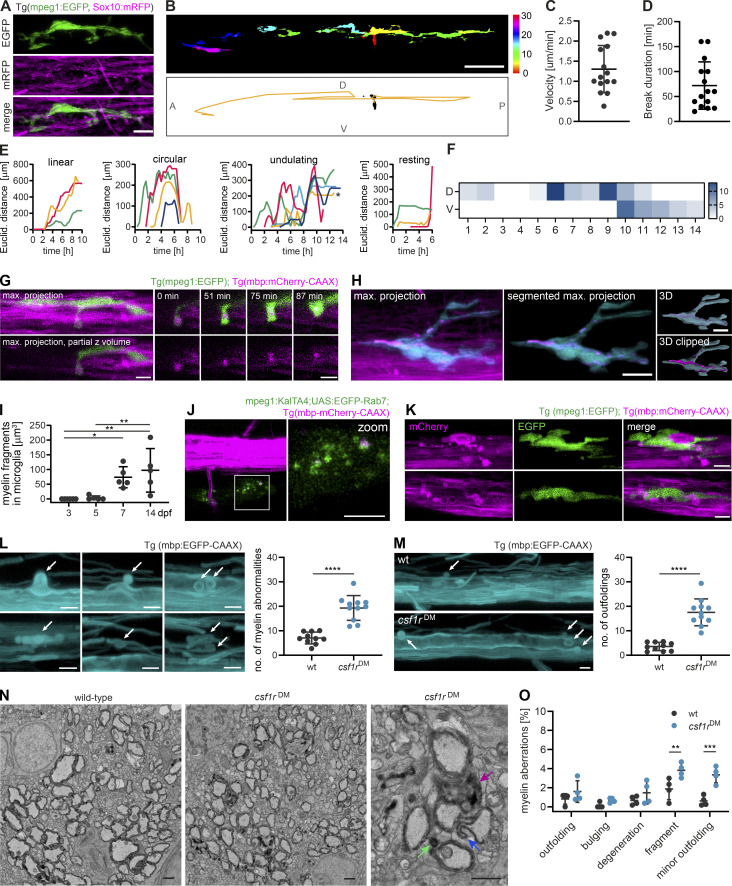
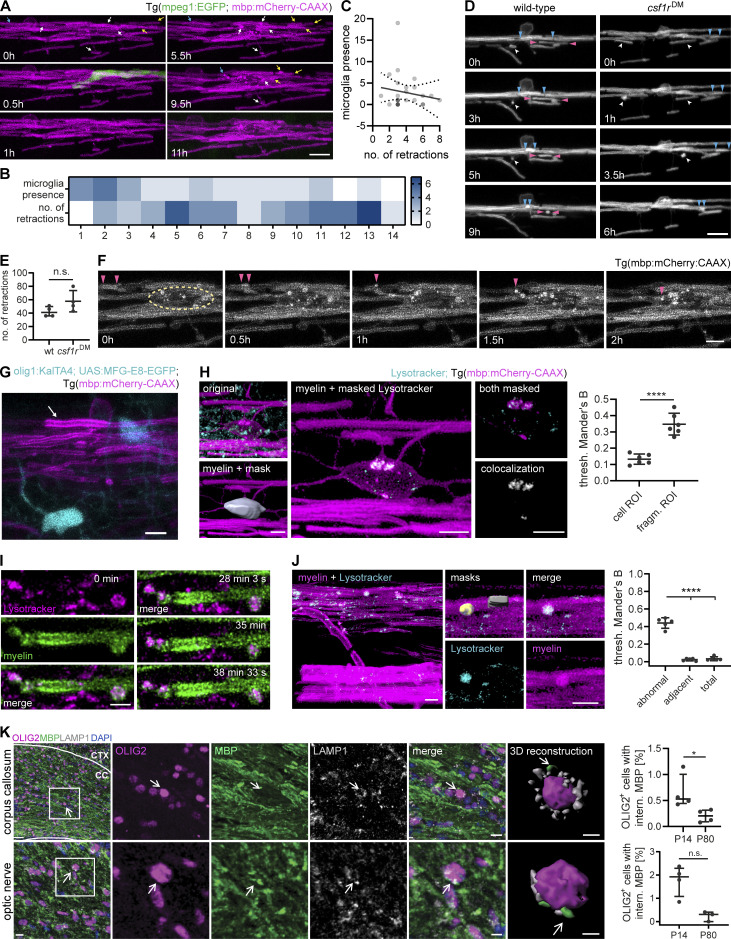
To enable rapid propagation of action potentials, axons are ensheathed by myelin, a multilayered insulating membrane formed by oligodendrocytes. Most of the myelin is generated early in development, resulting in the generation of long-lasting stable membrane structures. Here, we explored structural and dynamic changes in central nervous system myelin during development. To achieve this, we performed an ultrastructural analysis of mouse optic nerves by serial block face scanning electron microscopy (SBF-SEM) and confocal time-lapse imaging in the zebrafish spinal cord. We found that myelin undergoes extensive ultrastructural changes during early postnatal development. Myelin degeneration profiles were engulfed and phagocytosed by microglia using exposed phosphatidylserine as one "eat me" signal. In contrast, retractions of entire myelin sheaths occurred independently of microglia and involved uptake of myelin by the oligodendrocyte itself. Our findings show that the generation of myelin early in development is an inaccurate process associated with aberrant ultrastructural features that require substantial refinement.


Conflict of interest statement

Disclosures: The authors declare no competing financial interests.

Figures

Figure 1.
Figure 1.
Myelin abnormalities occur temporarily during development in the mouse CNS. SBF-SEM of P10, P14, P21, and P60 wt mouse optic nerves (80 × 80 × 40–210 μm volumes with a 10 × 10 × 80 nm resolution). (A) Representative cross-sections. (B) Mean number of myelinated axons within a 40 × 40 μm area at P14 and P60 (quantified on 8–10 evenly dispersed cross-sections within the SBF-SEM volumes, n = 3 optic nerves). Two-sided Student’s t test: *, P = 0.0145. In total, we quantified 4,655.3 ± 785.4 myelinated axons at P14 and 10,560 ± 2,099.8 at P60. (C) Mean percentage of myelin abnormalities at P14 and P60 (within 8–10 evenly dispersed volumes of 40 × 40 × 8 μm, normalized by the number of myelinated axons in reference sections, n = 3 optic nerves). Two-sided Student’s t test: ****, P < 0.0001. (D) Percentage of error subtypes among the myelin errors quantified in C: outfoldings (red), bulgings (yellow), degenerations (dark blue), fragments pinching off from a sheath or lying in the vicinity of a sheath (green), and minor outfoldings (light blue). Means of n = 3 optic nerves. Color code refers to example images in E. (E) Cross-sections at different z levels show examples of myelin abnormalities: outfolding, bulging, degeneration, fragment detaching from an intact sheath, and minor outfoldings that likely represent an early stage of outfolding and bulging. (F and G) 3D reconstruction of a myelinated axon bulging into another myelinated axon. (F) Pseudo-colored cross-sections at different z levels (violet/pink: axons, petrol/cyan: glial cytoplasm, orange/yellow: myelin). Note the excess glial cytoplasm at the location of bulging. (G) 3D reconstruction. Numbering refers to cross-sections in F. Images in A and F are 4 × 4 binned. Scale bars: 3 µm (A), 2 µm (G), 1 µm (E, F). See also Videos 1 and 2.
Figure S1.
Figure S1.
Temporal dynamics and microglial engulfment of myelin abnormalities during CNS development in the mouse. (A−C) SBF-SEM of P10, P14, P21, and P60 wt mouse optic nerves (80 × 80 × 40–210 μm volumes with a 10 × 10 × 80 nm resolution). Quantifications include all time points for n = 1 optic nerve. (A) Mean number of myelinated axons within a 40 × 40 μm area (quantified on 8–10 evenly dispersed cross-sections within the SBF-SEM volumes). In total, we quantified 1,150 (P10), 3,559 (P14), 7,075 (P21), and 12,808 (P60) myelinated axons. (B) Mean percentage of myelin abnormalities (within 8–10 evenly dispersed volumes of 40 × 40 × 8 μm, normalized by the number of myelinated axons in reference sections). (C) Percentage of error subtypes among the myelin errors quantified in B: outfoldings (red), bulgings (yellow), degenerations (dark blue), fragments pinching off from a sheath or lying in the vicinity of a sheath (green), and minor outfoldings (light blue). (D) Quantification shows the number of microglia in a volume of 80 × 80 × 160 µm at P10, P14, P21, and P60 (n = 1). (E and F) SBF-SEM of a P14 wt mouse optic nerve shows two examples of a microglia engulfing degenerated myelin. Left: Pseudocolored cross-sections (blue: axon, magenta: myelin, green: microglia). Right: 3D reconstruction. Numbering refers to cross-sections. Scale bars: 2 µm.
Figure 2.
Figure 2.
Microglia engulf and phagocytose developmental myelin abnormalities in the mouse CNS. (A−D) SBF-SEM of a P14 wt mouse optic nerve shows a microglia contacting several myelinated axons with aberrant myelin ultrastructure. (A) Pseudocolored cross-sections show examples of myelin abnormalities engulfed or contacted by a microglia. The microglia is displayed in gray blue, while the other colors designate individual myelin sheaths. 3D reconstructions (right) show different orientations and numbering refers to cross-sections. (B) Focal myelin dystrophies on a reconstructed myelin sheath. The dystrophy in “a” is sliced to display the 3D structure. Arrows refer to cross-sections on the right side. Cross-sections show details of the cross-sections 1, 2, and 6 in A. (C) Myelin fragment pinching off a myelin sheath on three consecutive sections. (D) Microglia engulfing a detached myelin fragment (arrow). (E) Microglia with myelin inclusions at P60 (arrows). (F) Quantification shows the percentage of myelin aberration subtypes associated with microglia in SBF-SEM of P14 wt mouse optic nerves (n = 3 mice). One-way ANOVA with post-hoc Tukey’s test: normal myelin, outfoldings, bulgings, degeneration, and minor outfolding vs. fragment: P < 0.0001, bulging vs. minor outfolding: P = 0.0165, all other comparisons were non-significant. (G) Quantification shows the total number of microglia within a volume of 80 × 80 × 160 µm normalized by the number of myelinated axons at P10, P14, P21, and P60 (n = 1 optic nerve). (H) Sections of P14 wt corpus callosum (CC; top), cortex (CTX), and optic nerve (bottom) co-immunostained for MBP and LAMP1 together with IBA1 for microglia. Clipped 3D view shows MBP-positive staining inside microglia and in close association with lysosomes (arrows). Orthogonal views display co-localization of IBA1 and MBP staining. Quantifications show the percentage of microglia with internalized MBP in P14 vs. P80 brains (n = 4 mice). Mann–Whitney U-test: P = 0.0286 (H, corpus callosum and optic nerve). Data represent median and IQR. *, P < 0.05, ****, P < 0.0001. Images in A–E are 4 × 4 binned. Scale bars: 30 μm (H, overview), 10 μm (H, merge), 5 μm (H, clipped 3Ds and orthogonal views), 2 μm (A, B, 3D reconstruction), and 1 μm (B, cross-sections, C–E). See also Video 3.
Figure 3.
Figure 3.
Microglia screen myelin sheaths and phagocytose myelin in the zebrafish spinal cord. (A) Maximum projection of a microglia (green) making contact with myelin sheaths (magenta) in a 4 dpf Tg (mpeg1:EGFP; sox10:mRFP) zebrafish spinal cord. (B−F) Microglia scanning behavior along myelin sheaths in the spinal cord was analyzed by confocal time-lapse imaging of 3–4 dpf Tg (mpeg1:EGFP; mbp:mCherry-CAAX) or Tg (mpeg1:EGFP; sox10:mRFP) larvae over 14.5–15 h. Tile scans were acquired every 20 min. Individual microglia were followed through all time frames in which they were contacting myelin sheaths of one hemi-spinal cord (15 microglia from n = 6 larvae). (B) Example of the movement of a single microglia followed over 10 h. Top: Individual time frames are color-coded to highlight microglia movement over time. Bottom: Binary image of the microglia in time frame 1. For the analysis of the microglia motility along the spinal cord, tracks were manually drawn in the Manual Tracking plugin in Fiji by marking soma position in each time frame (overlaid as a yellow line in this image). A: anterior, P: posterior, D: dorsal, V: ventral. (C) Mean velocity of microglia movement along the spinal cord. (D) Mean duration of breaks in motility taken by individual microglia. (E) Tracking profiles (as shown in B) were plotted as the Euclidean distance of the microglia soma in each frame from the position of the soma in the first frame. The shape of the resulting curves was used to classify microglia movements into patterns. Colors identify individual microglia. Asterisk marks sheath displayed in B. (F) Microglia presence per time frame was added up in quadrants of the spinal cord (1 to 14, anterior to posterior) and displayed as heatmap to visualize preferential screening behavior. D: dorsal, V: ventral. (G) Confocal time-lapse imaging of a microglia taking up a myelin fragment over 90 min. Tilescans were acquired every 3 min. Images show maximum projections. For better visualization, only a part of the hemi-spinal cord was projected. Details show the myelin fragment inside the microglial process at distinct time points (top row: merged images, bottom row: 552 nm channel). (H and I) Myelin fragments accumulate inside microglia. (H) Example image from a 10 dpf Tg (mpeg1:EGFP; sox10:mRFP) spinal cord. To quantify myelin fragments within microglia, microglia were manually segmented in Imaris and the resulting surfaces were used to mask the 552 nm channel. (I) Quantification shows the sum of myelin fragment volumes within microglia in Tg (mpeg1:EGFP; mbp:mCherry-CAAX) spinal cords (n = 5 larvae per time point). One-way ANOVA with post-hoc Tukey’s test: 3 vs. 7 dpf: P = 0.0345, 3 vs. 14 dpf: P = 0.0046, 5 vs. 14 dpf: P = 0.0089, all other comparisons were non-significant. (J) Colocalization of mbp:mCherry-CAAX+ fragments with microglial lysosomes, labeled by transiently expressed mpeg1:KalTA4;UAS:EGFP-Rab7. (K) Microglia engulfing an enlarged, seemingly unwrapping myelin sheath (top row) and surrounding round mbp-mCherry-CAAX–positive structures budding off from the ventral Mauthner axon (bottom row). (L) Examples of myelin abnormalities (marked by arrows) observed in wt and csf1rDM Tg (mbp:EGFP-CAAX) larvae (top row: myelinosomes budding off from the Mauthner axon, bottom row left: sheath degeneration, bottom row middle + left: “myelin flaps,” which may represent locally unwrapped myelin). Quantification of the number of myelin abnormalities in 10 dpf dorsal and ventral spinal cord of wt (black) and csf1rDM (blue) larvae, normalized by the myelinated area (wt: n = 10 larvae, csf1rDM: n = 11 larvae). Two-sided Student’s t test: P < 0.0001. (M) Maximum projections of wt and csf1rDM Tg (mbp:EGFP-CAAX) ventral spinal cords showing myelin outfoldings budding off the Mauthner axon (arrows). Quantification of the number of myelin outfoldings in 10 dpf ventral spinal cord of wt and csf1rDM larvae, normalized by the myelinated area (wt: n = 10 larvae, csf1rDM: n = 11 larvae). Two-sided Student’s t test: P < 0.0001. (N) Examples of myelin ultrastructure in SEM cross-sections of the wt and csf1rDM zebrafish spinal cord at P18. Arrows indicate an outfolding (purple), a myelin fragment (green), and a minor outfolding (blue). (O) Quantification shows the percentage of myelin aberrations, categorized by subtypes, in single SEM cross-sections of the wt and csf1rDM zebrafish spinal cord at P18 (n = 4 larvae). One-way ANOVA with post-hoc Tukey’s test: fragments, wt vs. csf1rDM: P = 0.0068, minor outfoldings, wt vs. csf1rDM: P = 0.0001, all other comparisons were non-significant. Data represent means ± SD. *, P < 0.05, **, P < 0.01, ***, P < 0.001, ****, P < 0.0001. Scale bars: 5 µm (G, J–M), 10 µm (A, H), 50 µm (B). See also Video 4.
Figure S2.
Figure S2.
Screening behavior of microglia along myelin sheaths. (A) Microglia motility along myelin sheaths was monitored in 3-min acquisitions over 1 h by confocal time-lapse imaging of a Tg (mpeg1:EGFP; sox10:mRFP) zebrafish spinal cord. (B) XY plot correlates the mean number of microglia present along the spinal cord with the mean percentage of frames in which microglia remained static. Data points represent individual larvae. Linear regression analysis: R2: 0.1669, P = 0.4213. Dotted lines represent the standard error of the linear regression. (C) Heatmaps of microglial presence in quadrants of the dorsal and ventral spinal cord from five other fish (see Fig. 3 F for Fish 1). (D) Confocal time-lapse imaging of motile mbp:mCherry-CAAX fragments within a microglia in a 7 dpf Tg (mpeg1:EGFP; mbp:mCherry-CAAX) spinal cord. Z-stacks were acquired every 3 min. Images show maximum projections. Scale bars: 5 µm (D), 20 µm (A). See also Video 4.
Figure S3.
Figure S3.
Characterization of csf1rDM mutant. (A) Representative images of myelin in wt and csf1rDM Tg (mbp:EGFP-CAAX) spinal cords. (B−D) Quantifications of myelinated area (B), number of oligodendrocytes (C), and sheath lengths (60 individual myelin sheaths from n = 3 fish; D) in the dorsal spinal cord of 4 dpf wt and csf1rDM larvae (wt: n = 8, csf1rDM: n = 9 larvae in B and C). Two-sided Student’s t test: P = 0.5359 (B), P = 0.0905 (C), Mann–Whitney U-test: P = 0.8445 (D). (E−G) Quantifications of myelinated area (E), number of oligodendrocytes (F), and sheath lengths (60 individual myelin sheaths from n = 3 fish; G) in the dorsal spinal cord of 10/11 dpf wt and csf1rDM larvae (wt: n = 10, csf1rDM: n = 11 larvae in E and F). Two-sided Student’s t test: P = 0.0012 (E), P = 0.0001 (F), Mann–Whitney U-test: P = 0.3419 (G). (H) Number of mpeg1:EGFP-positive microglia per spinal cord in 4 vs. 7 dpf wt and csf1rDM larvae (4 dpf: n = 8, 7 dpf: n = 7 larvae). Two-way ANOVA with post-hoc Sidak’s test: 4 dpf, wt vs. csf1rDM: P = 0.0266, 7 dpf, wt vs. csf1rDM: P < 0.0001. (I) Quantification of the number of myelin abnormalities in 18 dpf ventral spinal cord of wt and csf1rDM larvae, normalized by the myelinated area (n = 13 larvae). Two-sided Student’s t test: P = 0.0002. Data represent means ± SD. ns, not significant, *, P < 0.05, **, P < 0.01, ***, P < 0.001, ****, P < 0.0001. Scale bar: 10 µm (A).
Figure 4.
Figure 4.
PS recognition contributes to myelin phagocytosis. (A) Scheme depicting the in vivo detection of PS, as performed in B and C. Microglia secrete MFG-E8-EGFP, which binds to PS exposed on the extracellular leaflet of the membrane. In compacted myelin membranes, extracellular exposure of PS is sterically hindered, but may occur due to structural abnormalities of the myelin sheath. (B) A microglial cell expressing MFG-E8-EGFP contacts mbp:mCherry-CAAX–positive myelin sheaths. (C) Images show binding of MFG-E8-EGFP (cyan) to myelin sheaths or fragments (magenta) in Tg (mbp:mCherry-CAAX) larvae. In the top row “on sheath” images, MFG-E8-EGFP labeled several protuberances on two myelin sheaths; the relative amounts of labeled structures in these images are not representative of the quantification. Images are masked by the 552 nm channel. Zoomed images show details of myelin (left) and merged (right) images. Quantifications show the percentage of MFG-E8-EGFP–labeled structures that exhibited mbp:mCherry-CAAX co-staining, categorized by their localization on myelin sheaths or mbp:mCherry-CAAX–positive fragments (n = 4 larvae). Data represent median with IQR. Mann–Whitney U-test: P = 0.0286. (D) Schematic of the CRISPR/Cas9 F0 mutant screen for PS receptors. Fertilized Tg (mpeg1:EGFP; mbp:mCherry-CAAX) zebrafish eggs were injected with Cas9-gRNA RNP complexes at one-cell stage. F0 larvae were assessed at 7 dpf for myelin phagocytosis by microglia. We performed a sequential screen, starting with triple mutants and further dissecting one of them into double and single mutants. (E) Representative images of single, double, and triple mutants of bai1, tim1, and axl. Tyr F0 mutant was used as a control. (F) Quantification shows the total volume of myelin fragments within all microglia in different triple mutants (n = 5 larvae). One-way ANOVA with post-hoc Tukey’s test: tyr vs. tim4+bai1+mertka: P = 0.0462, tyr vs. mertka + axl + tyro3: P = 0.0028, tyr vs. mertka + tyro3+bai1: P = 0.0004, tyr vs. bai1+axl + tim1: P = 0.0002, tyr vs. tim4+mertka + axl: P < 0.0001, all other comparisons were non-significant. (G) Quantification shows the total volume of myelin fragments within all microglia in double and single mutants of bai1 and tim1 (n = 7 larvae for bai1+tim1, n = 8 larvae for tyr, bai1, and tim1). One-way ANOVA with post-hoc Tukey’s test: tyr vs. bai1+tim1: P = 0.0019, all other comparisons were non-significant. (H) Example images and quantification show the myelinated area of the dorsal spinal cord of 7 dpf triple mutants (n = 5 larvae). One-way ANOVA with post-hoc Tukey’s test: tyr vs. tim4+bai1+mertka: P = 0.0187, tim4+mertka + axl vs. mertka + axl + tyro3: P = 0.0145, bai1+axl + tim1 vs. tim4+bai1+mertka: P = 0.0151, mertka + tyro3+bai1 vs. mertka + axl + tyro3: P = 0.0022, tyr vs. tim4+mertka + axl: P = 0.0001, bai1+axl + tim1 vs. mertka + axl + tyro3: P = 0.0003, tyr vs. bai1+axl + tim1 and tyr vs. mertka + tyro3+bai1: P < 0.0001, all other comparisons were non-significant. (I) Maximum projections of wt and bai1;axl;tim1 mutant Tg (mbp:EGFP-CAAX) ventral spinal cords showing myelin outfoldings budding off the Mauthner axon (arrows). Quantification of the number of myelin abnormalities in 10 dpf ventral spinal cord of wt and bai1;axl;tim1 larvae, normalized by the myelinated area (n = 13 larvae). Mann-Whitney U-test: P = 0.0362. Data represent median and IQR (C and I) and means ± SD (F–H). *, P < 0.05, **, P < 0.01, ***, P < 0.001, ****, P < 0.0001. Scale bars: 10 µm (E and H), 5 µm (B and C, merge, I), 2 µm (C, zoom).
Figure S4.
Figure S4.
Details of the CRISPR/Cas9 F0 mutant screen for PS receptors in zebrafish. (A) Workflow of F0 mutant genotyping. Target regions were amplified from genomic DNA. Gene knockout in F0 mutants differed from controls by loss of a unique restriction site. gRNA efficiency was estimated from the ratio of undigested to digested bands on the agarose gel. (B) Agarose gels show genotyping results of bai1, tim1, and axl in the bai1+tim1+axl mutants and tyr controls. P, PCR product. (C) Sanger sequencing of bai1, tim1, and axl target sites in mutant and control animals, showing frameshift mutations in the mutants (KO). Arrows indicate gRNA position. Dashed lines mark Cas9 cleavage sites. (D) gRNA efficiencies in the triple F0 mutant screen (n = 5 larvae). (E) gRNA efficiencies in the double and single F0 mutant screen (n = 8 larvae). (F and G) Average volume of myelin fragments within individual microglia in triple F0 mutants (F), and double and single mutants of bai1 and tim1 (G). n = 5 larvae in F, n = 7 larvae in bai1+tim1, n = 8 larvae for tyr, bai1, and tim1 in G. One-way ANOVA with post-hoc Tukey’s test: tyr vs. tim4+bai1+mertka: P = 0.0002, tyr vs. tim4+mertka + axl, tyr vs. bai1+axl + tim1, tyr vs. mertka + tyro3+bai1 and tyr vs. mertka + axl + tyro3: P < 0.0001, tyr vs. bai1+tim1: P = 0.0160, all other comparisons in F and G were non-significant. (H−J) Microglia in the spinal cord of control and F0 mutant zebrafish larvae in the PS receptor KO screen. Example images (H) and quantification of the number of microglia in triple mutants (I) and double and single mutants of bai1 and tim1 (J). n = 5 larvae in I, n = 7 larvae for bai1+tim1, n = 8 larvae for tyr, bai1, and tim1 in J. One-way ANOVA with post-hoc Tukey’s test: tyr vs. bai1+tim1: P = 0.0026, bai1+tim1 vs. tim1: P = 0.0262, all other comparisons in I and J were non-significant. (K−M) Quantifications of number of OPCs in Tg (olig1:memEYFP) (K; n = 11 larvae), number of oligodendrocytes (L; n = 13 larvae), and sheath lengths in Tg (mbp:EGFP-CAAX) (60–65 individual myelin sheaths from n = 3 fish; M) in the dorsal spinal cord of 10 dpf control larvae injected with a three scrambled gRNAs and bai1;axl;tim1 F0 larvae. Two-sided Student’s t test: P = 0.8874 (K), P = 0.3769 (L), P = 0.8051 (M). Data represent means ± SD. *, P < 0.05, **, P < 0.01, ***, P < 0.001, ****, P < 0.0001. Scale bar: 20 µm (H). Source data are available for this figure: SourceData FS4.
Figure 5.
Figure 5.
Oligodendrocytes retract myelin sheaths independent of microglia and degrade membrane fragments. (A−C) Time-lapse confocal imaging of 3 dpf wt Tg (mpeg1:EGFP; mbp:mCherry-CAAX) zebrafish spinal cord is used to analyze retractions of dorsal myelin sheaths with respect to microglial presence. Images were acquired every 30 min during 14 h. (A) Representative images. Arrows identify individual retractions by color and the position of the arrowheads. A microglia contacting myelin sheaths was only observed during a single frame (at 0.5 h). (B) Heatmap shows microglial presence and the number of retractions in 5 × 5 mm quadrants along the dorsal spinal cord (1 to 12, anterior to posterior). (C) XY plot correlates the number of time frames, in which a microglia was present, with the number of myelin sheath retractions in 26 oligodendrocyte territories (n = 5 larvae). Linear regression analysis: R2: 0.02556, P = 0.4453. Dotted lines represent the standard error of the linear regression. (D and E) Time-lapse confocal imaging of 3 dpf wt and csf1rDM;Tg (mbp:EGFP-CAAX) larvae. Images (D) were acquired every 30 min over 8 h. Arrowheads identify individual retractions by different colors. Quantification in E shows the number of retractions during 8 h. Mann-Whitney U-test: P = 0.1429. (F) Time-lapse confocal imaging from A shows how retractions result in bright fragments inside the oligodendrocyte cell body. Arrowheads mark a retracting sheath and its fragments. Dashed circle indicates the oligodendrocyte soma. (G) Example of a retracting sheath (arrow) exhibiting normal ultrastructure and lacking MFG-E8-EGFP labeling in a 4 dpf Tg (mbp:mCherry-CAAX) spinal cord with transient expression of olig1:KalTA; UAS:MFG-E8-EGFP. (H) Colocalization analysis of mbp:mCherry-CAAX–positive fragments inside oligodendrocyte cell bodies with LysoTracker Green. Oligodendrocyte cell bodies were manually segmented from the 552 nm channel. Channels were masked by the whole cell body (cell ROI) or by the bright mbp:mCherry-CAAX fragments inside (fragment ROI), followed by colocalization analysis. Thresholded Mander’s B coefficient reflects the amount of colocalization within the ROI of the thresholded 552 nm channel (43 cell bodies from n = 6 larvae). Student’s t test: P < 0.0001. (I) Time-lapse imaging of a single myelin sheath stained in vivo with LysoTracker Red (maximum projections). Z-stacks were acquired every 3 s. (J) Quantification of LysoTracker colocalization with structural myelin abnormalities compared to a normal-appearing adjacent myelin sheath and total myelin in the same image (n = 5 larvae). One-way ANOVA with post-hoc Tukey’s test: abnormal vs. adjacent, abnormal vs. total: P < 0.0001, adjacent vs. total: P = 0.9074. (K) Free-floating sections of P14 wt mouse brains co-immunostained for MBP and LAMP1 together with OLIG2 for oligodendrocytes. Top row: corpus callosum, bottom row: optic nerve. 3D reconstruction shows MBP-positive staining in close association with lysosomes (marked by arrow) and the oligodendrocyte nucleus. Quantifications show the percentage of oligodendrocytes with internalized MBP in P14 vs. P80 brains (n = 4 mice). Mann–Whitney U-test: P = 0.0286 (corpus callosum), P = 0.0571 (optic nerve). Data represent means ± SD (H and J) and median and IQR (E and K). n.s., not significant, *, P < 0.05, ****, P < 0.0001. Scale bars: 30 µm (K, corpus callosum overview), 10 µm (A, D, K, optic nerve overview and corpus callosum merge), 5 µm (F, G, H, J, K, optic nerve merge), 3 µm (H, clipped 3Ds), 2 µm (I). See also Video 5.

References

    1. Almeida, R.G., Czopka T., Ffrench-Constant C., and Lyons D.A.. 2011. Individual axons regulate the myelinating potential of single oligodendrocytes in vivo. Development. 138:4443–4450. 10.1242/dev.071001 - DOI - PMC - PubMed
    1. Almeida, R.G., and Lyons D.A.. 2015. Intersectional gene expression in zebrafish using the split KalTA4 system. Zebrafish. 12:377–386. 10.1089/zeb.2015.1086 - DOI - PMC - PubMed
    1. Auer, F., Vagionitis S., and Czopka T.. 2018. Evidence for myelin sheath remodeling in the CNS revealed by In Vivo imaging. Curr. Biol. 28:549–559.e3. 10.1016/j.cub.2018.01.017 - DOI - PubMed
    1. Baraban, M., Koudelka S., and Lyons D.A.. 2018. Ca 2+ activity signatures of myelin sheath formation and growth in vivo. Nat. Neurosci. 21:19–23. 10.1038/s41593-017-0040-x - DOI - PMC - PubMed
    1. Berger, D.R., Seung H.S., and Lichtman J.W.. 2018. VAST (volume annotation and segmentation tool): Efficient manual and semi-automatic labeling of large 3D image stacks. Front. Neural Circuits. 12:88. 10.3389/fncir.2018.00088 - DOI - PMC - PubMed

Publication types