. 2023 Mar 1;133(5):e164486.
doi: 10.1172/JCI164486.

SGLT2 inhibitors mitigate kidney tubular metabolic and mTORC1 perturbations in youth-onset type 2 diabetes

Affiliations

SGLT2 inhibitors mitigate kidney tubular metabolic and mTORC1 perturbations in youth-onset type 2 diabetes

Jennifer A Schaub et al. J Clin Invest. .

Abstract

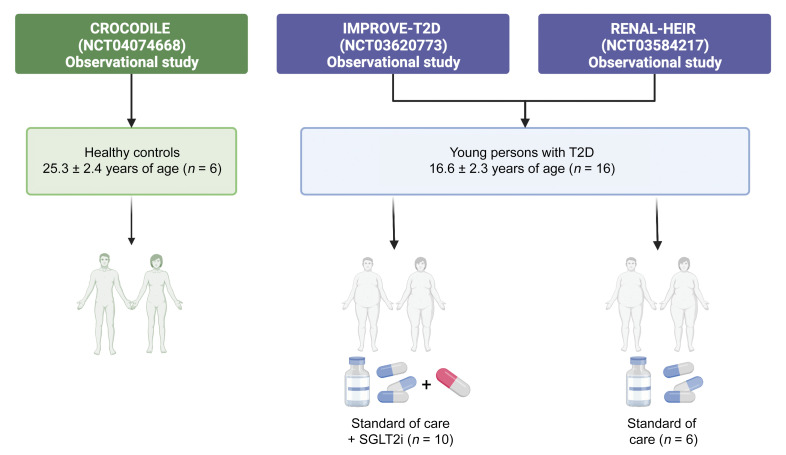
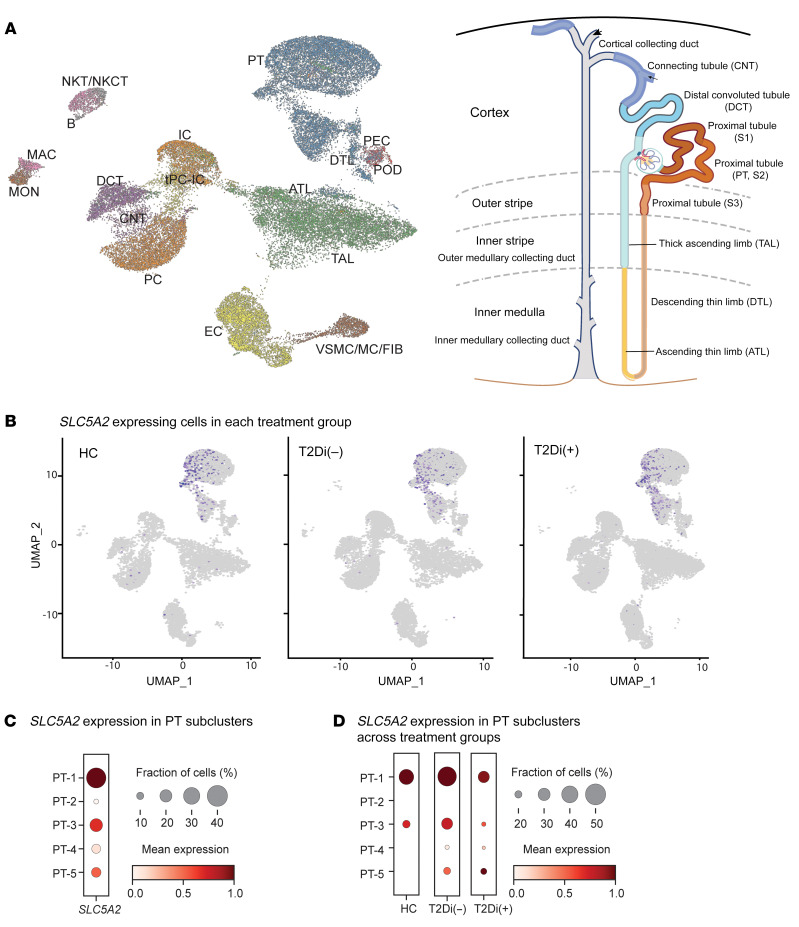
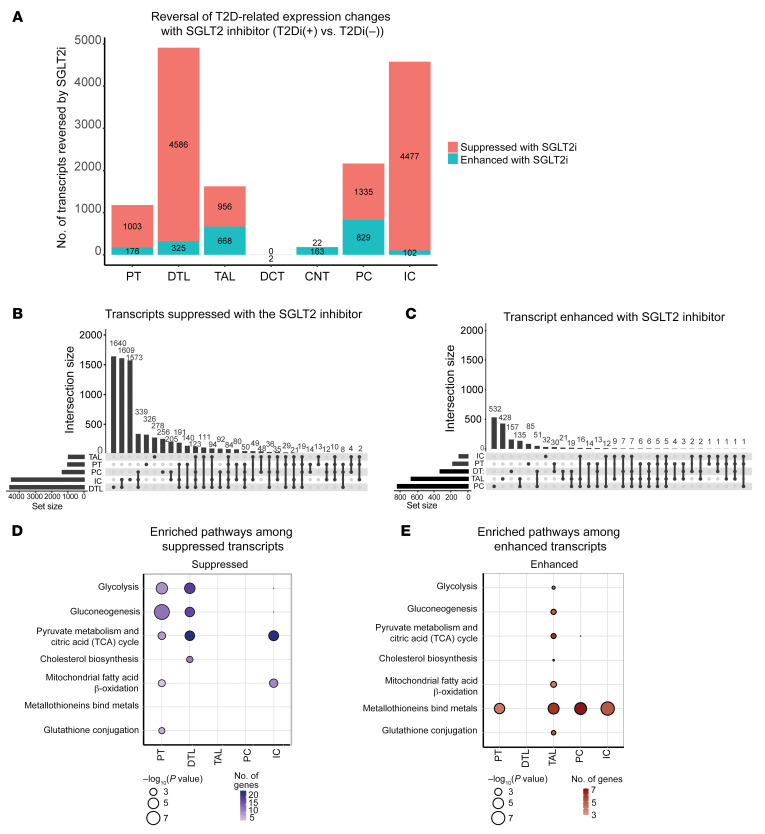
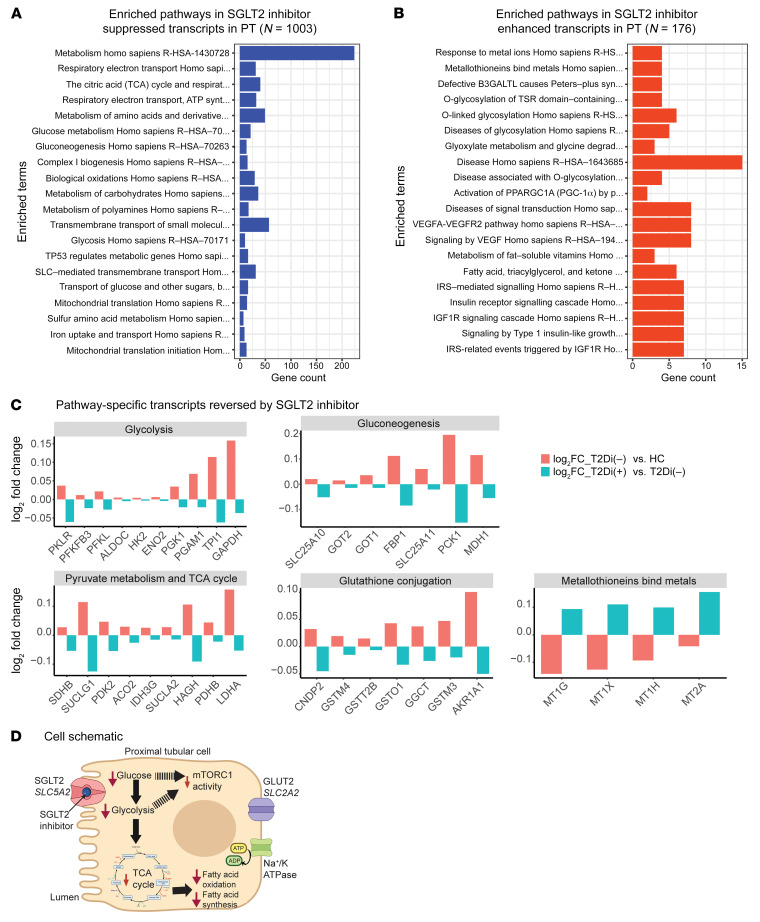
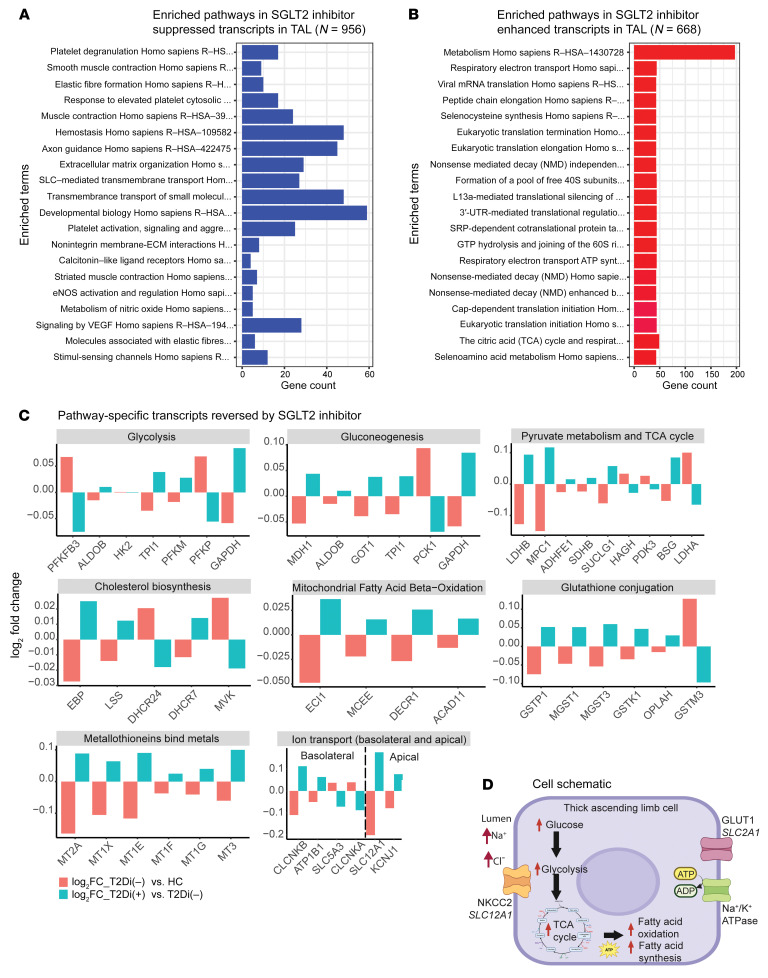
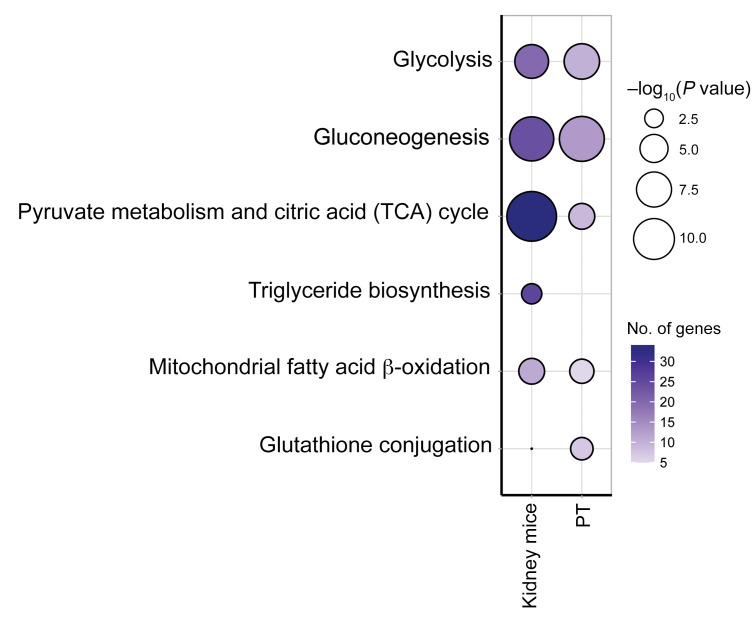
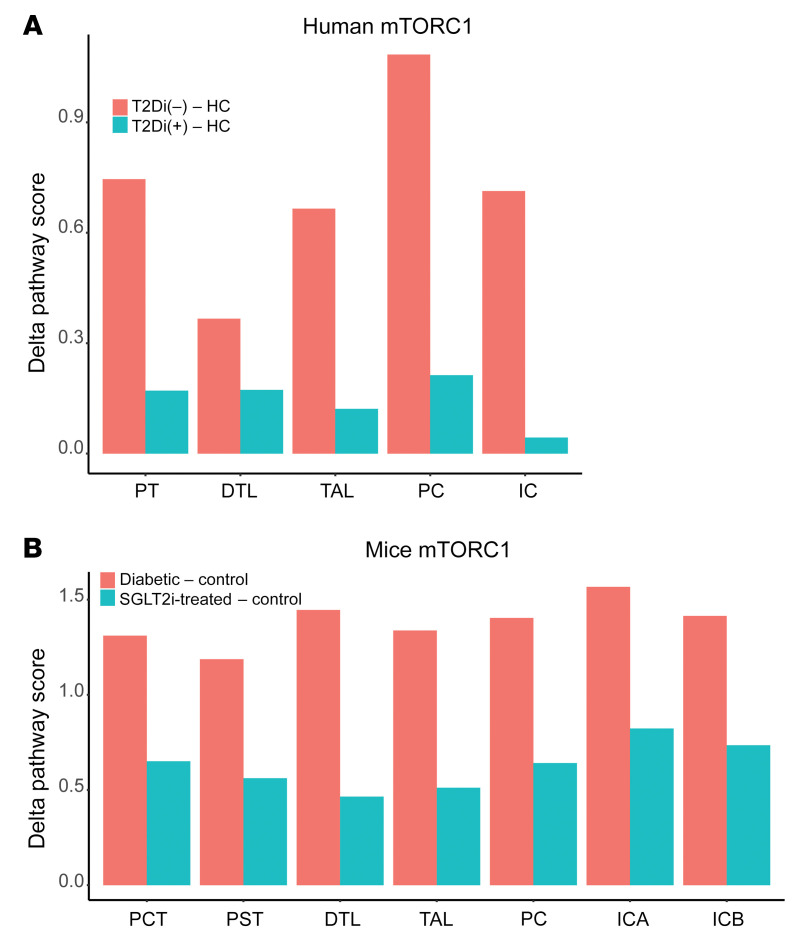
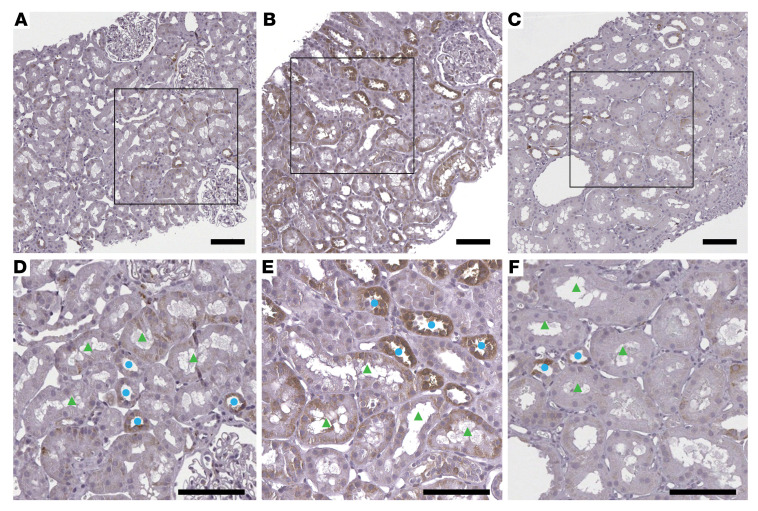
The molecular mechanisms of sodium-glucose cotransporter-2 (SGLT2) inhibitors (SGLT2i) remain incompletely understood. Single-cell RNA sequencing and morphometric data were collected from research kidney biopsies donated by young persons with type 2 diabetes (T2D), aged 12 to 21 years, and healthy controls (HCs). Participants with T2D were obese and had higher estimated glomerular filtration rates and mesangial and glomerular volumes than HCs. Ten T2D participants had been prescribed SGLT2i (T2Di[+]) and 6 not (T2Di[-]). Transcriptional profiles showed SGLT2 expression exclusively in the proximal tubular (PT) cluster with highest expression in T2Di(-) patients. However, transcriptional alterations with SGLT2i treatment were seen across nephron segments, particularly in the distal nephron. SGLT2i treatment was associated with suppression of transcripts in the glycolysis, gluconeogenesis, and tricarboxylic acid cycle pathways in PT, but had the opposite effect in thick ascending limb. Transcripts in the energy-sensitive mTORC1-signaling pathway returned toward HC levels in all tubular segments in T2Di(+), consistent with a diabetes mouse model treated with SGLT2i. Decreased levels of phosphorylated S6 protein in proximal and distal tubules in T2Di(+) patients confirmed changes in mTORC1 pathway activity. We propose that SGLT2i treatment benefits the kidneys by mitigating diabetes-induced metabolic perturbations via suppression of mTORC1 signaling in kidney tubules.

Keywords: Chronic kidney disease; Diabetes; Metabolism; Nephrology; Transcription.


Figures

Figure 1
Figure 1. Participant data flow.
For this study, young persons with type 2 diabetes treated with SGLT2 inhibitors or standard of care, from the IMPROVE-T2D and RENAL-HEIR observational studies, were included. Healthy controls from the CROCODILE study were included.
Figure 2
Figure 2. SLC5A2 gene expression is limited to PT clusters.
(A) UMAP projection of annotated cellular clusters from 3 groups, HCs (n = 6), T2Di (–) (n = 6), and T2Di(+) (n = 10), correspond to all major cell types in the nephron. Cluster identity and color are mapped onto the nephron schematic. (B) For all groups (HC, T2Di[–], and T2Di[+]), SLC5A2 mRNA–expressing cells (purple dots) were limited to the PT cluster. (C) Size of dots, reflecting fraction of cells (%) expressing SLC5A2 mRNA, and color intensity, indicating mean expression levels, varied across PT subclusters, with PT-1 having the highest expression and PT-2 and PT-4 having the lowest expression. (D) SLC5A2 mRNA expression varied across the 3 groups, with T2Di(+) lower than T2Di(–) across all PT subclusters. ATL, ascending thin limb; DCT, distal convoluted tubule; CNT, connecting tubule; tPC-IC, transitioning intercalated/PCs; EC, endothelial cells; vSMC/MC/Fib, vascular smooth muscle cells/mesangial cells/fibroblasts; PEC, parietal epithelial cells; POD, podocytes; MAC, macrophages; MON, monocytes; B, B cells; NKT/NKCT, natural killer T cells/natural killer cells with T cells; PT, proximal tubule; DTL, descending thin limb; TAL, thick ascending limb; IC, intercalated cells; PC, principal cells.
Figure 3
Figure 3. SGLT2 inhibition altered transcript expression in the majority of tubular cell segments.
(A) Plot of the number of transcripts reversed, suppressed, or enhanced with SGLT2i shows that the majority of transcripts altered with SGLT2i were in distal nephron segments. The fold changes (log2FC) were calculated between 2 comparisons: T2Di(–) versus HCs and T2Di(+) versus T2Di(–). Transcripts were required to pass FDR-adjusted P values of less than 0.05 in T2Di(–) versus HCs and in T2Di(+) versus T2Di(–) to be considered reversed. (B) Upset plots indicate most transcripts suppressed with SGLT2i were in DTL. DTL and IC shared the greatest number of transcripts. (C) Most unique transcripts enhanced with SGLT2i were in PC, TAL, and DTL. PC and TAL had the greatest number of overlapping transcripts (n = 135). Using the Reactome database and Fisher’s exact test, (D) central metabolic pathways in PT, DTL, and IC were suppressed and (E) all central metabolic processes were enhanced in TAL. Metallothioneins were enhanced across all segments, except DTL.
Figure 4
Figure 4. Suppression of central metabolic pathways with SGLT2 inhibition in PT.
(A) Enrichment analysis using Reactome data of suppressed transcripts with SGLT2 inhibition showing metabolism has greatest number of altered transcripts (n > 200). (B) Pathway enrichment analysis using Reactome database of enhanced transcripts with SGLT2 inhibition. A pathway was considered significant if its P value was less than 0.05 and included at least 5 transcripts reversed by SGLT2i. (C) Bar plots showing transcript-level alterations (log2FC) when comparing T2Di(–) to HCs (pink) and T2Di(+) to T2Di(–) (blue). (D) Schematic summarizing the transcriptional changes in PT cells. SGLT2i impairs uptake of sodium and glucose into PT cells via SLC5A2, leading to decreased expression of glycolytic and TCA cycle transcripts. Decreased glucose uptake and glycolysis may decrease mTORC1 activity.
Figure 5
Figure 5. Enhancement of central metabolic pathways with SGLT2 inhibition in TAL.
(A) Enrichment analysis using Reactome database of suppressed transcripts with SGLT2 inhibition. (B) Enrichment analysis using Reactome data of enhanced transcripts with SGLT2 inhibition showing metabolism has greatest number of altered transcripts (n > 200). A pathway was considered significant if its P value was less than 0.05 and included at least 5 transcripts reversed by SGLT2i. (C) Bar plots showing transcript-level alterations (log2FC) when comparing T2Di(–) to HCs (pink) and T2Di(+) to T2Di(–) (blue) (D) Schematic summarizing the transcriptional changes in TAL cells. Increased sodium-chloride delivery to tubular lumen would increase ATP consumption by sodium/potassium ATPase on the basolateral membrane. Increased energy needs could be met by increased expression of glycolytic, TCA cycle, and fatty acid oxidation transcripts.
Figure 6
Figure 6. Transcriptomic alterations in mouse model of diabetes treated with SGLT2i validate alterations in central metabolic pathways in PT from humans.
Dot plot comparing enriched pathways among suppressed transcripts in kidney cortex of SGLT2i-treated mice (n = 5 for each treatment group) with PT in T2Di(+).
Figure 7
Figure 7. SGLT2i treatment–associated mTORC1 pathway score across tubular segments in human and mouse data.
Using the Reactome database, 39 transcripts were associated with the mTORC1 pathway. (A) Plot represents the Δ mTORC1 pathway score by tubular segment as the difference between T2Di(–) and HCs (pink), and T2Di(+) and HCs (blue). (B) Similarly, in the mouse model snRNA-Seq data, Δ mTORC1 pathway scores were calculated in tubular segments as the difference between db/db mice (diabetic) and the background db/m (control) mice (pink) and SGLT2i-treated db/db/AAV and db/m (control) mice (blue).
Figure 8
Figure 8. Phospho-S6 ribosomal protein immunohistochemistry.
Representative images are shown from kidney biopsy sections immunohistochemically stained for phospho-S6 ribosomal protein from (A) HCs with average staining intensity for PT = 0.9 ( ± 0.4) and DT = 1.1( ± 0.5), (B) T2Di(–) with average staining intensity for PT = 1.4 ( ± 0.4) and DT = 2.1( ± 0.6), and (C) T2Di(+) with average staining intensity for PT = 0.8 ( ± 0.8) and DT = 1.1( ± 0.7), n = 4 in each group. Glass slides were scanned to whole slide images at ×40 magnification. Scale bars: 100 μm. Bottom panels DF are closer views from square areas from panels AC, respectively. Staining intensity was increased in both proximal (green triangles) and distal (blue circles) tubules in (E) T2Di(–) versus (D) HCs and was decreased in (F) T2Di(+). The average scores of the staining intensity were calculated from measurements by 2 independent pathologists.

Comment in

References

    1. Pinhas-Hamiel O, Zeitler P. The global spread of type 2 diabetes mellitus in children and adolescents. J Pediatr. 2005;146(5):693–700. doi: 10.1016/j.jpeds.2004.12.042. - DOI - PubMed
    1. Dabelea D, et al. Association of type 1 diabetes vs type 2 diabetes diagnosed during childhood and adolescence with complications during teenage years and young adulthood. JAMA. 2017;317(8):825–835. doi: 10.1001/jama.2017.0686. - DOI - PMC - PubMed
    1. Bjornstad P, et al. Elevated serum uric acid is associated with greater risk for hypertension and diabetic kidney diseases in obese adolescents with type 2 diabetes: an observational analysis from the Treatment Options for Type 2 Diabetes in Adolescents and Youth (TODAY) study. Diabetes Care. 2019;42(6):1120–1128. doi: 10.2337/dc18-2147. - DOI - PMC - PubMed
    1. Bjornstad P, et al. Insulin sensitivity and diabetic kidney disease in children and adolescents with type 2 diabetes: an observational analysis of data from the TODAY clinical trial. Am J Kidney Dis. 2018;71(1):65–74. doi: 10.1053/j.ajkd.2017.07.015. - DOI - PMC - PubMed
    1. Nelson RG, et al. Pima Indian contributions to our understanding of diabetic kidney disease. Diabetes. 2021;70(8):1603–1616. doi: 10.2337/dbi20-0043. - DOI - PMC - PubMed

Publication types

Substances