

Diversity and functional analysis of rumen and fecal microbial communities associated with dietary changes in crossbreed dairy cattle
- PMID: 36638091
- PMCID: PMC9838872
- DOI: 10.1371/journal.pone.0274371
Diversity and functional analysis of rumen and fecal microbial communities associated with dietary changes in crossbreed dairy cattle
Abstract
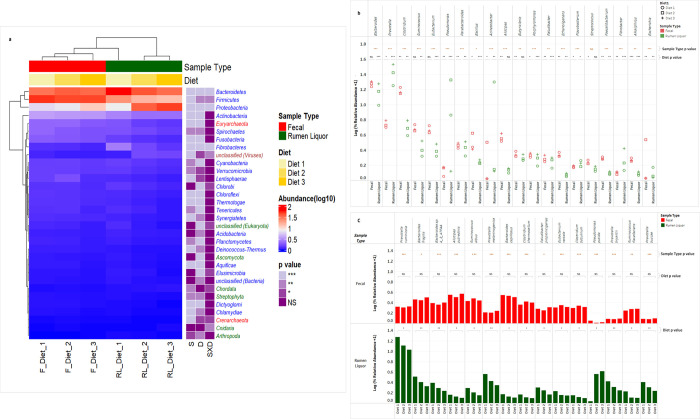
The objective of this study was to investigate the effect of varying roughage and concentrate proportions, in diet of crossbreed dairy cattle, on the composition and associated functional genes of rumen and fecal microbiota. We also explored fecal samples as a proxy for rumen liquor samples. Six crossbred dairy cattle were reared on three diets with an increasing concentrate and reducing roughage amount in three consecutive 10-day periods. After each period, individual rumen liquor and fecal samples were collected and analyzed through shotgun metagenomic sequencing. Average relative abundance of identified Operational Taxonomic Units (OTU) and microbial functional roles from all animals were compared between diets and sample types (fecal and rumen liquor). Results indicated that dietary modifications significantly affected several rumen and fecal microbial OTUs. In the rumen, an increase in dietary concentrate resulted in an upsurge in the abundance of Proteobacteria, while reducing the proportions of Bacteroidetes and Firmicutes. Conversely, changes in microbial composition in fecal samples were not consistent with dietary modification patterns. Microbial functional pathway classification identified that carbohydrate metabolism and protein metabolism pathways dominated microbial roles. Assessment of dietary effects on the predicted functional roles of these microbiota revealed that a high amount of dietary concentrate resulted in an increase in central carbohydrate metabolism and a corresponding reduction in protein synthesis. Moreover, we identified several microbial stress-related responses linked to dietary changes. Bacteroides and Clostridium genera were the principal hosts of these microbial functions. Therefore, the roughage to concentrate proportion has more influence on the microbial composition and microbial functional genes in rumen samples than fecal samples. As such, we did not establish a significant relationship between the rumen and fecal metagenome profiles, and the rumen and fecal microbiota from one animal did not correlate more than those from different animals.
Copyright: © 2023 Kibegwa et al. This is an open access article distributed under the terms of the Creative Commons Attribution License, which permits unrestricted use, distribution, and reproduction in any medium, provided the original author and source are credited.
Conflict of interest statement
The authors have declared that no competing interests exist.
Figures


References
-
- FAO. Mapping supply and demand for animal-source foods to 2030. In: Robinson TP, Pozzi F, editors. Animal Production and Health Working Paper: Rome. 2011; 2:1–54.
-
- Delgado C, Rosegrant M, Steinfeld H, Ehui S, Courbois C. Livestock to 2020: The Next Food Revolution. Outlook Agric 2001. Mar 1;30(1):27–9.
-
- Onwuka CFI, Isah OA, Oni AO, Aderinboye RY. Ruminant animal nutrition. University os Agriculture, Abeokuta, ANN503. Abeokuta, Ogun State, Nigeria: College of Animal Science and Livestock Production, Federal University of Agriculture (FUNAAB); 2011.
Publication types
MeSH terms
Substances
LinkOut - more resources
Full Text Sources
Research Materials
