. 2023 Jan 13;9(2):eade6049.
doi: 10.1126/sciadv.ade6049. Epub 2023 Jan 13.

Toward naturalistic neuroscience: Mechanisms underlying the flattening of brain hierarchy in movie-watching compared to rest and task

Affiliations

Toward naturalistic neuroscience: Mechanisms underlying the flattening of brain hierarchy in movie-watching compared to rest and task

Morten L Kringelbach et al. Sci Adv. .

Abstract

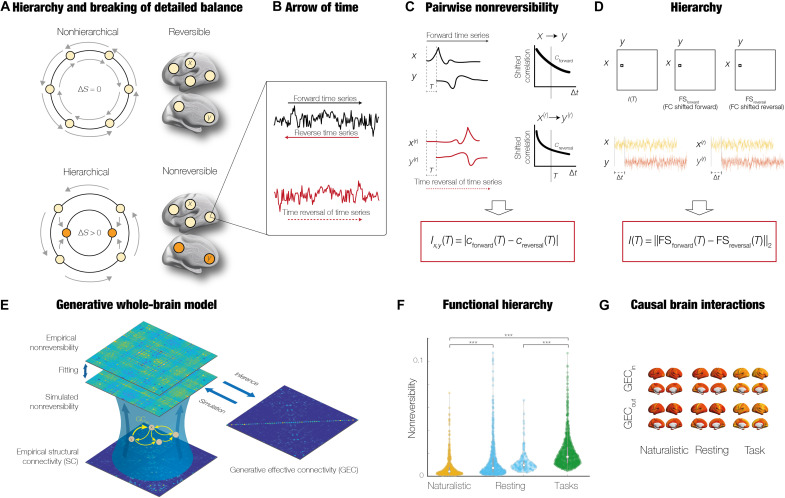
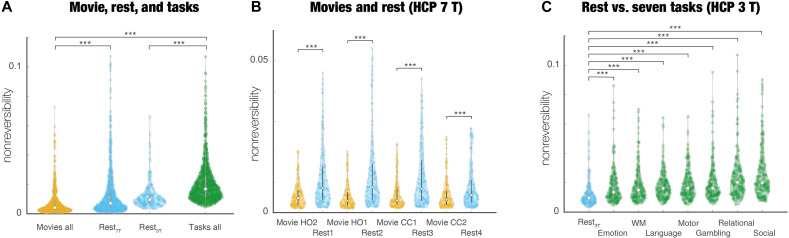
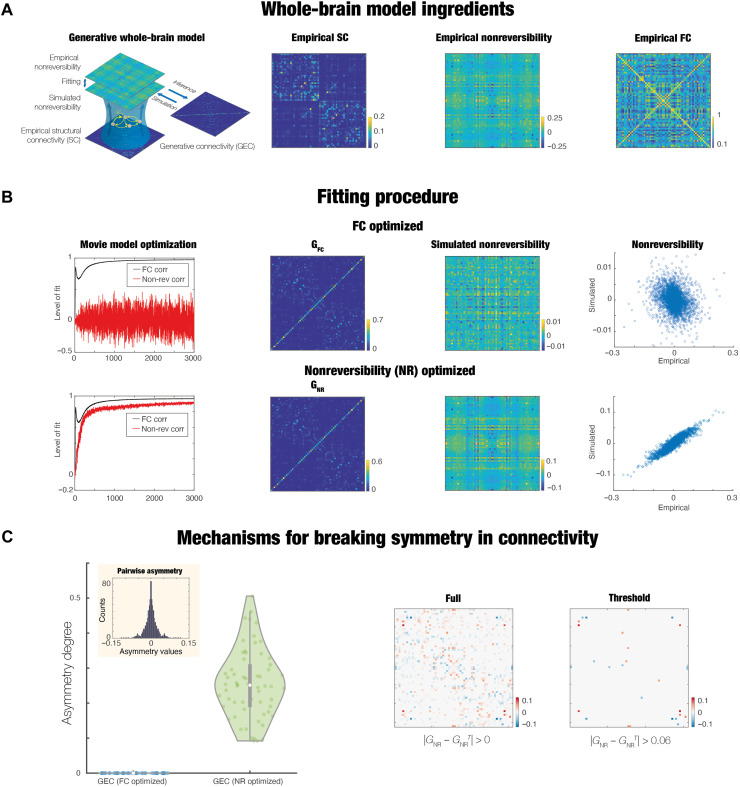
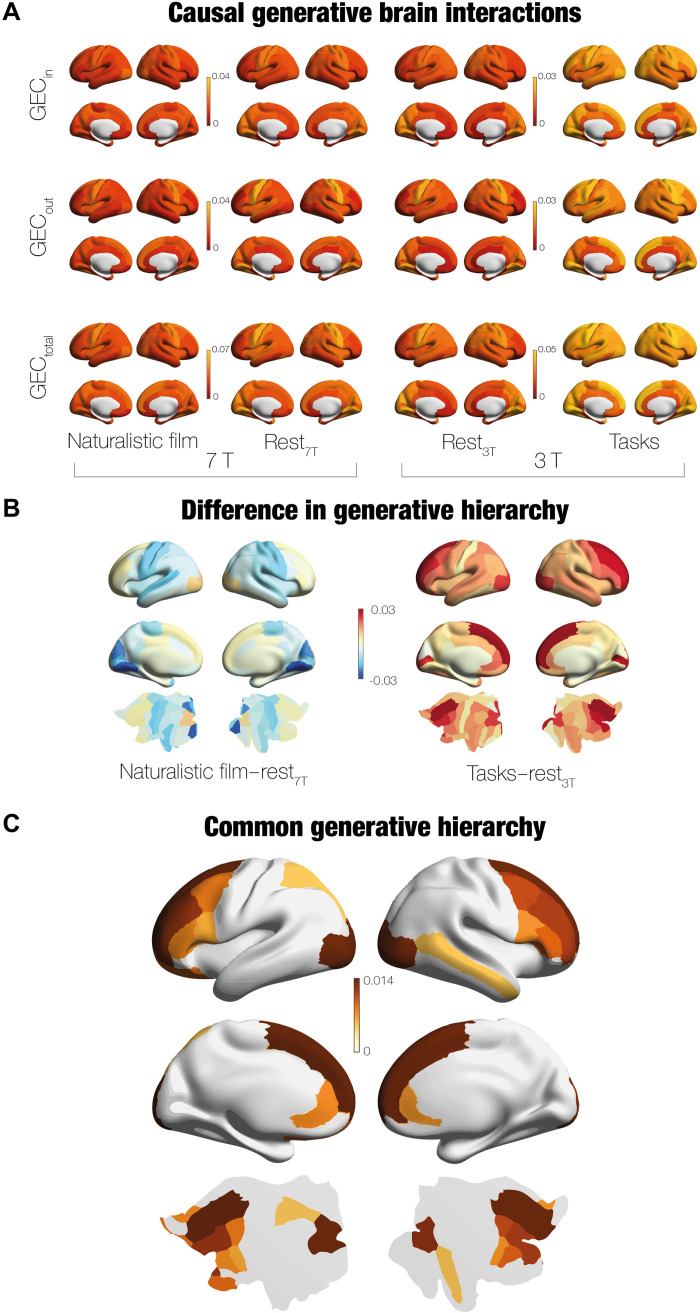
Identifying the functional specialization of the brain has moved from using cognitive tasks and resting state to using ecological relevant, naturalistic movies. We leveraged a large-scale neuroimaging dataset to directly investigate the hierarchical reorganization of functional brain activity when watching naturalistic films compared to performing seven cognitive tasks and resting. A thermodynamics-inspired whole-brain model paradigm revealed the generative underlying mechanisms for changing the balance in causal interactions between brain regions in different conditions. Paradoxically, the hierarchy is flatter for movie-watching, and the level of nonreversibility is significantly smaller in comparison to both rest and tasks, where the latter in turn have the highest levels of hierarchy and nonreversibility. The underlying mechanisms were revealed by the model-based generative effective connectivity (GEC). Naturalistic films could therefore provide a fast and convenient way to measure important changes in GEC (integrating functional and anatomical connectivity) found in, for example, neuropsychiatric disorders. Overall, this study demonstrates the benefits of moving toward a more naturalistic neuroscience.


Figures

Fig. 1.
Fig. 1.. GCAT framework for discovering underlying causal mechanisms of hierarchical organization.
(A) Level of hierarchy is given by the level of asymmetry of causal interactions between brain regions arising from the breaking of the detailed balance. The upper subpanel shows a nonhierarchical system in full detailed balance and thus fully reversible over time, i.e., no change in production entropy, S. In contrast, the bottom subpanel shows a change in production entropy, reflecting the asymmetry of the underlying causal interactions. (B) Estimating the arrow of time requires the forward time series of each region (in black) and the time-reversed time series (in red). (C) Basic principle of how the level of NR can be computed through the pairwise level of asymmetry using a time-shifted measure of the correlations between the forward (x, y) (top row) and the reversed [x(r), y(r)] time series (bottom row). The difference between these time-shifted correlations provides a quantification of the asymmetry in the interactions between pairs of regions (for a given shift ∆t = T). (D) Hierarchy is computed through the generalization of the pairwise NR for the whole brain, i.e., as a matrix involving all pairs. The hierarchy is given by the NR matrix, which is the difference between the two time-shifted correlation matrices for the forward and reversed time series (at a given shift time point ∆t = T; see Methods). (E) NR matrix is used to fit a whole-brain model creating the GEC, which provides the underlying causal mechanisms (see Methods). (F) Average of the NR matrix provides a model-free estimate of the hierarchy that can be contrasted over conditions. (G) Further mechanistic insights into hierarchy can be provided by rendering the in and out degree of the GEC matrix.
Fig. 2.
Fig. 2.. Different functional hierarchies for movies, rest, and tasks.
We estimated the functional hierarchy as characterized by the levels of NR. (A) Direct comparison of hierarchy in naturalistic movie, rest, and tasks shows that movie-watching (averaged over all sessions) has a significantly more flattened hierarchy (i.e., lower NR) compared to both rest and tasks (average over all seven tasks). Rest is less nonreversible than movie-watching but significantly less than task. (B) Each session of movie-watching (measured with 7-T fMRI) is significantly less nonreversible than rest. (C) Equally, all seven cognitive tasks (measured with 3-T fMRI) are significantly more hierarchically (i.e., nonreversible) than rest, suggesting the importance of hierarchy for computation.
Fig. 3.
Fig. 3.. Whole-brain model provides causal insights into the functional hierarchy of movie-watching.
The figure shows how to identify the underlying causal mechanisms resulting in the different levels of hierarchy (i.e., NR) when movie-watching. (A) Procedure starts with fitting a whole-brain model, initially using the anatomical connectivity and then iteratively adjusting a GEC according to either fitting this to the empirical FC alone (GFC) or including the NR (GNR) matrices. (B) Upper row shows the optimization of the whole-brain model based on optimizing only with FC, while the lower row shows the same but including the optimization with NR. As can be seen in the leftmost panels, the evolution of learning improves the level of fit to FC (correlation between empirical and simulated matrices, black curves) in both cases but only fitting the FC does not give a good fit to the empirical NR (see red curves). The second column of panels show the optimized GEC matrices (GFC and GNR). While difficult to discern, the former is symmetrical, while the latter is asymmetrical, as quantified below. The third column of panels shows the simulated NR matrices, and the level of fit to the empirical NR is shown in the scatterplot in the fourth column of panels. It is very clear that only the GNR optimization is able to capture the level of empirical NR and consequently, the hierarchy. (C) Leftmost figure is quantifying the level of asymmetry of the GNR. As can be seen in the boxplot, there is no asymmetry for GFC, but strong asymmetry for GNR. This is further explored in the inset, which shows that there are many asymmetric pairs of brain regions. Last, we visualize these asymmetries with the full and thresholded matrices.
Fig. 4.
Fig. 4.. Identifying the underlying causal drivers of hierarchy changes in movies, rest and tasks.
We can determine the information flow in terms of drivers and receivers by using the matrices of the GEC, obtained through using a whole-brain model for movies, rest, and tasks (fitted to both the model-free measures of NR and FC). This provides direct measures of the underlying brain hierarchy. (A) For all conditions, the figures show the receivers (incoming, Gin), drivers (outgoing, Gout), and their sum (Gtotal). The hierarchy is given by the gradations in color and, as can be seen movie, has a significantly lower hierarchy (deeper red) than both rest (orange) and task (strongest yellow). (B) Decrease in hierarchy in movies versus rest can be explicit shown by rendering the difference between their respective Gtotal. As can be seen from the colormap, where negative values are more blue and positive values are more yellow, only prefrontal and some visual regions are stronger for movies than rest. In other words, while the general hierarchy is flattened in movies, the prefrontal and visual regions are more nonreversible for movies, suggesting that the computation performed by these regions drives the breaking of the detailed balance when movie-watching. In contrast, when comparing the Gtotal for the average over all tasks versus rest, the general hierarchy is significantly larger for tasks and the main drivers of the computation is again found primarily in the prefrontal regions. (C) Confirming the role of prefrontal cortex in driving the breaking of the detailed balance, we computed the intersection of the top 50% regions of the contrasts shown in (B). This showed that primarily prefrontal regions (as well as some parietal, visual, and temporal) are the common drivers orchestrating computation in the brain.
Fig. 5.
Fig. 5.. GEC is excellent for classification of movie-watching.
We used machine learning to classify movie-watching compared to rest and between different movies using either GEC or FC. (A) Figure shows the boxplots of the classification performance (across 100-fold) and the associated average confusion matrix. As can be seen, the classification is much better when using GEC than using FC (with the performance numbers shown on the figure). (B) Similarly, the classification of specific movie extracts (Hollywood or CC license on Vimeo) is also much better when using GEC than using FC. Here, using classification with GEC is significantly better than using FC. As can be seen, the average performance for GEC is 93.4%, while the average performance using FC is closer to chance levels (62.7%). Overall, the GEC provides the causal mechanistic principles for a given condition and therefore is excellent for classification of that condition.

References

    1. J. R. Andrews-Hanna, J. Smallwood, R. N. Spreng, The default network and self-generated thought: Component processes, dynamic control, and clinical relevance. Ann. N. Y. Acad. Sci. 1316, 29–52 (2014). - PMC - PubMed
    1. J. R. Andrews-Hanna, The brain's default network and its adaptive role in internal mentation. Neuroscientist 18, 251–270 (2012). - PMC - PubMed
    1. S. Sonkusare, M. Breakspear, C. Guo, Naturalistic stimuli in neuroscience: Critically acclaimed. Trends Cogn. Sci. 23, 699–714 (2019). - PubMed
    1. U. Hasson, Y. Nir, I. Levy, G. Fuhrmann, R. Malach, Intersubject synchronization of cortical activity during natural vision. Science 303, 1634–1640 (2004). - PubMed
    1. A. Bartels, S. Zeki, Functional brain mapping during free viewing of natural scenes. Hum. Brain Mapp. 21, 75–85 (2004). - PMC - PubMed