. 2023 Jan 13;9(2):eadd5163.
doi: 10.1126/sciadv.add5163. Epub 2023 Jan 13.

Nicotinamide riboside improves muscle mitochondrial biogenesis, satellite cell differentiation, and gut microbiota in a twin study

Affiliations

Nicotinamide riboside improves muscle mitochondrial biogenesis, satellite cell differentiation, and gut microbiota in a twin study

Helena A K Lapatto et al. Sci Adv. .

Abstract

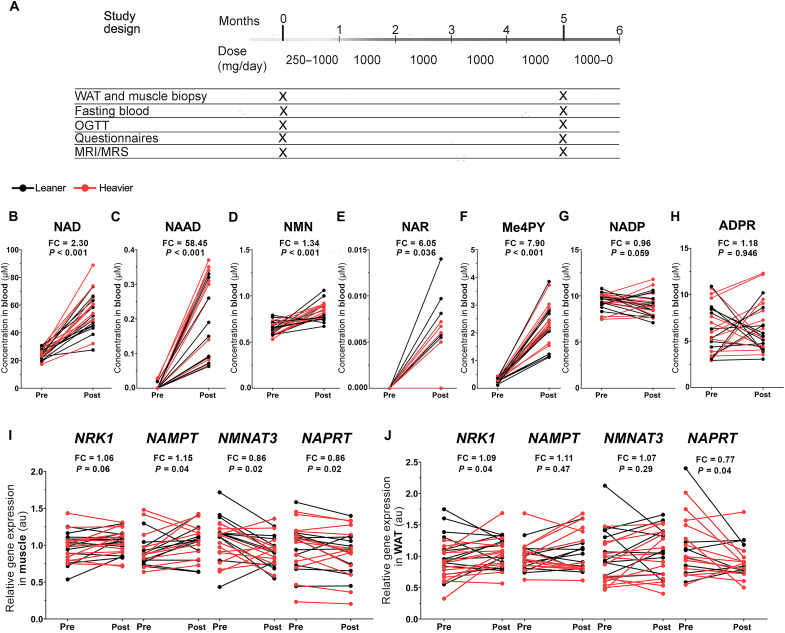
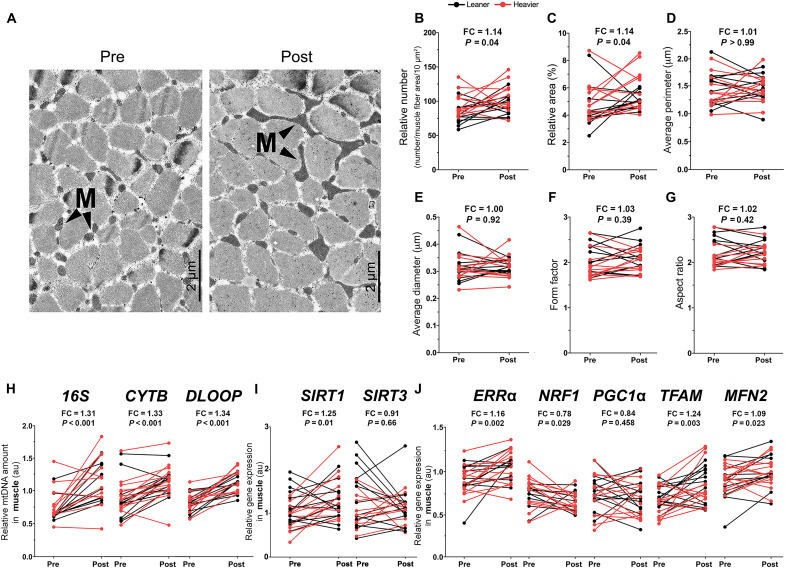
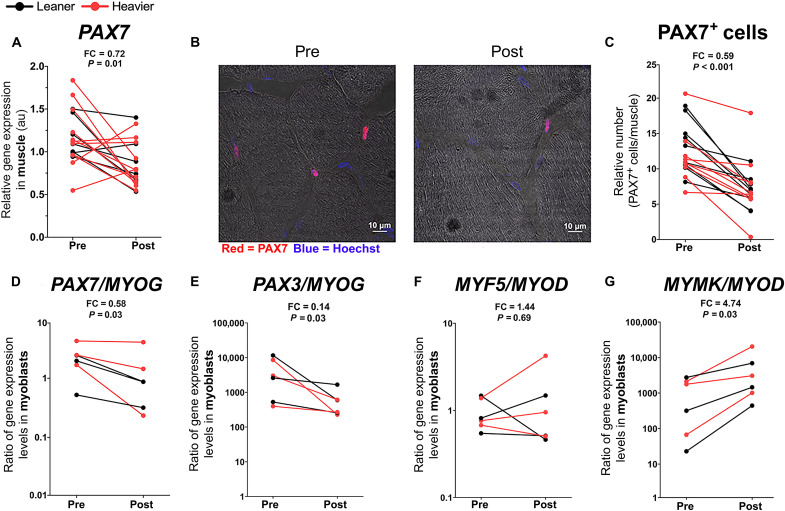
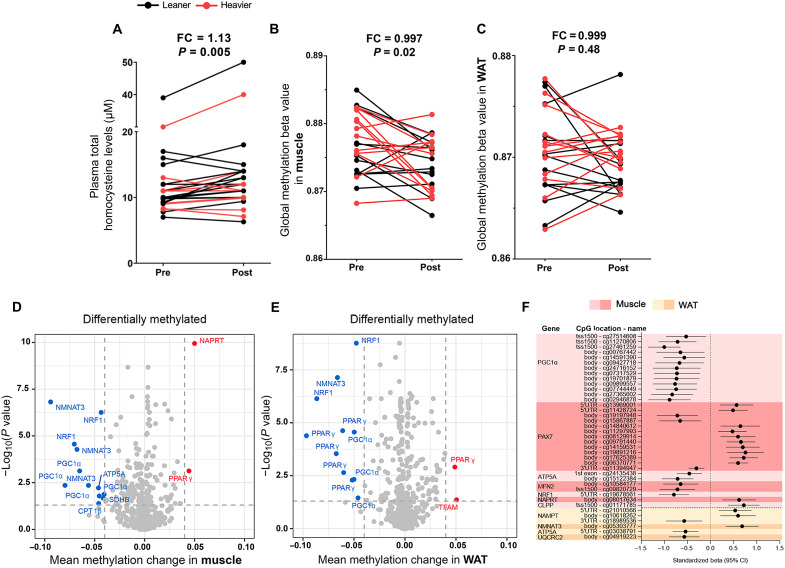
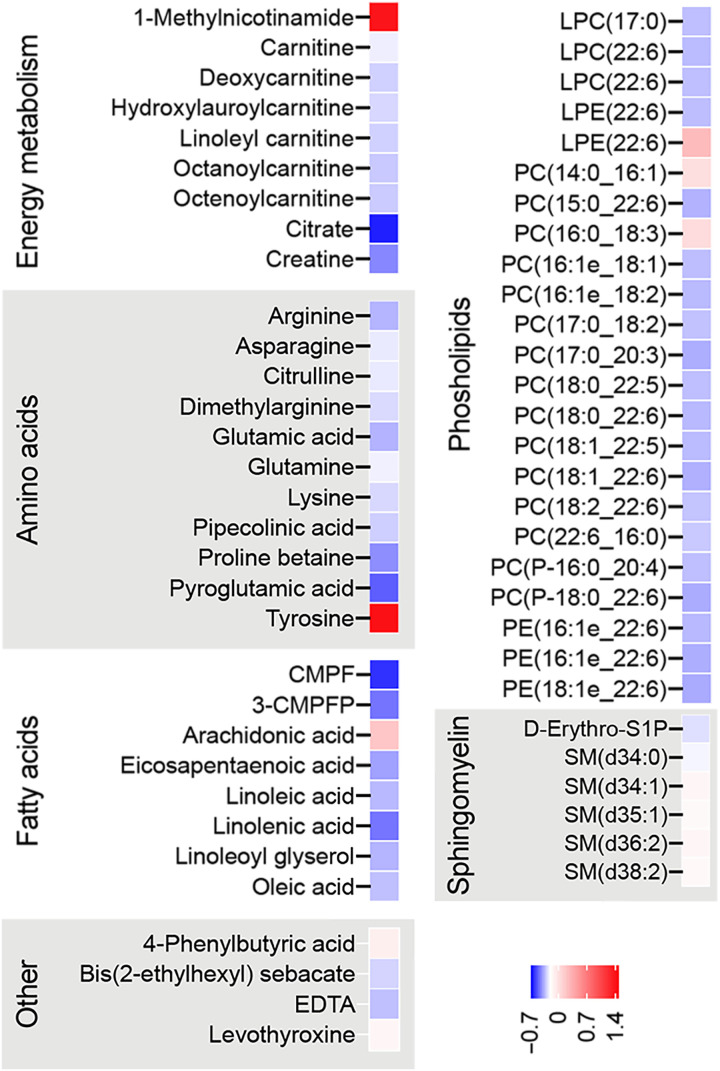
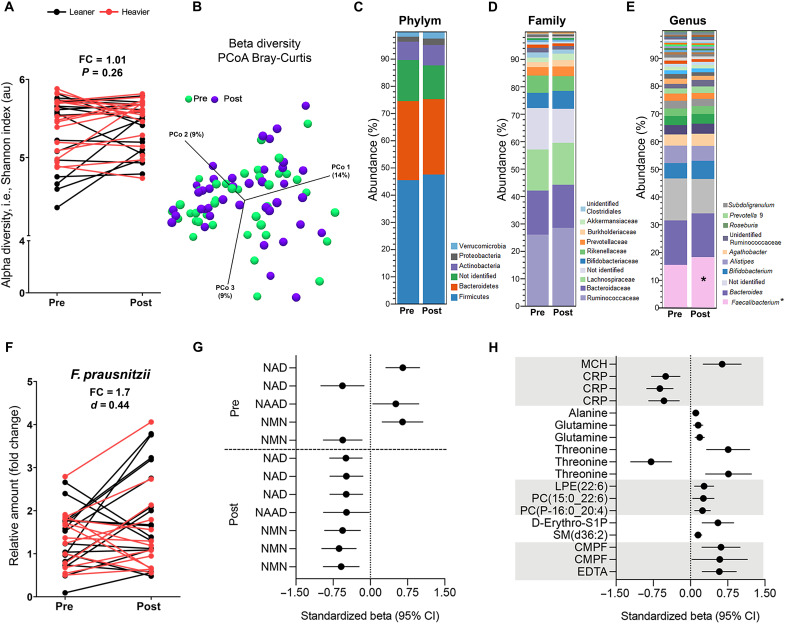
Nicotinamide adenine dinucleotide (NAD+) precursor nicotinamide riboside (NR) has emerged as a promising compound to improve obesity-associated mitochondrial dysfunction and metabolic syndrome in mice. However, most short-term clinical trials conducted so far have not reported positive outcomes. Therefore, we aimed to determine whether long-term NR supplementation boosts mitochondrial biogenesis and metabolic health in humans. Twenty body mass index (BMI)-discordant monozygotic twin pairs were supplemented with an escalating dose of NR (250 to 1000 mg/day) for 5 months. NR improved systemic NAD+ metabolism, muscle mitochondrial number, myoblast differentiation, and gut microbiota composition in both cotwins. NR also showed a capacity to modulate epigenetic control of gene expression in muscle and adipose tissue in both cotwins. However, NR did not ameliorate adiposity or metabolic health. Overall, our results suggest that NR acts as a potent modifier of NAD+ metabolism, muscle mitochondrial biogenesis and stem cell function, gut microbiota, and DNA methylation in humans irrespective of BMI.


Figures

Fig. 1.
Fig. 1.. NR increases whole-blood NAD+ levels and tissue NAD+ biosynthesis in the twins from the BMI-discordant pairs.
(A) Study protocol. The daily NR dose was gradually escalated from 250 mg/day by 250 mg/week to achieve the final treatment dose of 1 g/day. At the end of the study, the dose was decreased by 250 mg/week. Clinical examinations and collection of fasting blood samples and muscle and WAT biopsies were performed at baseline and after 5 months. (B to H) Whole-blood NAD metabolite levels before versus after NR (n = 14 twin pairs/28 individuals). (I and J) Expression of genes involved in NAD+ biosynthesis in muscle (I) and WAT (J) before versus after NR (n = 10 to 13 twin pairs/21 to 26 individuals). Arbitrary unit (au) indicates the relative target gene expression normalized to the expression of reference genes. Lines connect the pre- and post-values of each individual, with black denoting the leaner and red denoting the heavier cotwins. Fold change (FC) indicates the mean of the post-NR value divided by the pre-NR value. P values were calculated using paired Wilcoxon signed-rank test. See also Table 2 and figs. S1 and S2.
Fig. 2.
Fig. 2.. NR boosts muscle mitochondrial biogenesis in the twins from the BMI-discordant pairs.
(A) TEM images of muscle intermyofibrillar mitochondria (M) in one representative study participant before and after NR. Magnification, ×2000. Scale bars, 2 μm. (B to G) Quantification of (B) the number of mitochondria per 10 μm2 relative to the muscle fiber area, (C) percentage of mitochondrial surface area per total muscle fiber area, (D) average perimeter of mitochondria, (E) average diameter of mitochondria, (F) form factor (the branching of mitochondria), and (G) aspect ratio (the length-to-width ratio of mitochondria) in muscle biopsies (n = 11 twin pairs/22 individuals). (H) Muscle relative mtDNA amount presented as a ratio of mtDNA genome per nuclear genome before versus after NR (n = 11 to 12 twin pairs/22 to 25 individuals). 16S, 16S rRNA; CYTB, cytochrome b; DLOOP, D-loop region. (I and J) Gene expression of SIRT1 and SIRT3 (I) and other key regulators of mitochondrial biogenesis (J) in muscle before versus after NR (n = 10 to 12 twin pairs/21 to 28 individuals). Arbitrary unit indicates the relative gene expression normalized to the expression of reference genes. SIRT3, sirtuin 3. Lines connect the pre- and post-values of each individual, with black denoting the leaner and red denoting the heavier cotwins. Fold change indicates the mean of the post-NR value divided by the pre-NR value. P values were calculated using paired Wilcoxon signed-rank test. See also Table 2 and fig. S3.
Fig. 3.
Fig. 3.. NR promotes muscle satellite cell differentiation in the twins from the BMI-discordant pairs.
(A) Muscle gene expression level of satellite cell marker PAX7 before versus after NR (n = 9 twin pairs/18 individuals). (B) Immunostaining of PAX7+ satellite cells in muscle cryosections before versus after NR in one representative study participant. PAX7 (red, satellite cells); Hoechst (blue, nuclei). Scale bars, 10 μm. (C) Muscle PAX7+ satellite cell quantification before versus after NR (n = 10 twin pairs/20 individuals). (D to G) Ratios of PAX7/MYOG (D), PAX3/MYOG (E), MYF5/MYOD (F), and MYMK/MYOD (G) mRNA expression in myoblasts before versus after NR (n = 3 twin pairs/6 individuals). Y axis is on a logarithmic scale. PAX3, paired box 3; MYF5, myogenic factor 5. Lines connect the pre- and post-values of each individual, with black denoting the leaner and red denoting the heavier cotwins. Fold change indicates the mean of the post-NR value divided by the pre-NR value. P values were calculated using paired Wilcoxon signed-rank test. See also Table 2.
Fig. 4.
Fig. 4.. NR modifies the epigenetic control of gene expression in the twins from the BMI-discordant pairs.
(A to C) Plasma total homocysteine (A) and global DNA methylation levels in (B) muscle and (C) WAT before versus after NR (n = 12 to 13 twin pairs/24 to 26 individuals). Lines connect the pre- and post-values of each individual, with black denoting the leaner and red denoting the heavier cotwins. Fold change indicates the mean of the post-NR value divided by the pre-NR value. (D and E) Volcano plots showing statistical significance (y axis) and the magnitude of the change in mean methylation beta value (x axis) in (D) muscle and (E) WAT upon NR (n = 12 to 14 twin pairs/25 to 28 individuals). Each dot represents a single CpG site (n = 619 and 518 in muscle and WAT, respectively). Highlighted are CpGs with FDR P < 0.05 (dashed horizontal line). CPT1β, carnitine palmitoyltransferase 1β; SDHB, succinate dehydrogenase complex iron sulfur subunit B. (F) Significant associations between CpG site methylation and gene expression in muscle (red) and WAT (yellow) upon NR (n = 7 to 9 twin pairs/14 to 18 individuals). Standardized beta values show the SD values in methylation changes associated with 1 SD of gene expression change. CI, confidence interval; CLPP, caseinolytic mitochondrial matrix peptidase proteolytic subunit; UQCRC2, ubiquinol–cytochrome c reductase core protein 2. P values for plasma total homocysteine levels were calculated using paired Wilcoxon signed-rank test. Statistical analyses of methylation data are described in Materials and Methods. See also Table 2 and tables S1 to S3.
Fig. 5.
Fig. 5.. NR alters plasma metabolomic profile in the twins from the BMI-discordant pairs.
Heatmaps showing significant plasma metabolite log2-fold changes after NR (n = 14 twin pairs/28 individuals; nominal P < 0.05). Blue color indicates lower and red color indicates higher metabolite level upon NR. CMPF, 3-carboxy-4-methyl-5-propyl-2-furanopropionic acid; 3-CMPFP, 3-carboxy-4-methyl-5-pentyl-2-furanpropanoic acid; LPC, lysophosphatidylcholine; LPE, lysophosphatidyl-ethanolamine; PC, phosphatidylcholine; PE, phosphatidylethanolamine; D-Erythro-S1P, d-erythro-sphingosine-1-phosphate; SM, sphingomyelin. Related statistical analyses are described in Materials and Methods. See also tables S4 and S5.
Fig. 6.
Fig. 6.. NR improves the gut microbiota composition in the twins from the BMI-discordant pairs.
(A) Alpha-diversity of the gut microbiota before versus after NR (n = 11 twin pairs/22 individuals). Lines connect the pre- and post-values of each individual, with black denoting the leaner and red denoting the heavier cotwins. Fold change indicates the mean of the post-NR value divided by the pre-NR value. (B) Principal components analysis (PCoA) of the gut microbiota beta-diversity before versus after NR (n = 11 twin pairs/22 individuals). (C to E) Average gut microbiota abundance at the phylum (C), family (D), and genus (E) level before versus after NR (n = 11 twin pairs/22 individuals). In the legends of the bars, the phylum level shows all detected phyla in the samples and at the family and genus level. Asterisk indicates nominal P < 0.05. (F) Relative amount of F. prausnitzii presented as a fold change to 16S rRNA amount in fecal DNA before versus after NR (n = 11 twin pairs/22 individuals). Cohen’s d value of 0.44 suggests a medium effect size. (G and H) Standardized beta values showing SD values in (G) NAD metabolites associated with 1 SD in baseline abundance of Faecalibacterium or Faecalibacterium abundance change upon NR and in (H) clinical variables and plasma metabolites associated with NR-induced changes in Faecalibacterium (n = 11 twin pairs/22 individuals). Rows represent associations with Faecalibacterium OTUs. MCH, mean corpuscular hemoglobin. Statistical analyses are described in Materials and Methods. See also tables S6 and S7.

References

    1. R. Jokinen, S. Pirnes-Karhu, K. H. Pietiläinen, E. Pirinen, Adipose tissue NAD+-homeostasis, sirtuins and poly(ADP-ribose) polymerases—Important players in mitochondrial metabolism and metabolic health. Redox Biol. 12, 246–263 (2017). - PMC - PubMed
    1. C. Cantó, K. J. Menzies, J. Auwerx, NAD+ metabolism and the control of energy homeostasis: A balancing act between mitochondria and the nucleus. Cell Metab. 22, 31–53 (2015). - PMC - PubMed
    1. L. Rajman, K. Chwalek, D. A. Sinclair, Therapeutic potential of NAD-boosting molecules: The in vivo evidence. Cell Metab. 27, 529–547 (2018). - PMC - PubMed
    1. S. H. Ganji, G. D. Kukes, N. Lambrecht, M. L. Kashyap, V. S. Kamanna, Therapeutic role of niacin in the prevention and regression of hepatic steatosis in rat model of nonalcoholic fatty liver disease. Am. J. Physiol. Gastrointest. Liver Physiol. 306, G320–G327 (2014). - PubMed
    1. E. Pirinen, M. Auranen, N. A. Khan, V. Brilhante, N. Urho, A. Pessia, A. Hakkarainen, J. K. Ulla Heinonen, M. S. Schmidt, K. Haimilahti, P. Piirilä, N. Lundbom, M. R. Taskinen, C. Brenner, V. Velagapudi, K. H. Pietiläinen, A. Suomalainen, Niacin cures systemic NAD+ deficiency and improves muscle performance in adult-onset mitochondrial myopathy. Cell Metab. 31, 1078–1090. (2020). - PubMed

Publication types