. 2023 Mar;10(7):e2204599.
doi: 10.1002/advs.202204599. Epub 2023 Jan 13.

LncRNA LIMp27 Regulates the DNA Damage Response through p27 in p53-Defective Cancer Cells

Affiliations

LncRNA LIMp27 Regulates the DNA Damage Response through p27 in p53-Defective Cancer Cells

Ting La et al. Adv Sci (Weinh). 2023 Mar.

Erratum in

Abstract

P53 inactivation occurs in about 50% of human cancers, where p53-driven p21 activity is devoid and p27 becomes essential for the establishment of the G1/S checkpoint upon DNA damage. Here, this work shows that the E2F1-responsive lncRNA LIMp27 selectively represses p27 expression and contributes to proliferation, tumorigenicity, and treatment resistance in p53-defective colon adenocarcinoma (COAD) cells. LIMp27 competes with p27 mRNA for binding to cytoplasmically localized hnRNA0, which otherwise stabilizes p27 mRNA leading to cell cycle arrest at the G0/G1 phase. In response to DNA damage, LIMp27 is upregulated in both wild-type and p53-mutant COAD cells, whereas cytoplasmic hnRNPA0 is only increased in p53-mutant COAD cells due to translocation from the nucleus. Moreover, high LIMp27 expression is associated with poor survival of p53-mutant but not wild-type p53 COAD patients. These results uncover an lncRNA mechanism that promotes p53-defective cancer pathogenesis and suggest that LIMp27 may constitute a target for the treatment of such cancers.

Keywords: E2F1; LIMp27; colon cancer; hnRNPA0; lncRNA; p27.


Conflict of interest statement

The authors declare no conflict of interest.

Figures
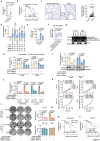
Figure 1
Figure 1
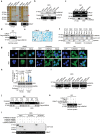
Identification of LIMp27 as an E2F1‐responsive lncRNA that selectively supports the viability of p53‐defective cancer cells. a) LIMp27 is upregulated in COAD compared with corresponding normal tissues as revealed by analysis of the lncRNA expression data in the TCGA dataset. Data are mean ± s.d.; two‐tailed Student's t‐test. N: normal tissues; T: tumor tissues. b) Kaplan–Meier analysis of the probability of overall survival of COAD patients (n = 371) derived from the TCGA using the median of LIMp27 levels as the cut‐off. c) Representative microphotographs and quantitation of in situ hybridization (ISH) analysis of LIMp27 expression in formalin‐fixed paraffin‐embedded (FFPE) COAD tissues (n = 77 biologically independent samples) compared with corresponding paired adjacent normal tissues. Scale bar, 20 µm. RS: reactive score. Two‐tailed Student's t‐test. d) qPCR analysis showing that LIMp27 was generally more abundant in colon cancer cell lines than in the normal colon epithelial cell line FHC. Data are mean ± s.d.; n = 3 independent experiments, two‐tailed Student's t‐test. e) Absolute quantitation of LIMp27 in HT‐29 and HCT116 COAD cell lines and the normal colon epithelial cell line FHC using qPCR. Data are mean ± s.d.; n = 3 independent experiments, two‐tailed Student's t‐test. f) Comparison of LIMp27 expression between normal colon mucosa, colon adenoma, and colon cancer tissues derived from R2 public dataset. Data are mean ± s.d.; one‐way ANOVA followed by Tukey's multiple comparisons test. g) Chromatin immunoprecipitation (ChIP) analysis of the association between endogenous E2F1 and the E2F1‐binding motifs at the promoter of LIMp27 in HT‐29 and WiDr cell lines. Data are representatives of three independent experiments. h) SiRNA knockdown of E2F1 reduced the transcriptional activity of a LIMp27 promoter reporter construct (pGL3‐LIMp27 promoter). Data are mean ± s.d.; n = 3 independent experiments, two‐tailed Student's t‐test. i) E2F1 silencing downregulated LIMp27 expression in HT‐29 and WiDr cell lines. Data are representatives or mean ± s.d.; n = 3 independent experiments, one‐way ANOVA followed by Tukey's multiple comparisons test. j–l) SiRNA knockdown of LIMp27 (j) inhibited cell proliferation (k) and clonogenicity (l) in HT‐29 and WiDr (p53 mutant) but not in HCT116 and RKO (p53 WT) cell lines. Data are mean ± s.d. or representatives; n = 3 independent experiments, one‐way ANOVA followed by Tukey's multiple comparison test. Scale bar, 1 cm. m,n) Kaplan–Meier analysis of the probability of overall survival of COAD patients with tumors carrying mutant p53 (m) and wild‐type p53 tumors (n) derived from the TCGA using the median of LIMp27 levels as the cut‐off.
Figure 2
Figure 2
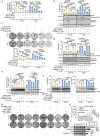
LIMp27 promotes p53‐mutant COAD cell proliferation and tumorigenicity. a–c) SiRNA knockdown of LIMp27 inhibited 5‐bromo‐2′‐deoxyuridine (BrdU) incorporation (a) and caused G0/G1 phase cell cycle arrest (b) but did not cause significant cell death (c) in HT‐29 and WiDr cell lines. Data are mean ± s.d; n = 3 independent experiments, one‐way ANOVA followed by Tukey's multiple comparison test. d–f, SiRNA knockdown of LIMp27 did not affect BrdU incorporation (d), G0/G1 phase cell cycle arrest (e), and cell death (f) in HCT116 and RKO cell lines. Data are mean ± s.d; n = 3 independent experiments, one‐way ANOVA followed by Tukey's multiple comparison test. g,h) Induced knockdown of LIMp27 by doxycycline (Dox, 1 µg mL−1) (g) inhibited BrdU incorporation (h) in HT‐29.shLIMp27 and Caco‐2.shLIMp27 cell sublines, but not in HT‐29.shCtrl and Caco‐2.shCtrl cell sublines. Data are mean ± s.d; n = 3 independent experiments, two‐tailed Student's t‐test. i) Induced knockdown of LIMp27 inhibited the clonogenicity, which was partially reversed by Dox (1 µg mL−1) withdrawal of HT‐29.shLIMp27 and Caco‐2.shLIMp27 cell sublines. Similar effects were not observed in HT‐29.shCtrl and Caco‐2.shCtrl cell sublines. Data are representatives or mean ± s.d.; n = 3 independent experiments, one‐way ANOVA followed by Tukey's multiple comparisons test. Scale bar, 1 cm. j,k) Growth curves (j) and representative photographs and tumor weights (k) showing induced knockdown of LIMp27 by Dox retarded HT‐29.shLIMp27 xenograft growth, which was reversed by Dox withdrawal in nu/nu mice. Data are mean ± s.d.; n = 6 mice per group, one‐way ANOVA followed by Tukey's multiple comparison test. Dox: 2 mg mL−1 supplemented with 10 mg mL−1 sucrose in drinking water.
Figure 3
Figure 3
LIMp27 represses p27 expression through destabilizing p27 mRNA. a) LIMp27 knockdown upregulated p27 expression at both mRNA and protein levels. Data are mean ± s.d. or representatives; n = 3 independent experiments, one‐way ANOVA followed by Tukey's multiple comparison test. b–e) LIMp27 knockdown‐induced upregulation of p27 expression (b), inhibition of BrdU incorporation (c), and clonogenicity (d), and G0/G1 phase cell cycle arrest (e) were diminished by p27 co‐knockdown in HT‐29 and WiDr cell lines. Data are representatives or mean ± s.d.; n = 3 independent experiments, One‐way ANOVA followed by Tukey's multiple comparisons test. Scale bar, 1 cm. f,g) Total RNA from HT‐29 (f) and WiDr (g) cell lines transfected with indicated siRNAs and treated with Actinomycin D (Act D, 1 µg mL−1) for indicated periods were subjected to qPCR. Data are mean ± s.d.; n = 3 independent experiments, two‐tailed Student's t‐test. h,i) Whole‐cell lysates from HT‐29 (h) and WiDr (i) cell lines transfected with indicated siRNAs and treated with cycloheximide (CHX; 5 mg mL−1) for indicated periods were subjected to Western blotting (left panel). Quantitation of p27 expression normalized to GAPDH was shown (right panel). Data are representatives or mean ± s.d.; n = 3 independent experiments, two‐tailed Student's t‐test.
Figure 4
Figure 4
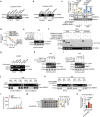
LIMp27 interacts with cytoplasmic hnRNPA0. a) RNA pulldown followed by mass spectrometry analysis identified that hnRNPA0 (indicated by arrows) is the most abundant protein co‐pulled down with LIMp27 antisense probes in HT‐29 and WiDr cell lines. S: sense; AS: antisense. n = 1 experiment. b) hnRNPA0 was co‐pulled down with LIMp27 in HT‐29 and Caco‐2 cell lines as shown in RNA pulldown (RPD) assays. hnRNPM was included as a negative control. S, sense; AS, antisense. Data are representatives of three independent experiments. c) LIMp27 was co‐precipitated with hnRNPA0 in HT‐29 and WiDr cell lines as shown in RNA immunoprecipitation (RIP) assays. The lncRNA PLANE was included as a negative control. Data are representatives of three independent experiments. d) In vitro‐synthesized LIMp27 was co‐precipitated with recombinant Flag‐tagged hnRNPA0 protein as shown in RIP assays in a cell‐free system. Data are representatives of three independent experiments. e) Representative microphotographs of in situ hybridization (ISH) analysis of LIMp27 expression in Caco‐2 cell line. DapB: negative control. Scale bar, 10 µm. Data are representatives of three independent experiments. f) Western blotting showing hnRNPA0 protein is mainly localized in the nucleus of HT‐29 and WiDr cell lines under steady‐state conditions. DNA damage inducers oxaliplatin (1 µm) and UV irradiation (10 J m−2) caused the relocation of hnRNPA0 from the nucleus to the cytoplasm. Lamin A/C and GAPDH were included as controls for nuclear and cytoplasmic fractions, individually. Data are representatives of three independent experiments, Cyto: cytoplasm; Nucl: nucleus. g) Immunofluorescence staining of hnRNPA0 in HT‐29 and WiDr cell lines treated with or without oxaliplatin (1 µm) or UV irradiation (10 J m−2). Scale bar, 20 µm. h) Oxaliplatin (1 µm) and UV irradiation (10 J m−2) caused upregulation of LIMp27 along with E2F1 expression in HT‐29 and WiDr cell lines. Data are representatives or mean ± s.d.; n = 3 independent experiments, One‐way ANOVA followed by Tukey's multiple comparisons test. i) hnRNPA0 was co‐pulled down with LIMp27 in cytoplasm but not nucleus in HT‐29 and WiDr cell lines. S, sense; AS, antisense; C: cytoplasm; N: nucleus. Data are representatives of three independent experiments. j) Oxaliplatin (1 µm) treatment increased the amount of LIMp27 associated with hnRNPA0 in HT‐29 and WiDr cell lines. Data are representatives of three independent experiments. k) In vitro‐synthesized LIMp27 but not LIMp27 antisense (AS) and LIMp27 with hnRNPA0‐BRs deletion, was co‐precipitated with recombinant Flag‐tagged hnRNPA0 protein in a cell‐free system as shown in RIP assays. Data are representatives of three independent experiments. l) full‐length hnRNPA0 protein but not hnRNPA0 with either RNA recognition motif 1 (RRM1) or RRM2 deletion mutant were co‐pulled down by LIMp27 as shown in RNA pulldown (RPD) assays. Data are representatives of three independent experiments.
Figure 5
Figure 5
LIMp27 promotes p27 mRNA degradation through competitively binding to cytoplasmic hnRNPA0. a) Cytoplasmic hnRNPA0 was co‐pulled down with p27 mRNA in HT‐29 and WiDr cell lines as shown in RNA pulldown (RPD) assays. C: cytoplasm. Data are representatives of three independent experiments. b) p27 mRNA was co‐precipitated with hnRNPA0 in the cytoplasmic faction of HT‐29 and WiDr cell lines as shown in RNA immunoprecipitation (RIP) assays. C: cytoplasm. Data are representatives of three independent experiments. c,d) The upregulation of p27 expression (c) and increased stability of p27 mRNA (d) upon LIMp27 silencing ware reversed by knockdown of hnRNPA0. Data are representatives or mean ± s.d.; n = 3 independent experiments, One‐way ANOVA followed by Tukey's multiple comparisons test. e) In vitro‐synthesized p27 3′UTR was co‐precipitated with recombinant Flag‐tagged hnRNPA0 protein as shown in RIP assays in a cell‐free system. Data are representatives of three independent experiments. f) full‐length hnRNPA0 protein but not hnRNPA0 with either RNA recognition motif 1 (RRM1) or RRM2 deletion mutant was co‐pulled down by p27 mRNA as shown in RNA pulldown assays. Data are representatives of three independent experiments. g) LIMp27 was not co‐precipitated with the endogenous p27 mRNA as shown in dChIRP assays. Probes against LIMp27 RNA were used. Data are representatives of three independent experiments. h) Increasing amounts of in vitro‐synthesized LIMp27 (1, 5, 10, 20 µg) incubated with certain amounts of the 3′UTR of the p27 mRNA (10 µg) and recombinant hnRNPA0 were subjected to RIP assay. Data are representatives of three independent experiments. i) Increasing amounts of in vitro‐synthesized 3′UTR of p27 mRNA (1, 5, 10, 20 µg) incubated with certain amounts of the LIMp27 (10 µg) and recombinant hnRNPA0 were subjected to RIP assay. Data are representatives of three independent experiments. j) Induced knockdown of LIMp27 increased the amount of hnRNPA0 associated with p27 mRNA. Data are representatives; n = 3 independent experiments. k) Knockdown of p27 increased the amount of hnRNPA0 associated with LIMp27. Data are representatives; n = 3 independent experiments. l–n) Growth curves (l) and representative photographs and tumor weights (m) showing induced knockdown of LIMp27 by Dox increased p27 mRNA expression (n) and retarded HT‐29.shLIMp27 xenograft growth, which was reversed by hnRNPA0 stable knockdown in nu/nu mice. Data are mean ± s.d.; n = 6 mice per group, one‐way ANOVA followed by Tukey's multiple comparison test. Dox: 2 mg mL−1 supplemented with 10 mg mL−1 sucrose in drinking water.
Figure 6
Figure 6
LIMp27 regulates mutant p53 COAD cell responses to DNA‐damaging therapeutics.  a–c) HT‐29 and WiDr cells transfected with LIMp27 siRNA and treated with or without oxaliplatin (1 µm) for 24 h or IR (10 gy) were subjected to BrdU incorporation (a), cell death assay and Western blot (b) and clonogenicity assay (c). Data are mean ± s.d. or representatives; n = 3 independent experiments, One‐way ANOVA followed by Tukey's multiple comparisons test. Scale bar, 1 cm. d) HCT116 and RKO cells transfected with LIMp27 siRNA and treated with or without oxaliplatin (1 µm) for 24 h or IR (10 gy) were subjected to cell death assay and Western blot. Data are mean ± s.d.; n = 3 independent experiments, One‐way ANOVA followed by Tukey's multiple comparisons test. e) HT‐29 and WiDr cells transfected with LIMp27 siRNA and treated with or without oxaliplatin (1 µm) for 24 h or IR (10 gy) were subjected to qPCR and Western blot. Data are mean ± s.d.; n = 3 independent experiments, One‐way ANOVA followed by Tukey's multiple comparisons test. f,g) LIMp27 knockdown further inhibited cell viability (f) and clonogenicity (g), which was reversed by co‐knockdown of p27 in HT‐29 and WiDr cells treated with oxaliplatin (1 µm, left) and IR (10 gy, right). Data are mean ± s.d.; n = 3 independent experiments, One‐way ANOVA followed by Tukey's multiple comparisons test. h,i) Growth curves (h) and representative photographs and tumor weights (i) showing HT‐29.shLIMp27 xenografts in nu/nu mice treated with or without Dox (1 mg mL−1 supplemented with 10 mg mL−1 sucrose in drinking water) and/or oxaliplatin (5 mg kg−1 by intraperitoneal injection, twice a week). Data are representatives or mean ± s.d.; n = 6 mice per group, one‐way ANOVA followed by Tukey's multiple comparison test.

References

    1. Hu W. L., Jin L., Xu A., Wang Y. F., Thorne R. F., Zhang X. D., Wu M., Nat. Cell Biol. 2018, 20, 492. - PubMed
    1. Hoeijmakers J. H., N. Engl. J. Med. 2009, 361, 1475. - PubMed
    1. Mantovani F., Collavin L., Del Sal G., Cell Death Differ. 2019, 26, 199. - PMC - PubMed
    1. Bieging K. T., Mello S. S., Attardi L. D., Nat. Rev. Cancer 2014, 14, 359. - PMC - PubMed
    1. He G., Siddik Z. H., Huang Z., Wang R., Koomen J., Kobayashi R., Khokhar A. R., Kuang J., Oncogene 2005, 24, 2929. - PubMed

Publication types

MeSH terms