. 2023 Mar 20;62(13):e202212832.
doi: 10.1002/anie.202212832. Epub 2023 Feb 14.

Triggered Functional Dynamics of AsLOV2 by Time-Resolved Electron Paramagnetic Resonance at High Magnetic Fields

Affiliations

Triggered Functional Dynamics of AsLOV2 by Time-Resolved Electron Paramagnetic Resonance at High Magnetic Fields

Shiny Maity et al. Angew Chem Int Ed Engl. .

Abstract

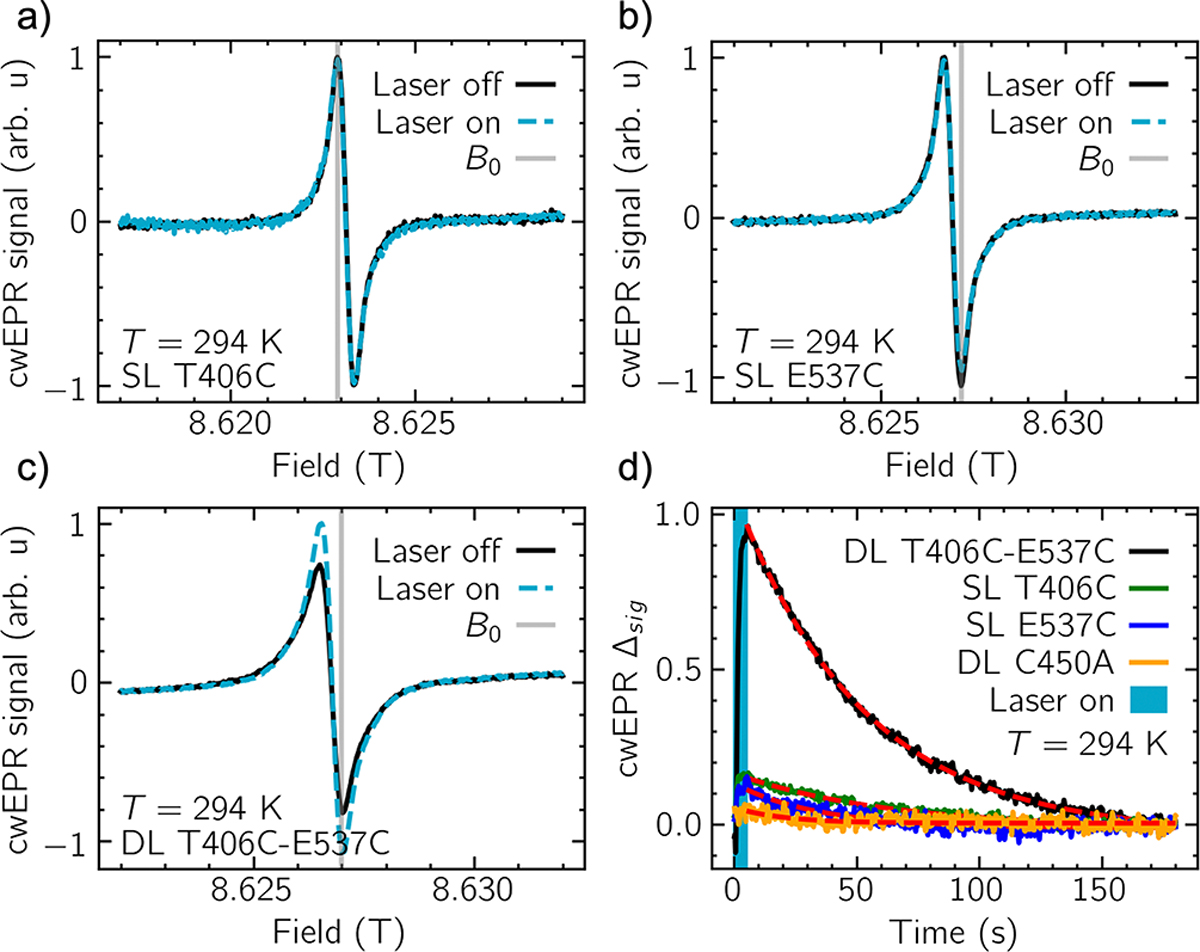
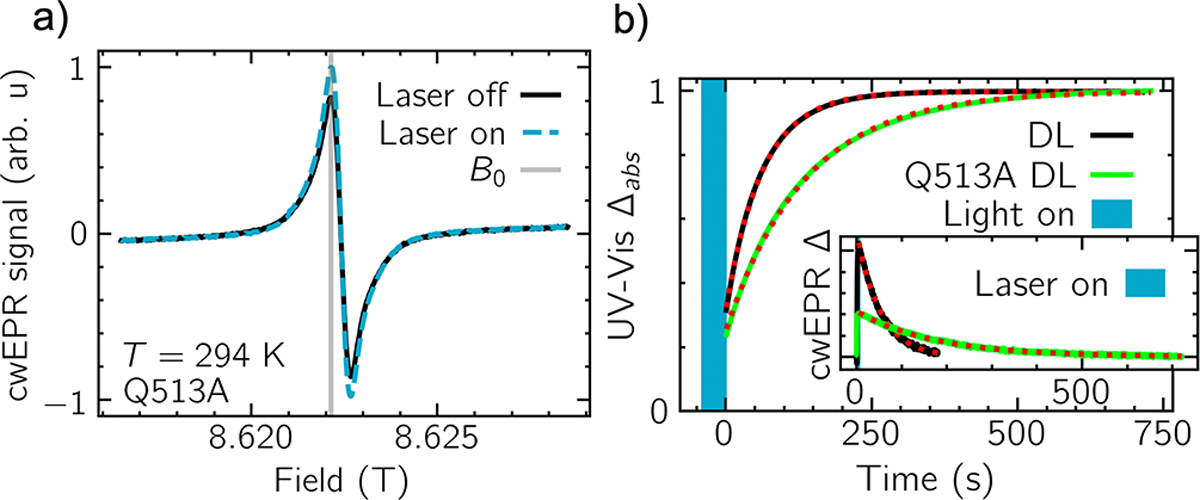
We present time-resolved Gd-Gd electron paramagnetic resonance (TiGGER) at 240 GHz for tracking inter-residue distances during a protein's mechanical cycle in the solution state. TiGGER makes use of Gd-sTPATCN spin labels, whose favorable qualities include a spin-7/2 EPR-active center, short linker, narrow intrinsic linewidth, and virtually no anisotropy at high fields (8.6 T) when compared to nitroxide spin labels. Using TiGGER, we determined that upon light activation, the C-terminus and N-terminus of AsLOV2 separate in less than 1 s and relax back to equilibrium with a time constant of approximately 60 s. TiGGER revealed that the light-activated long-range mechanical motion is slowed in the Q513A variant of AsLOV2 and is correlated to the similarly slowed relaxation of the optically excited chromophore as described in recent literature. TiGGER has the potential to valuably complement existing methods for the study of triggered functional dynamics in proteins.

Keywords: EPR Spectroscopy; Gadolinium; Protein Structures; Tigger; Time-Resolved Spectroscopy.


Figures

Figure 1:
Figure 1:
Photoresponse of AsLOV2. (a) PYMOL(v2.5.2)-generated structure demonstrating AsLOV2 structural change that occurs after 450 nm illumination (left: dark-state, PDB 2V1A; right: hypothesized lit-state).[44,45] The residues 537 and 406 that were labeled in this paper are marked green on Jα-helix (C-terminus, shown in red) and Aα-helix (N-terminus, shown in orange), respectively. (b) UV-Vis absorption spectra of AsLOV2 T406C-E537C with (dashed blue line) and without (solid black line) blue light activation (Thorlabs, Inc. LIU470A). The vertical gray line indicates the wavelength at which the lifetime of the protein was measured. (c) The lifetime of the protein (τ=65.00±0.03s) after activation with blue light was measured by recording the UV-Vis absorbance at 447 nm. (d) X-band cwEPR spectra of AsLOV2 labeled at the residues 537 and 406 with MTSL, a nitroxide-based standard EPR spin label. (e) Transient X-band EPR demonstrating similar signals from doubly and singly MTSL-labeled AsLOV2. Time constants for the fits (dashed red lines) were τT406C=70.1±1.3s,τE537C=80.5±0.6s,τT406C-E537C=66.2±0.8s. Transient data and their fits showed no significant change in amplitude after light activation between singly (SL) and doubly labeled (DL) samples. Field values used for time-dependent measurements were done at the position of maximum change near 3475 G, within ±1 G.
Figure 2:
Figure 2:
Site-directed spin labeling of AsLOV2 with Gd-sTPATCN. (a) Enrichment of DL AsLOV2. The reaction products from the spin-labeling are mixed with biotin maleimide. Singly labeled AsLOV2 with free cysteine is trapped in the column with streptavidin agarose and the fully labeled DL T406C-E537C gets through the column. (b) Comparison of 240 GHz cwEPR lineshapes of AsLOV2 singly and doubly labeled with Gd-sTPATCN. Lineshapes are normalized to highlight dipolar broadening. The experiment was done at 87 K to eliminate effects of motional averaging. Dotted blue line, solid black line, and dashed red line correspond to AsLOV2 samples labeled at residues 406–537, 537, and 406, respectively.
Figure 3:
Figure 3:
Effect of laser illumination on cwEPR spectra of Gd-labeled AsLOV2. SL cwEPR spectra of AsLOV2 residues 406 (a) and 537 (b) demonstrating that the spectrum with the laser off is unchanged when the laser is turned on. (c) DL (sites 406–537) cwEPR spectra of AsLOV2 demonstrating that the spectrum with the laser off is narrowed when the laser is turned on. Laser off spectra are shown in solid black and laser on spectra are shown in dashed blue. B0, where maximum time-dependent change occurred, is shown on all three plots by a vertical gray line. Note that B0 is not the same for all three samples; the field value with maximum change was chosen for each time-dependent experiment. (d) cwEPR time-dependent signal change of SL and DL Gd-AsLOV2 due to laser illumination at T=294K, shown by solid blue line (solid black, green, blue, and orange lines correspond to DL T406C-E537C, SL T406C, SL E537C, and DL T406C-E537C C450A, respectively). Overlaid best fits (dashed red lines) of the exponentials provide time constants of τT406C-E537C=51.9±0.3s,τT406C=62.5±1.8s,τE537C=34.6±1.9s, and τT406C-E537CC450A=20.8±3.4s. All plots are normalized to the magnitude of DL T406C-E537C signal change. See S.I. 2.4 for discussion of hypothesized cause of nonzero SL change.
Figure 4:
Figure 4:
The Q513A mutation slows the light-activated chromophore and mechanical photocycle kinetics as detected by TiGGER. (a) cwEPR spectra of Q513A DL T406C-E537C AsLOV2 showing light-activated change between dark (solid black line) and lit (dashed blue line) states. (b) Time-resolved UV-Vis (1 cm cuvette) demonstrates a slowing of the chromophore photocycle in AsLOV2 after illumination (vertical blue line). Black and green solid lines represent T406C-E537C at λ447 and Q513A DL T406C-E537C at λ442 (both ~30 μM), respectively (see S.I. 1.6 for discussion on monitoring slightly different wavelengths). Best fits are shown by dashed red lines with respective time constants of τDL=61.91±0.07 s and τQ513ADL=135.4±0.3s.Δabs are presented as fractions of the peak signal to report on the relative change induced. See S.I. Fig. 9 for non-normalized data and discussion. (Inset) TiGGER at B0 with and without Q513A mutation demonstrating that Q513A slows mechanical refolding. Best fits give τDL=51.9±0.3s and τQ513ADL=174.5±0.5s. Relative amplitudes are preserved after normalization.

References

    1. Protein Data Bank, https://www.rcsb.org/ (visited on 06/15/2022).
    1. Taraska JW, Curr. Opin. Struct. Biol., Engineering and design / Membranes; 2012, 22, 507–513. - PMC - PubMed
    1. Dietler J, Gelfert R, Kaiser J, Borin V, Renzl C, Pilsl S, Ranzani AT, García de Fuentes A, Gleichmann T, Diensthuber RP, Weyand M, Mayer G, Schapiro I, Möglich A, Nat. Commun. 2022, 13, 2618. - PMC - PubMed
    1. Bock LV, Grubmüller H, Nat. Commun. 2022, 13, 1709. - PMC - PubMed
    1. Hu K-N, Yau W-M, Tycko R, J. Am. Chem. Soc. 2010, 132, 24–25. - PMC - PubMed

Publication types

LinkOut - more resources