. 2023 Feb 14;18(2):585-596.
doi: 10.1016/j.stemcr.2022.12.012. Epub 2023 Jan 12.

Generation of anti-GD2 CAR macrophages from human pluripotent stem cells for cancer immunotherapies

Affiliations

Generation of anti-GD2 CAR macrophages from human pluripotent stem cells for cancer immunotherapies

Jue Zhang et al. Stem Cell Reports. .

Abstract

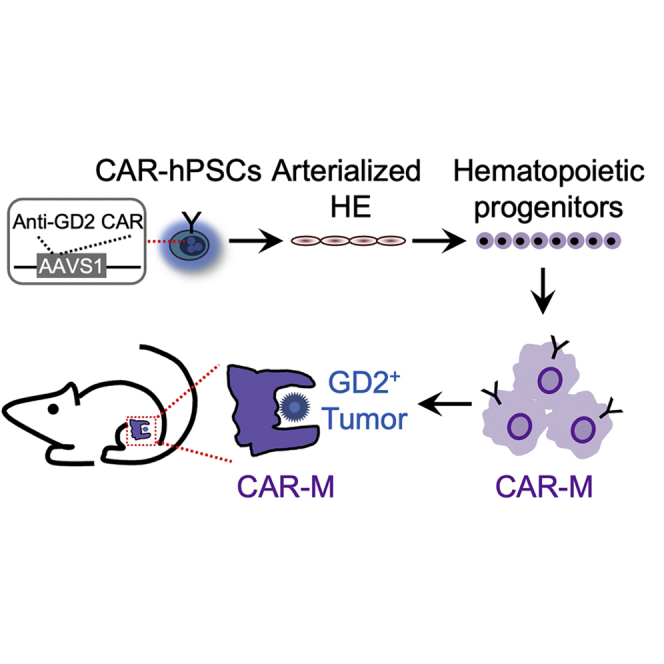
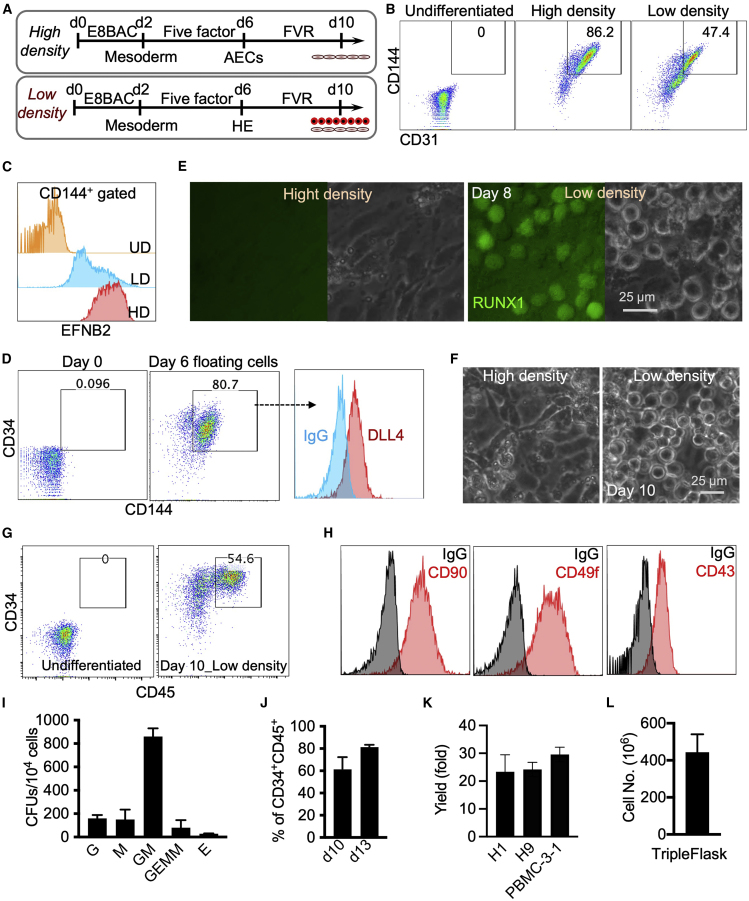
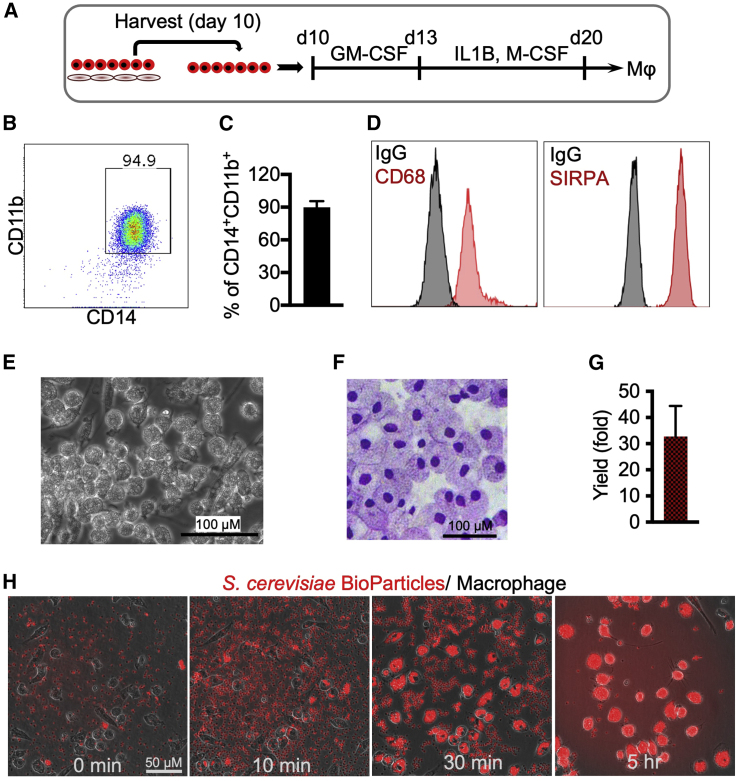
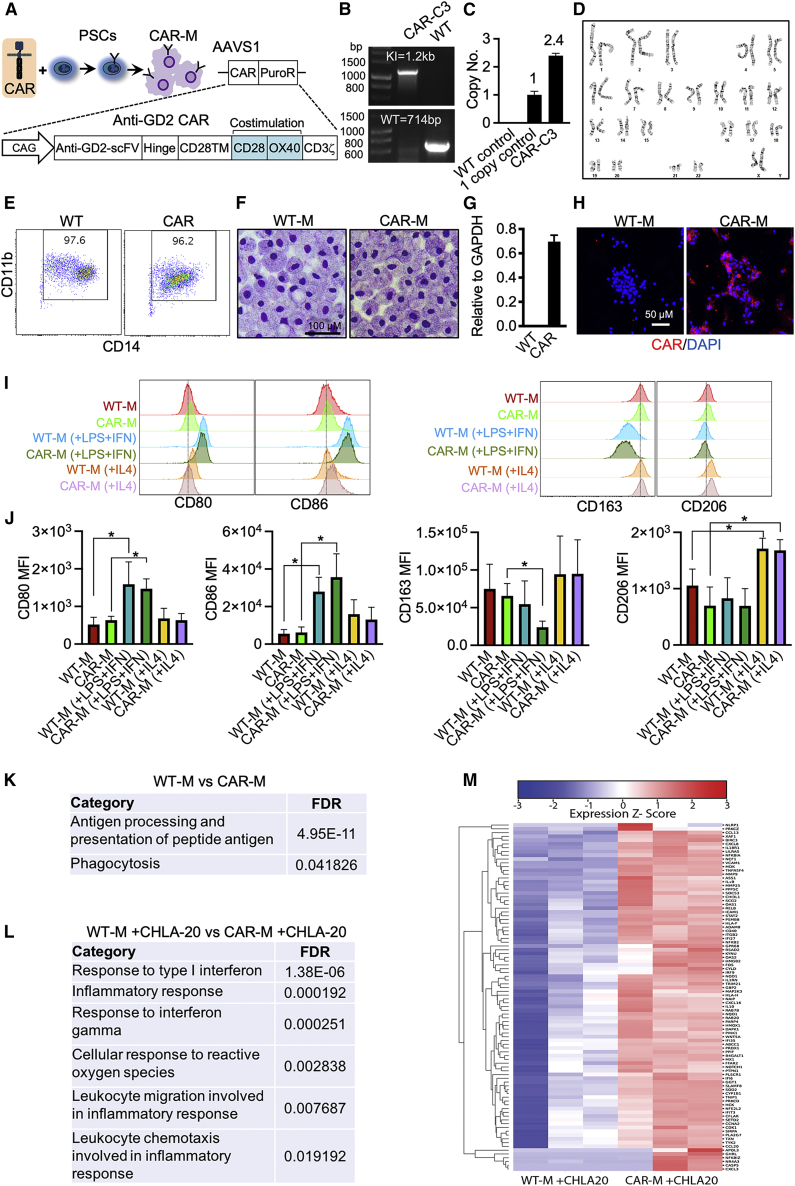
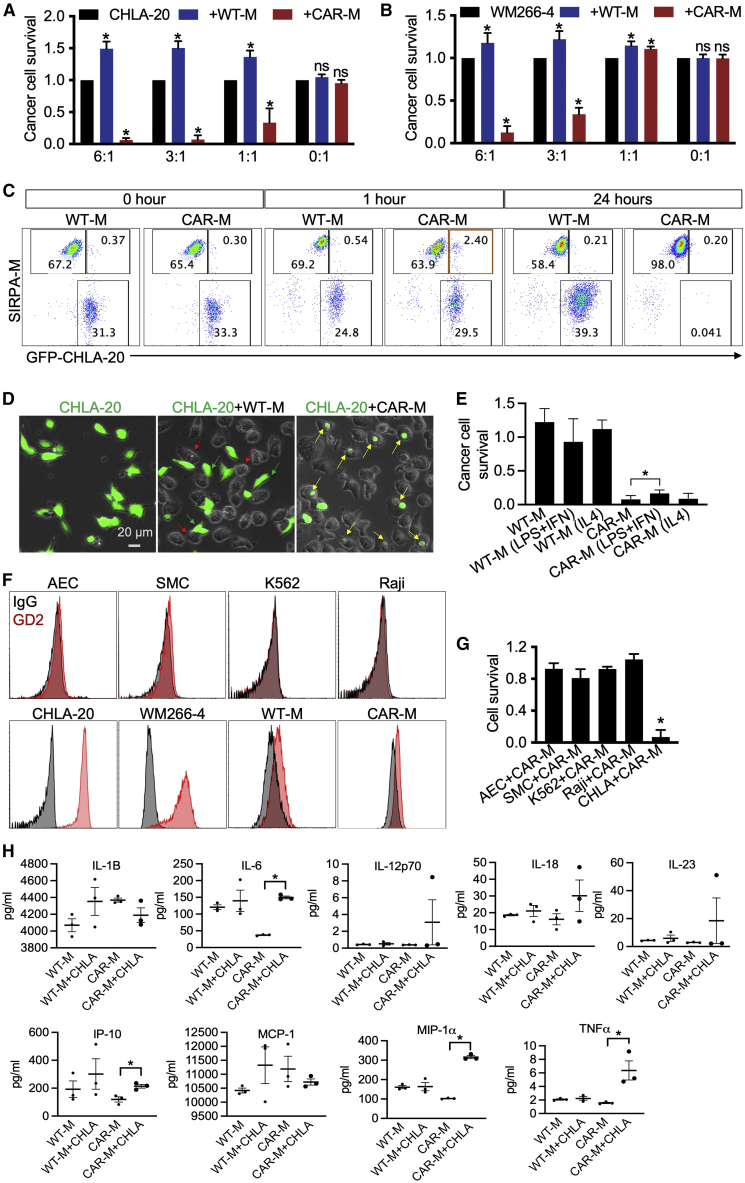
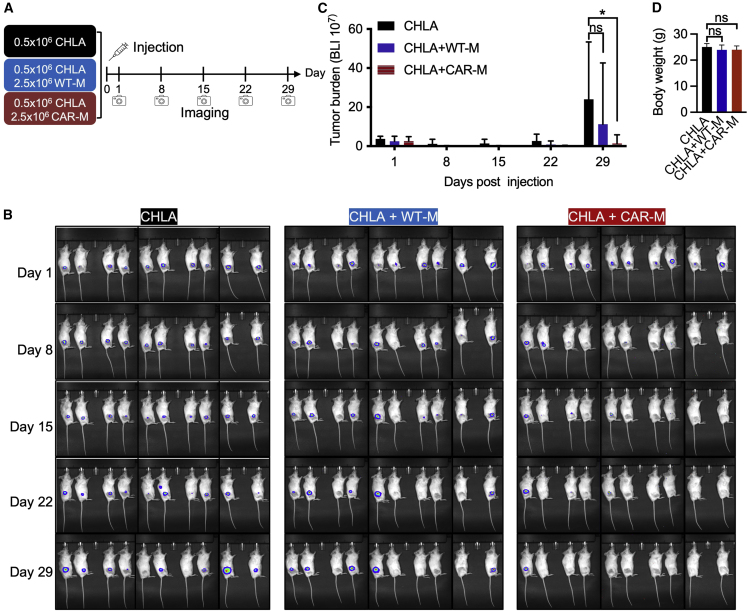
Macrophages armed with chimeric antigen receptors (CARs) provide a potent new option for treating solid tumors. However, genetic engineering and scalable production of somatic macrophages remains significant challenges. Here, we used CRISPR-Cas9 gene editing methods to integrate an anti-GD2 CAR into the AAVS1 locus of human pluripotent stem cells (hPSCs). We then established a serum- and feeder-free differentiation protocol for generating CAR macrophages (CAR-Ms) through arterial endothelial-to-hematopoietic transition (EHT). CAR-M produced by this method displayed a potent cytotoxic activity against GD2-expressing neuroblastoma and melanoma in vitro and neuroblastoma in vivo. This study provides a new platform for the efficient generation of off-the-shelf CAR-Ms for antitumor immunotherapy.

Keywords: CAR; GD2; PSCs; chimeric antigen receptor; hemogenic endothelium; immunotherapy; macrophages; melanoma; neuroblastoma; pluripotent stem cells.


Conflict of interest statement

Conflict of interests C.M.C. receives honorarium for advisory board membership for Elephas Bio, Nektar Therapeutics, and Novartis. I.I.S serves on scientific advisory board for Umoja Biopharma. WARF has filed patent applications on the basis of this work, on which J.Z., A.M.., J.A.T., and I.I.S. are listed as inventors.

Figures

None
Graphical abstract
Figure 1
Figure 1
Low-density arterial endothelium differentiation cultures allow for the generation of blood cells H9 cells are used unless specified. (A) Schematic of arterial endothelial cell and hematopoietic cell differentiation. High cell density, 1.1 × 105 cells/cm2. Low cell density, 1.8 × 104 cells/cm2. FVR media contains FGF2, VEGFA, and RESV. (B) Representative flow cytometry dot plots show expression of CD31 and CD144 at day 6 of differentiation in low- and high-density conditions. Undifferentiated cells (day 0) are used as a negative control. (C) CD144+ cells in low density (LD) and high density (HD) were gated for analysis of EFNB2 expression. Undifferentiated cells (UDs) are used as a negative control. The EFNB2-tdTomato/EPHB4-EGFP H1 reporter cell line was used. (D) Representative flow cytometry analysis of CD144, CD34, and DLL4 expression of floating cells collected at day 6 of differentiation. (E) RUNX1+23 enhancer activity in LD and HD cultures at day 8 of differentiation. The RUNX1+23 enhancer-Venus reporter cell line was used. (F) Phase contrast images of arterial endothelium cultures at day 10 of differentiation. (G) Representative flow cytometry analysis of CD34 and CD45 expression at day 10 of differentiation. (H) Representative flow cytometry analysis of CD90, CD49f, and CD43 expression of floating cells collected at day 10 of differentiation. (I) Colony-forming unit assay of day 8 cells in low cell density condition. Data are represented as mean ± SD; n = 3 independent experiments. (J) Percentages of CD34+CD45+ cells at days 10 and 13 of differentiation. Data are represented as mean ± SD. Student’s t test; p < 0.05; n = 3 independent experiments. (K) Hematopoietic cells generated from one starting hPSC. H1 and H9 embryonic stem cells and PBMC-3-1 hiPSCs were used. Data are represented as mean ± SD; n = 3 independent experiments. (L) Total floating hematopoietic cell number generated from one T500 TrypleFlask. Data are represented as mean ± SD; n = 3 independent experiments.
Figure 2
Figure 2
Generation and functional assessment of macrophages generated from H9 hPSCs (A) Schematic of macrophage differentiation. Hematopoietic cells on day 10 of differentiation are collected and cultured in serum-free media containing GM-CSF for 3 days and then with IL-1β and M-CSF for another 7 days. (B) Representative dot plot shows flow cytometry analysis of CD14 and CD11b expression at day 20 of differentiation. (C) Percentages of CD14+CD11b+ macrophages are presented as mean ± SD, n = 3 independent experiments. (D) Representative histograms show flow cytometry analysis of CD68 and SIRPA/CD172A expression at day 20 of differentiation. (E) Cell morphology at day 20 of differentiation. (F) Wright-Giemsa staining of cytospins from day 20 differentiation. (G) Total yield of macrophages from one starting hPSC. Data are represented as mean ± SD, n = 3 independent experiments. (H) Phagocytosis of yeast particles by macrophages. Zymosan An S. cerevisiae BioParticles (Texas Red conjugate; Life Technologies) were prepared in phosphate-buffered saline (PBS; 10 mg/mL = 2 × 109 particle/mL). 20 μL particles were added to 2 mL media containing 4 × 105 macrophage. Phagocytosis was imaged over time.
Figure 3
Figure 3
Engineering anti-GD2 CAR hPSCs and functional analysis of anti-GD2 CAR-Ms (H9 derived) (A) Schematic of CAR constructs and CAR-engineered cells. CAG, CMV enhancer/chicken β action promoter; scFv, single chain fragment variable; TM, transmembrane. (B) Junctional PCR analysis AAVS1-CAR knockin (KI) allele and WT AAVS1 allele to demonstrate a correct CAR integration. WT cells (without gene editing) are used as a control. (C) qPCR analysis of AAVS1-GD2-CAR-PuroR copy number. Data are represented as mean ± SD. n = 2 independent experiments. (D) Karyotyping of CAR-C3 hPSC line. (E) Flow cytometry analysis of CD14 and CD11b expression of macrophages. (F) Wright-Giemsa staining of WT-M and CAR-M cytospins. (G) qRT-PCR analysis of CAR expression in macrophages. n = 3 independent experiments. (H) Demonstration of anti-GD2 CAR expression in macrophages using immunofluorescence staining with antibody against GD2 antibody 14G2a. (I) Representative flow cytometry plots show expression of M1/M2 markers in WT-Ms and CAR-Ms with or without treatment. (J) Statistics of M1/M2 markers. MFI, mean fluorescent intensity. Data are presented as mean ± SD. Student’s t test; p < 0.05; n = 4 independent experiments. CAR-Ms are generated from 2 different clones. (K) M1-related GO terms enriched in CAR-Ms. (L) M1-related GO terms enriched in CAR-Ms co-cultured with CHLA-20 cells. (M) Heatmap shows M1-related genes in macrophages co-cultured with CHLA-20.
Figure 4
Figure 4
Evaluation of antitumor activity of CAR-Ms (H9 derived) in vitro (A) Killing of CHLA-20 neuroblastoma cells by CAR-Ms. CHLA-20-AkaLuc-GFP cells were mono-cultured or co-cultured with macrophages at different E:T ratios for 20–24 h. Statistics of CHLA-20 cell survival results are represented as mean ± SD. Student’s t test; p < 0.05; ns, not significant; n > 4 independent experiments. (B) Killing of WM266-4 melanoma cells by CAR-Ms. WM266-4-AkaLuc-GFP melanoma cells were mono-cultured or co-cultured with macrophages at different E:T ratios for 20–24 h. Statistics of WM266-4 cell survival. Results are mean ± SD. Student’s t test; p < 0.05; ns, not significant; n > 4 independent experiments. (C) Representative flow cytometry plots show CHLA-20 cells co-cultured with WT-Ms and CAR-Ms. CHLA-20 cells are labeled by GFP. WT-Ms and CAR-Ms are labeled by SIRPA immunostaining. (D) Representative images show phagocytosis of CHLA-20 cells by CAR-Ms. CHLA-20-AkaLuc-GFP cells were co-cultured with macrophages for 6 h (E:T = 3:1). Green arrows indicate CHLA-20 cells, red arrows indicate WT-Ms, and yellow arrows indicate phagocytosis of CAR-Ms. (E) Killing of CHLA-20 neuroblastoma cells by CAR-Ms with or without treatment. CHLA-20-AkaLuc-GFP cells were mono-cultured or co-cultured with macrophages at E:T ratio = 3:1 for 20–24 h. Statistics of CHLA-20 cell survival results are represented as mean ± SD. Student’s t test; p < 0.05; n = 3 independent experiments. (F) Representative histograms show flow cytometry analysis of GD2 expression in different cells. AEC is aretrial endothelial cells, SMC is smooth muscle cells. (G) CAR-Ms were co-cultured with AEC-NOS3-NanoLuc-2A-tdTomato, SMC-MYH11-NanoLuc-2A-tdTomato, K562-AkaLuc-GFP, Raji-AkaLuc-GFP, and CHLA-20 cells (E:T = 3:1) for 20 h. Target cell survival was measured by luciferase assay. Results are represented as mean ± SD. Student’s t test; p < 0.05; n = 3 independent experiments. (H) Secretome analysis of macrophages. WT-Ms and CAR-Ms were mono-cultured or co-cultured with CHLA-20 for 20 h. Cell culture media were collected for secretome analysis. Results are mean ± SD. Student’s t test; p < 0.05; n = 3 independent experiments.
Figure 5
Figure 5
CAR-Ms (H9 derived) significantly reduce tumor burden in a CHLA-20 xenograft mouse model (A) Schematic of mouse model experiments. CHLA-20-AkaLuc-GFP cells were injected subcutaneously alone or with WT-Ms or CAR-Ms. Luminescent signals were measured at 1, 8, 15, 22, and 29 days post injection. 10 mice per group. (B) Tumor burden was assessed by bioluminescent imaging at indicated time points. (C) Quantification of tumor burden as shown by luminescent signals. Results are represented as mean ± SD. Student’s t test; p < 0.05; ns, not significant; n = 10 mice. (D) Body weight represented as mean ± SD. Student’s t test; ns, not significant; n = 10 mice.

References

    1. Ahmed N., Brawley V., Hegde M., Bielamowicz K., Kalra M., Landi D., Robertson C., Gray T.L., Diouf O., Wakefield A., et al. HER2-Specific chimeric antigen receptor-modified virus-specific T cells for progressive glioblastoma: a phase 1 dose-escalation trial. JAMA Oncol. 2017;3:1094–1101. doi: 10.1001/jamaoncol.2017.0184. - DOI - PMC - PubMed
    1. Ahmed N., Brawley V.S., Hegde M., Robertson C., Ghazi A., Gerken C., Liu E., Dakhova O., Ashoori A., Corder A., et al. Human epidermal growth factor receptor 2 (HER2) -specific chimeric antigen receptor-modified T cells for the immunotherapy of HER2-positive sarcoma. J. Clin. Oncol. 2015;33:1688–1696. doi: 10.1200/JCO.2014.58.0225. - DOI - PMC - PubMed
    1. Alcantara M., Tesio M., June C.H., Houot R. CAR T-cells for T-cell malignancies: challenges in distinguishing between therapeutic, normal, and neoplastic T-cells. Leukemia. 2018;32:2307–2315. doi: 10.1038/s41375-018-0285-8. - DOI - PMC - PubMed
    1. Boeva V., Louis-Brennetot C., Peltier A., Durand S., Pierre-Eugène C., Raynal V., Etchevers H.C., Thomas S., Lermine A., Daudigeos-Dubus E., et al. Heterogeneity of neuroblastoma cell identity defined by transcriptional circuitries. Nat. Genet. 2017;49:1408–1413. doi: 10.1038/ng.3921. - DOI - PubMed
    1. Brown C.E., Alizadeh D., Starr R., Weng L., Wagner J.R., Naranjo A., Ostberg J.R., Blanchard M.S., Kilpatrick J., Simpson J., et al. Regression of glioblastoma after chimeric antigen receptor T-cell therapy. N. Engl. J. Med. 2016;375:2561–2569. doi: 10.1056/NEJMoa1610497. - DOI - PMC - PubMed

Publication types

MeSH terms

Substances