. 2023 Jan 19;186(2):305-326.e27.
doi: 10.1016/j.cell.2022.12.027. Epub 2023 Jan 12.

Loss of epigenetic information as a cause of mammalian aging

Affiliations

Loss of epigenetic information as a cause of mammalian aging

Jae-Hyun Yang et al. Cell. .

Erratum in

  • Loss of epigenetic information as a cause of mammalian aging.
    Yang JH, Hayano M, Griffin PT, Amorim JA, Bonkowski MS, Apostolides JK, Salfati EL, Blanchette M, Munding EM, Bhakta M, Chew YC, Guo W, Yang X, Maybury-Lewis S, Tian X, Ross JM, Coppotelli G, Meer MV, Rogers-Hammond R, Vera DL, Lu YR, Pippin JW, Creswell ML, Dou Z, Xu C, Mitchell SJ, Das A, O'Connell BL, Thakur S, Kane AE, Su Q, Mohri Y, Nishimura EK, Schaevitz L, Garg N, Balta AM, Rego MA, Gregory-Ksander M, Jakobs TC, Zhong L, Wakimoto H, El Andari J, Grimm D, Mostoslavsky R, Wagers AJ, Tsubota K, Bonasera SJ, Palmeira CM, Seidman JG, Seidman CE, Wolf NS, Kreiling JA, Sedivy JM, Murphy GF, Green RE, Garcia BA, Berger SL, Oberdoerffer P, Shankland SJ, Gladyshev VN, Ksander BR, Pfenning AR, Rajman LA, Sinclair DA. Yang JH, et al. Cell. 2024 Feb 29;187(5):1312-1313. doi: 10.1016/j.cell.2024.01.049. Cell. 2024. PMID: 38428398 No abstract available.

Abstract

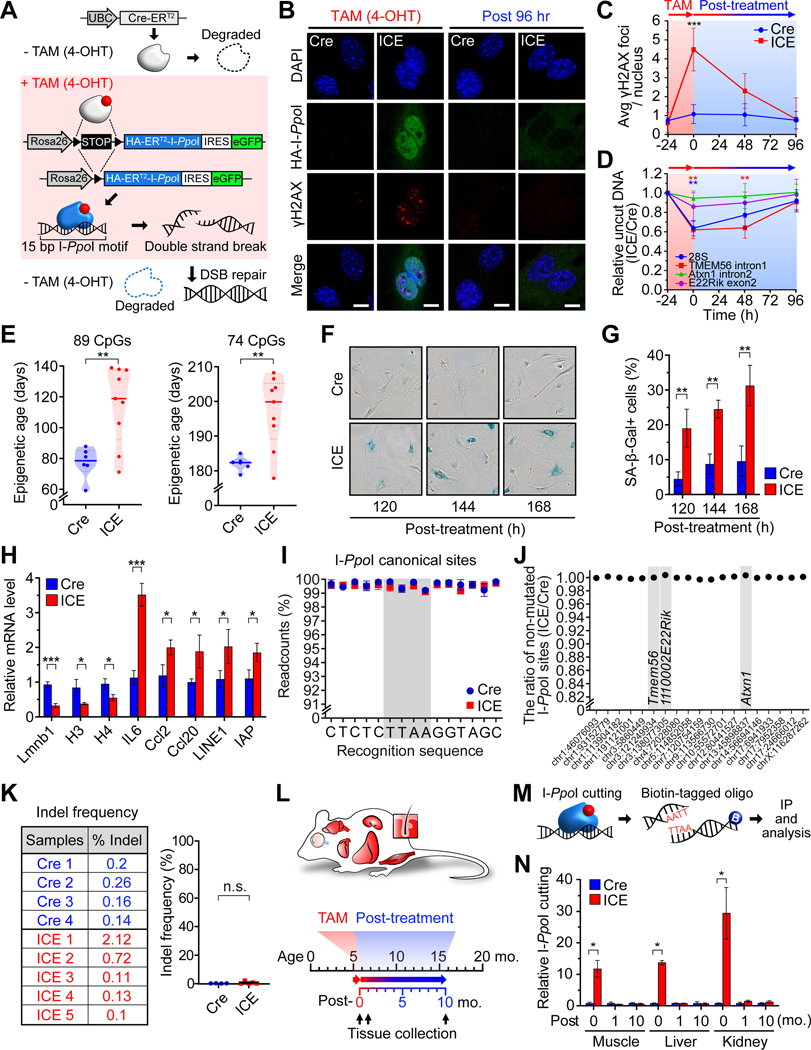
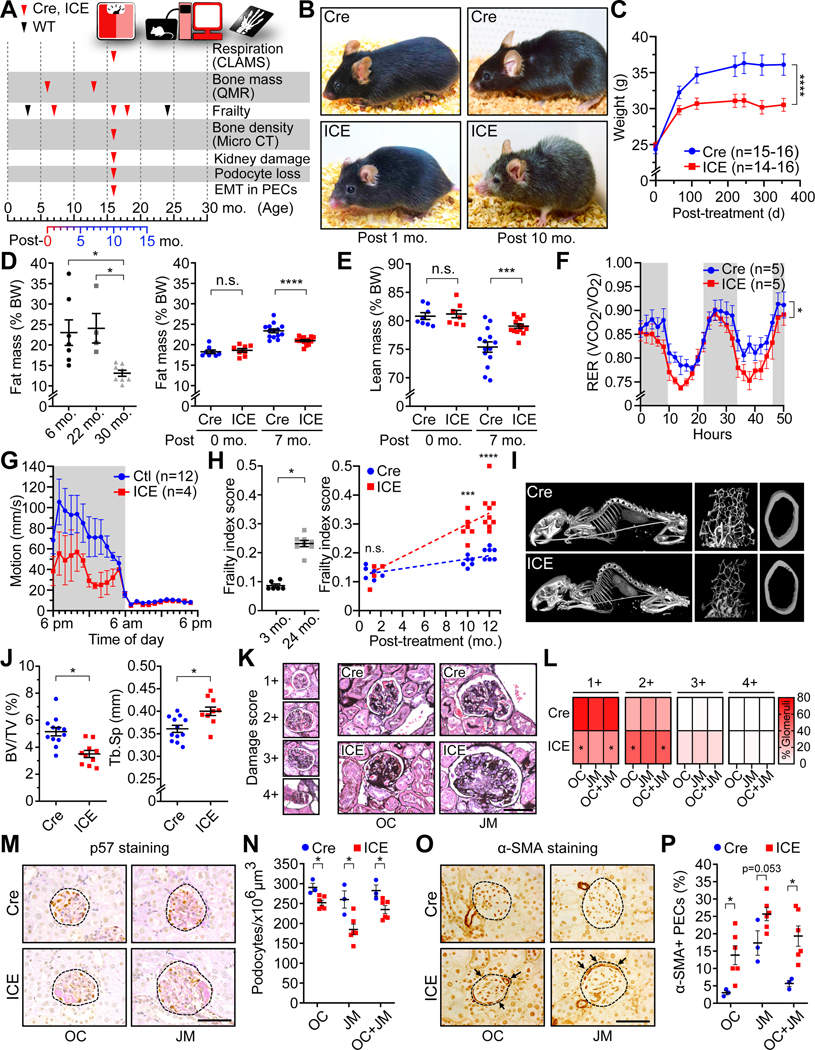
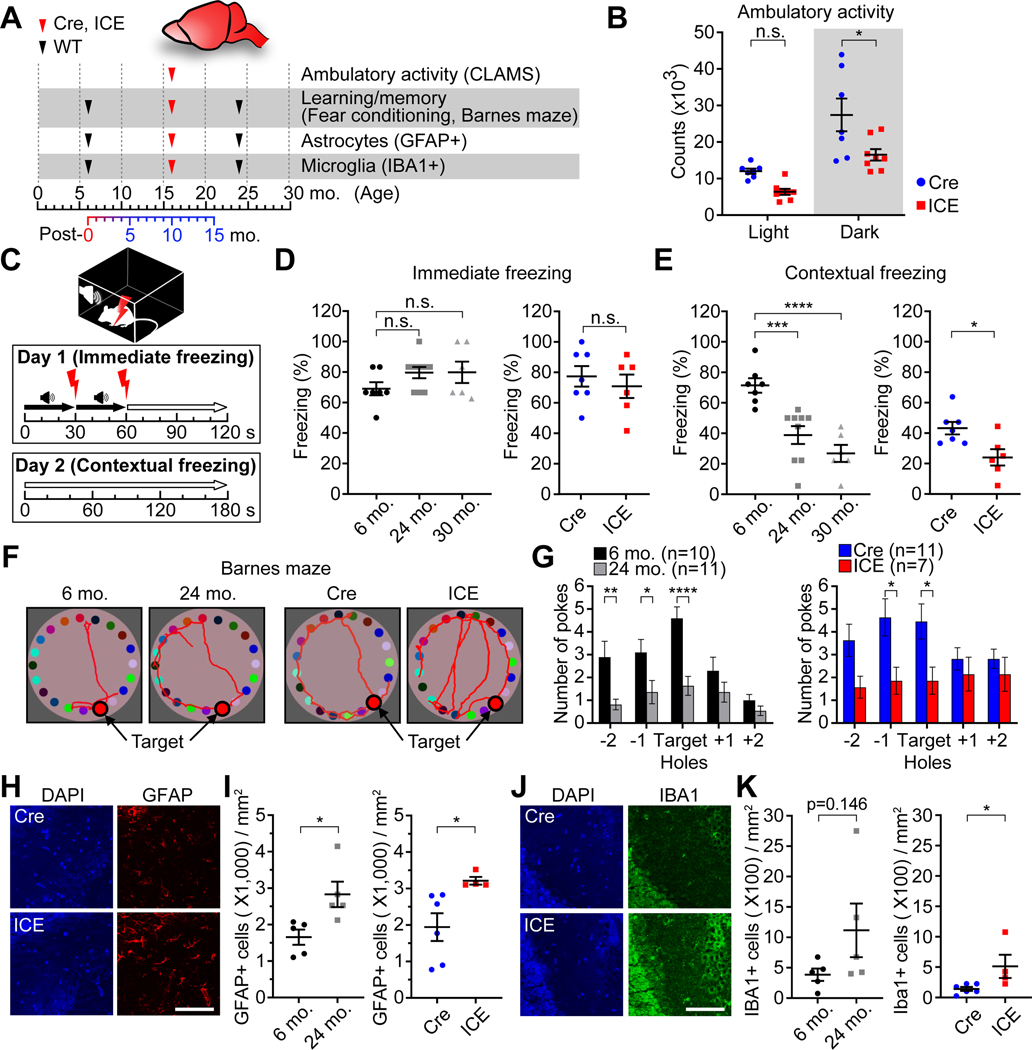
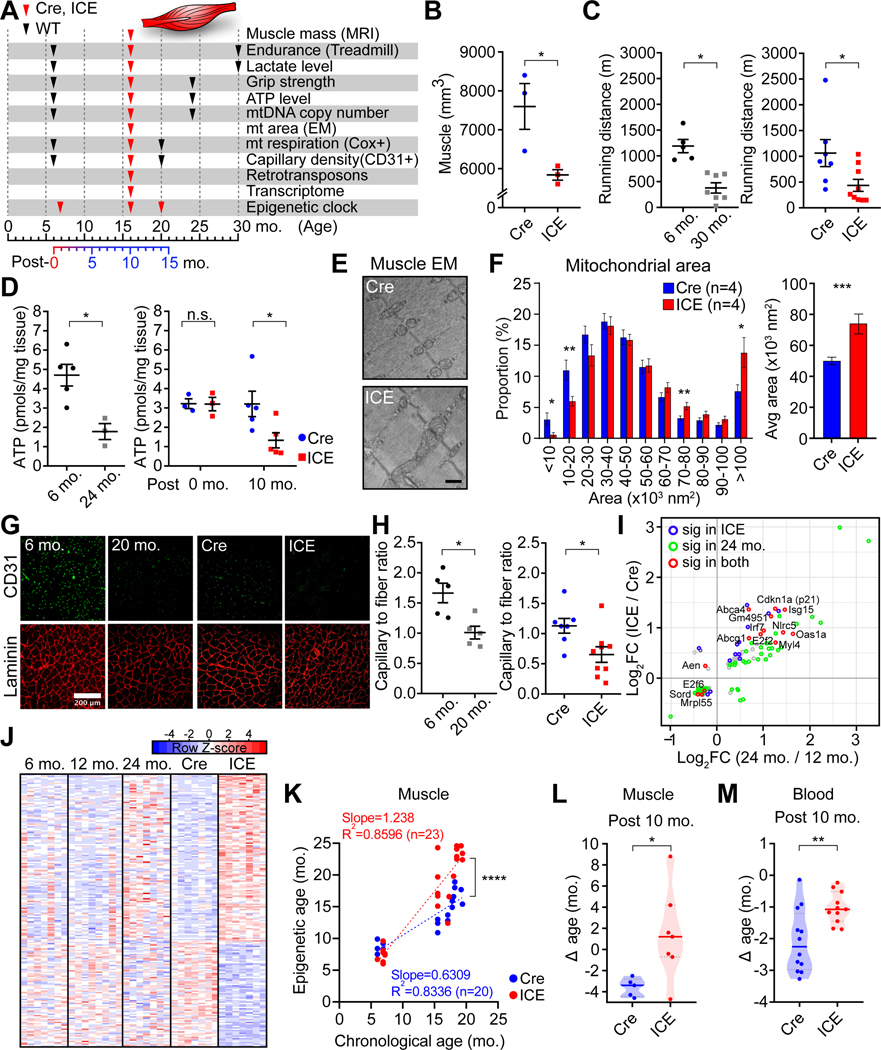
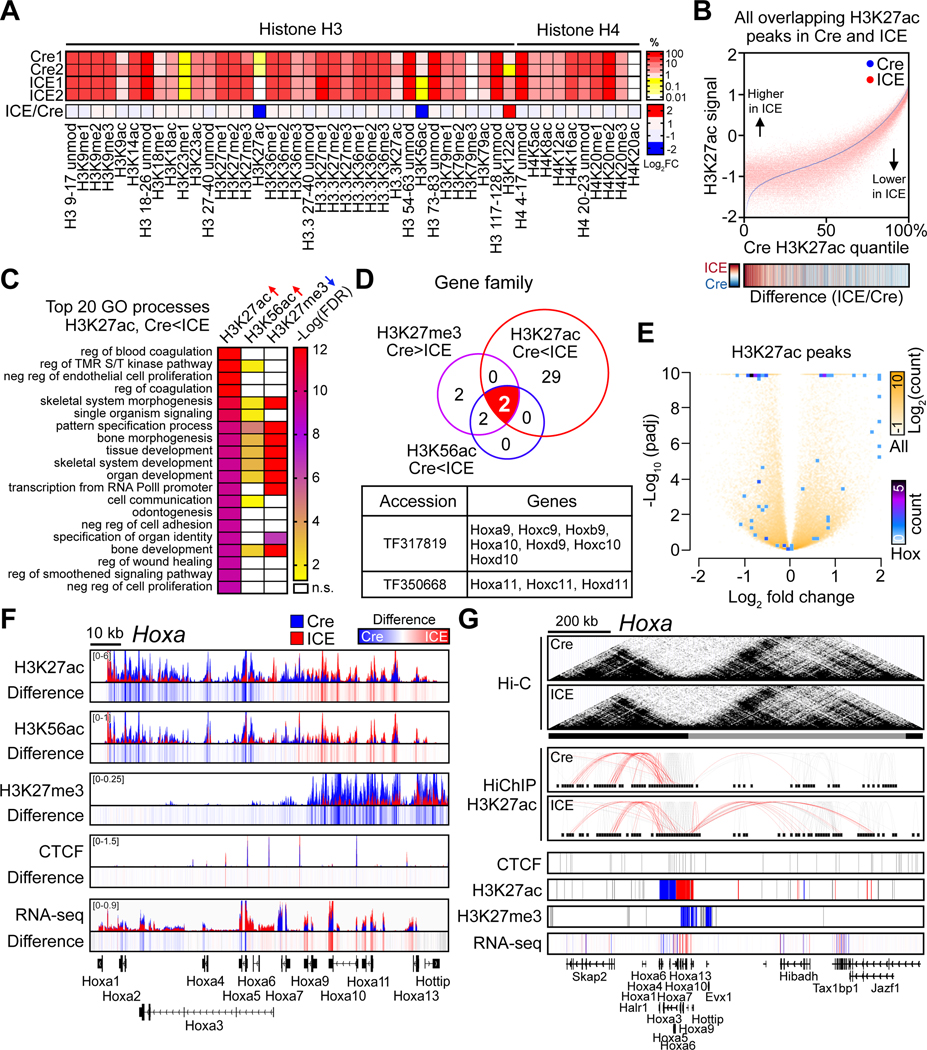
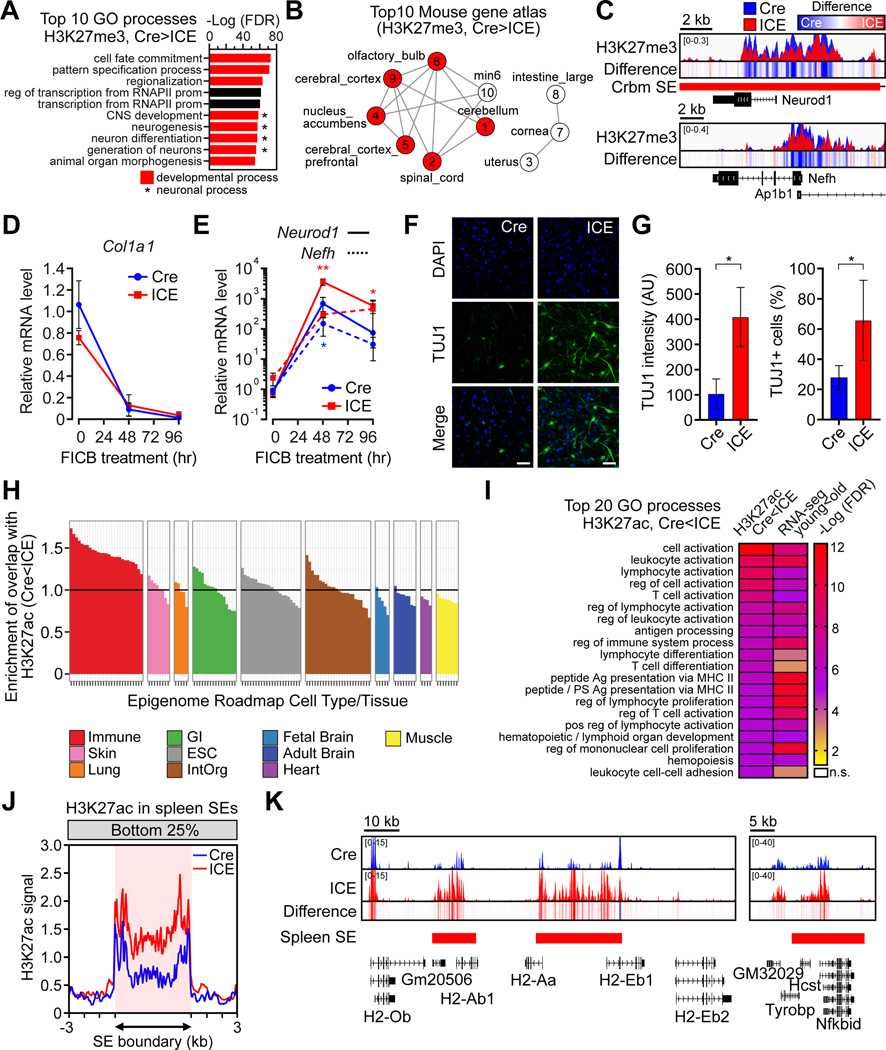
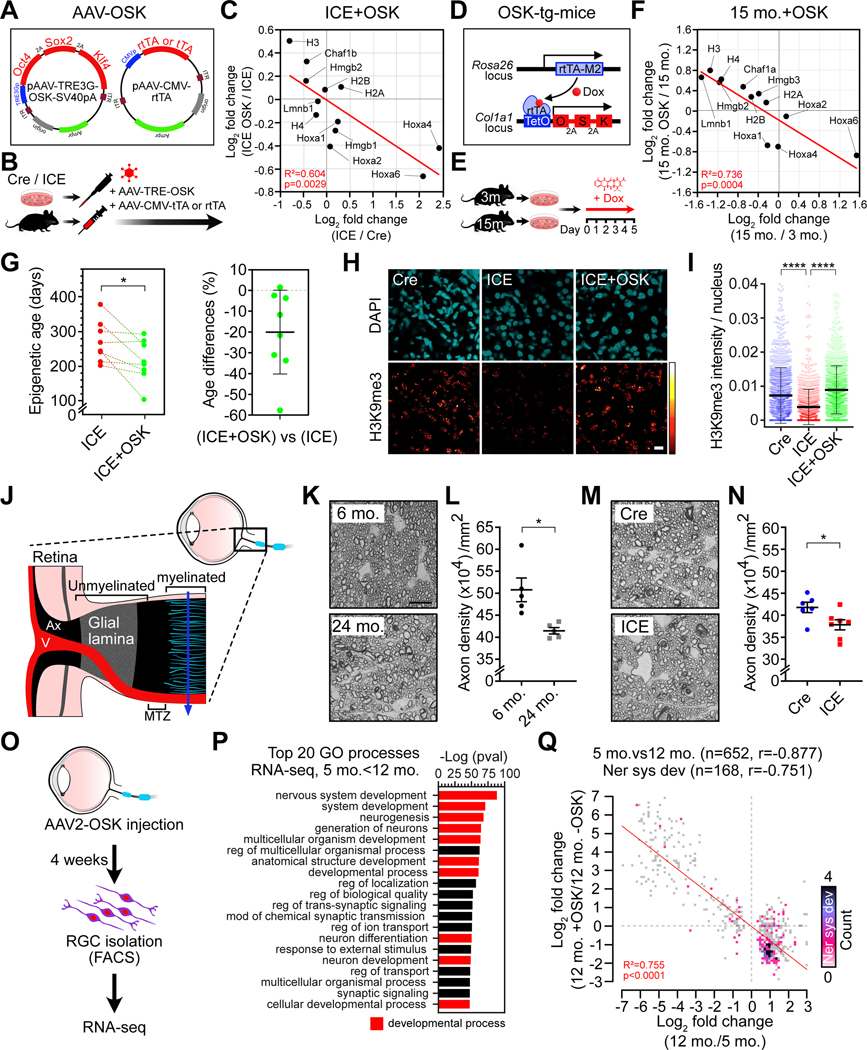
All living things experience an increase in entropy, manifested as a loss of genetic and epigenetic information. In yeast, epigenetic information is lost over time due to the relocalization of chromatin-modifying proteins to DNA breaks, causing cells to lose their identity, a hallmark of yeast aging. Using a system called "ICE" (inducible changes to the epigenome), we find that the act of faithful DNA repair advances aging at physiological, cognitive, and molecular levels, including erosion of the epigenetic landscape, cellular exdifferentiation, senescence, and advancement of the DNA methylation clock, which can be reversed by OSK-mediated rejuvenation. These data are consistent with the information theory of aging, which states that a loss of epigenetic information is a reversible cause of aging.

Keywords: DNA damage; RCM; aging; chromatin; epigenetic clock; epigenetic reprogramming; relocalization of chromatin modifier; senescence.


Conflict of interest statement

Declaration of interests D.A.S. is a consultant, inventor, board member, and in some cases an investor in Life Biosciences (developing reprogramming medicines), InsideTracker, Zymo, EdenRoc Sciences/Cantata/Dovetail/Metrobiotech, Caudalie, Galilei, Immetas, Animal Biosciences, Tally Health, and more. See https://sinclair.hms.harvard.edu/david-sinclairs-affiliations. E.M.M., M. Blanchette, and M. Bhakta are employees of Catata Bio/Dovetail. Y.C.C., W.G., and X.Y. are employees of Zymo Research. A.J.W. advises Kate Therapeutics and Frequency Therapeutics and is a co-founder, adviser, and equity holder of Elevian, which sponsors Wagers Lab research. L.S. was an employee of Vium. Y.R.L. and L.A.R. are equity owners of Life Biosciences. M.S.B. and D.L.V. advise EdenRoc Sciences. A patent application was filed on the reprogramming methods.

Figures

Figure 1.
Figure 1.. The Inducible Changes to the Epigenome (ICE) system
(A) The ICE system with a TAM-inducible I-PpoI endonuclease. (B and C) γH2AX foci in DAPI-stained nuclei of MEFs after TAM (4-OHT, 0.5 μM) treatment. Scale, 10 μm. Two-way ANOVA-Bonferroni. (D) qPCR analysis of cutting at I-PpoI canonical sites. One-way ANOVA-Bonferroni. (E) Epigenetic age of 96-hour post-treated ICE cells. All clock DNAme sites (left) and clock DNAme sites post-batch effect correction (right). Two-tailed Student’s t test. (F and G) Senescence-associated β-galactosidase (SA-β-Gal) staining of post-treated cells. Two-tailed Student’s t test. (H) mRNA levels of genes known to change during senescence 144 hours post-treatment. Two-tailed Student’s t test. (I and J) Non-mutated I-PpoI canonical sequences in 96-hour post-treated cells assessed by deep sequencing (>50x). (K) Mutation frequency of 28S rDNA in 96-hour post-treated cells. Two-tailed Student’s t test. (L) Experimental design. (M and N) Immunoprecipitation and quantification of a I-PpoI cut site (Tmem56) in skeletal muscle, liver and kidney during and after TAM treatment (0-,1- and 10-month post-treatment). Two-tailed Student’s t test. Data are mean (n≥3) ± SD or ± SEM (N). n.s.: p > 0.05; *p < 0.05; **p < 0.01; ***p< 0.001.
Figure 2.
Figure 2.. ICE mice phenocopy normal aging
(A) Experimental design. (B) Images of Cre and ICE mice. (C-E) Weight and body mass. Two-way ANOVA-Bonferroni (C). One-way ANOVA-Bonferroni (D, left). Two-way ANOVA-Bonferroni (D right and E). (F) Respiratory Exchange Rate (RER) of 10-month post-treated mice. Repeated measures two-way ANOVA-Bonferroni. (G) Average motion over 24 hours. (H) Frailty indices of Cre, ICE, WT 3- and 24-month-old mice. Two-tailed Student’s t test (left) or two-way ANOVA-Bonferroni (right). (I and J) CT of whole skeleton and micro-CT of trabecular and cortical bones. Kyphosis assessment (I), bone/tissue volume (J, left) and trabecular separation (J, right). Two-tailed Student’s t test. (K and L) Average damage scores (1+ normal – 4+ global scarring) of glomeruli of 10-month post-treated ICE mice. OC, outer cortex; JM, juxtamedullary glomeruli. Two- tailed Student’s t test. (M and N) p57 (podocyte) and Periodic acid-Schiff staining, and podocyte density of 10-month post-treated ICE mice. Circles with broken line indicate glomeruli. Scale bar, 50 μm. Two-tailed Student’s t test. (O and P) Fraction of α-SMA-positive cells in parietal epithelial cells (PEC) along Bowman’s capsule (arrows) of 10-month post-treated ICE mice showing an epithelial to mesenchymal transition (EMT). Circles with broken line indicate glomeruli. Scale bar, 50 μm. Two-tailed Student’s t test. Data are mean ± SEM. n.s.: p > 0.05; *p < 0.05; ***p< 0.001; ****p< 0.0001.
Figure 3.
Figure 3.. ICE mice phenocopy brain aging
(A) Experimental design. (B) Ambulatory activity of 10-month post-treated mice in light and dark cycles. Two-way ANOVA-Bonferroni. (C-E) Immediate and contextual freezing in fear conditioning tests in 10-month post-treated mice. One-way ANOVA-Bonferroni (D, left and E, left) or two-tailed Student’s t test (D, right and E, right). (F and G) Representative images of Barnes maze tests and mean number of pokes at each hole in 10-month post-treated mice. Two-way ANOVA-Bonferroni. (H-K) Immunofluorescence of the hippocampal CA3 region stained for astrocyte activation (GFAP) and microglia (IBA1) in 10-month post-treated mice. Scale bar, 100 μm. Two-tailed Student’s t test. Data are mean ± SEM. n.s.: p > 0.05; *p < 0.05; **p < 0.01; ***p< 0.001; **** p < 0.0001.
Figure 4.
Figure 4.. ICE mice phenocopy muscle aging
(A) Timeline of phenotypic assessments of mice. (B) Muscle mass of 10-month post-treated mice assessed by MRI. Two-tailed Student’s t test. (C) Treadmill endurance in WT, 10-month post-treated mice. Two-tailed Student’s t test. (D) ATP levels in 10-month post-treated muscle. Two-tailed Student’s t test (let) or two-way ANOVA-Bonferroni (right). (E and F) Mitochondrial morphology and area of 10-month post-treated muscle. Scale bar, 500 nm. Two-tailed Student’s t test. (G and H) 10-month post-treated gastrocnemius. Laminin (red) and CD31(green), marking extracellular matrix and capillaries, respectively. Two-tailed Student’s t test. (I) Scatter plot of genes changed (p < 0.01) in muscle from 10-month post-treated ICE and WT 24-month-old mice with significantly changed genes (padj < 0.05) in color. (J) Heatmaps of the top 200 most significantly altered genes in skeletal muscle. (K) Epigenetic age of gastrocnemii 1-, 10-, and 14-month post-treatment. Linear regression analysis. (L and M) Epigenetic age of muscle and blood 10-month post-treatment (Δ age = epigenetic age – chronological age). Two-tailed Student’s t test. Data are mean ± SEM. n.s.: p > 0.05; *p < 0.05; **p < 0.01; ***p< 0.001; **** p < 0.0001.
Figure 5.
Figure 5.. Erosion of the epigenetic landscape in ICE cells
(A) Quantitative mass spectrometry of histone H3 and H4 modifications in 96-hour post-treated ICE cells. %, relative abundance; unmod, unmodified; me, methylation; ac, acetylation. (B) Genome-wide changes of H3K27ac in 96-hr post-treated cells. Heatmap of ICE/Cre. (C) Gene Ontology analysis of H3K27ac-increased, H3K56ac-increased, or H3K27me3-decreased peaks ordered by top 20 processes enriched in H3K27ac-increased regions (padj < 0.01). ↑, Cre < ICE peaks, padj < 0.01; ↓, Cre > ICE peaks, padj < 0.01. (D) TreeFam analysis of gene families with overlapping regions with histone modification changes (padj < 0.01) in ICE cells. (E) Volcano plot of H3K27ac peaks. All peaks and peaks in Hox genes shown white to yellow and blue to purple, respectively. (F) ChIP-seq track of histone modifications and mRNA levels across the 120 kb Hoxa locus of post-treated ICE cells. Difference = ICE – Cre (G) Hi-C contact matrices and HiChIP contact loops in Hoxa. Red, chromatin contacts between Hoxa promoters and other regions. Lower panels, regions with ChIP-seq or RNA-seq peaks. Peak regions, red (Cre<ICE), blue (Cre>ICE) or grey (unchanged).
Figure 6.
Figure 6.. Induction of the ICE system disrupts cellular identity
(A) Gene Ontology analysis of H3K27me3 decreased regions (padj < 0.05). Red, developmental processes. *Neuronal processes. (B) Mouse tissue types of transcriptional profiles that overlap decreased H3K27me3 regions (padj < 0.05) in ICE cells. Red, neuronal tissues. Numbers indicate rank. (C) ChIP-seq track of neuronal markers, Neurod1 and Nefh. Difference = ICE – Cre. (D and E) Time-course of mRNA levels of Col1A1 (a fibroblast marker), Neurod1 and Nefh (neuronal markers) during neuronal reprogramming. Two-way ANOVA-Bonferroni. (F and G) Neuronal marker TUJ1 8 d after reprogramming. DNA stained with DAPI. Scale bar, 100 μm. Two-tailed Student’s t test. (H) Comparison of H3K27ac increased regions (p < 0.01) to epigenome roadmap data from different human tissue types. (I) Gene Ontology comparison of H3K27ac increased regions in 10-month post-treated ICE mice (16 mo.) (p < 0.01) to RNA-seq data from skeletal muscle from old WT mice (24 mo.) (padj < 0.05). (J) Aggregation plots of H3K27ac signal in bottom 25% quantile in spleen super-enhancer regions. (K) H3K27ac ChIP-seq tracks across spleen super-enhancers in the class II major MHC cluster and Nfkbid in 10-month post-treated muscle. Data are mean (n≥3) ± SD. *p < 0.05; **p < 0.01.
Figure 7.
Figure 7.. Epigenetic reprogramming restores youthful epigenetic marks
(A) AAV vectors used for polycistronic OSK expression. (B) Experimental scheme for AAV-OSK transduction to post-treated ICE cells and mice. (C) Scatter plot of mRNA changes in ICE (AAV-DJ-rtTA, n=3) and ICE+OSK (AAV-DJ- rtTA and OSK, n=3) fibroblasts from 1-month post-treated ICE mice. Linear regression. (D) Transgenes in the OSK transgenic mouse. (E) OSK induction in fibroblasts from young (3 mo., n=8) or old (15 mo., n=3) OSK transgenic mice by Dox treatment. (F) Scatter plot of mRNA changes by aging or OSK. Linear regression. (G) Epigenetic age of post-treated ICE (AAV-DJ-tTA, n=8) and ICE+OSK (AAV-DJ-tTA and OSK, n=8) MEFs at 10-day post-AAV transduction. Two-tailed paired Student’s t test. (H and I) H3K9me3 in Cre (AAV-MYO3-tTA, n=3), ICE (AAV-MYO3-tTA, n=2) and ICE+OSK (AAV-MYO3-tTA and OSK, n=4) kidney at 5-week post-AAV injection. One-way ANOVA-Bonferroni. (J) Optic nerve head: section used for axon counts (solid blue line). V, retinal blood vessels; MTZ, myelination transition zone; Ax, axon bundles. (K-N) Density of PPD-stained myelinated optic nerve axons. Scale bar, 10 μm. Two-tailed Student’s t test. (O) Intravitreal injection of AAV2-OSK and RGC sorting. RGCs isolated by FACS from retinas of young (5 mo., n=5), old (12 mo., n=6) and old mice injected with AAV2-OSK (15 mo., n=4). (P) Gene Ontology analysis of upregulated genes in RNA-seq data (5 mo. vs 12 mo., padj < 0.01). (Q) Scatter plot of mRNA changes due to aging or epigenetic reprogramming in age-associated genes (grey) and nervous system development genes (other colors). Data are mean ± SD or ± SEM (L and N). *p < 0.05; **** p < 0.0001.

Comment in

References

    1. Abdennur N., and Mirny LA. (2020). Cooler: scalable storage for Hi-C data and other genomically labeled arrays. Bioinformatics (Oxford, England) 36, 311–316. 10.1093/bioinformatics/btz540. - DOI - PMC - PubMed
    1. Ackert-Bicknell CL, Anderson LC, Sheehan S, Hill WG, Chang B, Churchill GA, Chesler EJ, Korstanje R, and Peters LL (2015). Aging Research Using Mouse Models. Current protocols in mouse biology 5, 95–133. 10.1002/9780470942390.mo140195. - DOI - PMC - PubMed
    1. Baruch K, Deczkowska A, David E, Castellano JM, Miller O, Kertser A, Berkutzki T, Barnett-Itzhaki Z, Bezalel D, Wyss-Coray T, et al. (2014). Aging. Aging-induced type I interferon response at the choroid plexus negatively affects brain function. Science (New York, NY) 346, 89–93. 10.1126/science.1252945. - DOI - PMC - PubMed
    1. Beggs ML, Nagarajan R, Taylor-Jones JM, Nolen G, Macnicol M, and Peterson CA (2004). Alterations in the TGFbeta signaling pathway in myogenic progenitors with age. Aging cell 3, 353–361. 10.1111/j.1474-9728.2004.00135.x. - DOI - PubMed
    1. Benayoun BA, Pollina EA, and Brunet A. (2015). Epigenetic regulation of ageing: linking environmental inputs to genomic stability. Nature reviews Molecular cell biology 16, 593–610. 10.1038/nrm4048. - DOI - PMC - PubMed

Publication types