. 2023 Jan 19;186(2):446-460.e19.
doi: 10.1016/j.cell.2022.12.022. Epub 2023 Jan 12.

An evolved AAV variant enables efficient genetic engineering of murine T cells

Affiliations

An evolved AAV variant enables efficient genetic engineering of murine T cells

William A Nyberg et al. Cell. .

Abstract

Precise targeting of large transgenes to T cells using homology-directed repair has been transformative for adoptive cell therapies and T cell biology. Delivery of DNA templates via adeno-associated virus (AAV) has greatly improved knockin efficiencies, but the tropism of current AAV serotypes restricts their use to human T cells employed in immunodeficient mouse models. To enable targeted knockins in murine T cells, we evolved Ark313, a synthetic AAV that exhibits high transduction efficiency in murine T cells. We performed a genome-wide knockout screen and identified QA2 as an essential factor for Ark313 infection. We demonstrate that Ark313 can be used for nucleofection-free DNA delivery, CRISPR-Cas9-mediated knockouts, and targeted integration of large transgenes. Ark313 enables preclinical modeling of Trac-targeted CAR-T and transgenic TCR-T cells in immunocompetent models. Efficient gene targeting in murine T cells holds great potential for improved cell therapies and opens avenues in experimental T cell immunology.

Keywords: AAV; CAR-T cell; CRISPR/Cas9; Gene Editing; Gene targeting; Genome wide CRISPR screen; Immunology; T cell; Trac-CAR.


Conflict of interest statement

Declaration of interests J.A., W.A.N., J.E., and A.A. are co-inventors on a patent application filed on the subject matter of this study. A.A. is a cofounder and board member at StrideBio and TorqueBio. J.E. is a compensated co-founder at Mnemo Therapeutics and a compensated scientific advisor to Cytovia Therapeutics. J.E. owns stocks in Mnemo Therapeutics and Cytovia Therapeutics. J.E. has received a consulting fee from Casdin Capital, Resolution Therapeutics and Treefrog Therapeutics. The J.E. lab has received research support from Cytovia Therapeutics, Mnemo Therapeutics, and Takeda Pharmaceutical Company.

Figures
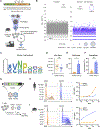
Figure 1.
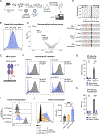
Figure 1.. Structure-guided evolution identifies an AAV capsid variant with murine T cell tropism
(A) Evolution of a pooled library of AAV6 capsid variants. The library was evolved for three cycles with CD3/CD28 bead–activated primary T cells from C57BL/6J mice and the parent and evolved libraries were analyzed by NGS. (B) Sequencing analysis of the parental and evolved libraries. Bubble plots depict the enrichment of capsid mutants. Each bubble represents a unique amino acid sequence. Bubble size is proportional to enrichment in the evolved library. (C) Sequence logo of the 7-mer sequence in the top 50 expressed capsids in the evolved library with more than 500-fold enrichment. (D) Packaging yield of AAV6 (n=20) and Ark313 (n=11), presented as viral genomes per liter (vg/l) of medium used to produce virus. Viral genomes were quantified by qPCR. (E) Number of viral genomes bound to the murine T cell surface following a 1 h incubation at 4°C to arrest cellular uptake, measured by qPCR. The bar graph depicts the mean ± SEM from four independent experiments. (F) Percentage of internalized viral genomes after reactivation of membrane-bound AAV by a 1 h incubation at 37°C. The bar graph depicts the mean ± SEM from four independent experiments (n=4). (G) scAAV-CBh-GFP was packaged into AAV6 and into Ark313. Transduction efficiencies were determined by flow cytometry at 48 hours after transduction. (H) Flow cytometry analysis of EGFP expression following transduction of human T cells with AAV6 or Ark313 at the indicated MOIs. Left: fluorescence histograms. Right: MFI of transduced cells. (I) Flow cytometry analysis of EGFP expression following transduction of murine T cells with AAV6 or Ark313 at the indicated MOIs. Left: fluorescence histograms. Right: MFI of transduced cells. (D–F) Statistical significance was assessed using unpaired t-tests. ns = not significant; *p<0.05; ***p<0.001.
Figure 2.
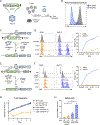
Figure 2.. Genome-wide CRISPR-Cas9 knockout screen identifies essential host factors for Ark313 infection
(A) Schematic of a genome-wide knockout screen to identify genes associated with Ark313 uptake and processing in primary murine T cells. (B) Cas9-expressing C57BL/6J T cells were isolated from spleens, activated with CD3/CD28 beads, and transduced with the sgRNA library. Three days later, T cells were re-activated for 24 h and transduced with scAAV(Ark313)-CAG-GFP. At 48 h after Ark313 transduction, live BFP-positive cells were sorted into four bins based on GFP expression. Genomic DNA was extracted from cells in each bin, and amplicon libraries were prepared and sequenced to determine sgRNA enrichment. (C) The volcano plot depicts genes ranked by gene effect size (x-axis) and -log10 lfsr (y-axis) as determined by waterbear analysis. Genes with lfsr values <0.1 are highlighted in red. (D) Top: distribution of log2 fold change (LFC) values of GFP-positive vs. GFP-negative cells for 90,230 guides in the library. Bottom: LFC for up to five sgRNAs targeting six depleted genes (red lines), overlaid on a gray gradient for the overall distribution. Values are the average of two technical replicates. (E) Illustration of transmembrane MHC class Ib and GPI-anchored MHC class Ib. (F) Arrayed validation of hits for the regulation of Ark313 infection. C57BL/6J T cells were nucleofected with RNPs targeting either Aavr, Gpr108, B2m, or H2-Q7 for knockout, transduced with Ark313 scAAV-CAG-GFP at an MOI of 3×10⁴, and analyzed by flow cytometry at 48 hours after transduction. Cells nucleofected with a SCR RNP were used as a negative control. (G) Murine T cells were treated with PI/PLC to catalyze GPI cleavage, then transduced with scAAV-CBh-GFP in either AAV6 or Ark313. Surface-bound virus on murine T cells was measured (as viral genomes) by qPCR following a 1 h incubation at 4°C to arrest cellular uptake. Results are the mean ± SEM from four independent experiments (n=4). (H) Murine T cells were treated with phosphatidylinositol-specific phospholipase C (PI/PLC) to catalyze GPI cleavage, then transduced with scAAV-CBh-GFP in either AAV6 or Ark313. GFP signal was analyzed by flow cytometry at 48 h to determine transduction. Results are the mean ± SEM from three independent experiments (n=3). (I) BALB/cByJ T cells were transduced with gRV for expressing either mKate (gRV-mKate) or H2-Q7-P2A-mKate (gRV-H2-Q7). QA2 expression was measured by flow cytometry 5 days after transduction. WT BALB/cByJ and C57BL/6J T cells were used as controls. Transduced cells were gated as mKate+. (J) WT cells, gRV-mKate-transduced cells, and gRV-H2-Q7-transduced cells were transduced with scAAV-CBh-GFP in Ark313 at an MOI of 1×10⁵ and analyzed by flow cytometry at 48 hours after transduction, gRV transduced cells were gated on mKate+. Left: representative histograms from one experiment. Right: results are the mean ± SEM from three mouse donors (n=3). (G,H,J) Significance was assessed using a two-way ANOVA and Tukey’s multiple comparison test. ns = not significant; **p<0.01; ***p<0.001; ****p<0.0001.
Figure 3.
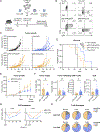
Figure 3.. Ark313 enables efficient gene targeting in primary murine T cells
(A) Schematic of gene knockout by delivering an sgRNA to Cas9-expressing T cells using Ark313. (B) Flow cytometry analysis of TCRβ expression in Cas9-expressing T cells following transduction with Trac sgRNA or scramble sgRNA using Ark313 at an MOI of 1×10⁵. (C) Integration of GFP HDRT at the Clta locus to generate a GFP-Clta fusion using Cas9-RNP nucleofection and AAV transduction. (D) GFP integration was analyzed by flow cytometry. Knock-in efficiency was compared for AAV6 and Ark313 across a range of MOIs. Left: representative histograms from one experiment. Right: summary from three independent experiments (n=3). (E) GFP integration at Clta in Rosa26-Cas9-EGFP T cells using single-AAV co-delivery of HDRT and sgRNA. (F) Integration of GFP at Clta was analyzed by flow cytometry. Knock-in efficiency was compared between AAV6 and Ark313 across a range of MOIs. Left: representative histograms from one experiment. Right: summary from four independent experiments (n=4). (G) Proliferation of WT T cells nucleofected with Cas9-RNP and transduced with AAV compared to AAV-transduced Cas9-expressing T cells. Results are the mean ± SEM from two mouse donors (n=2). (H) Normalized yield of Clta-GFP edited cells after five days of expansion post-transduction, comparing Cas9-RNP-nucleofected and AAV-transduced WT cells to AAV-transduced Cas9-expressing T cells. Results are the mean ± SEM from two mouse donors (n=2). Significance was assessed using a one-way ANOVA and the Šidák multiple comparisons test. *p<0.05; ****p<0.0001.
Figure 4.
Figure 4.. Targeting recombinant receptors to the Trac locus for experimental T cell immunology
(A) Schematic for targeted integration of a CAR, TCR, HIT, or CAR with TCR rescue at the Trac locus using co-delivery of HDRT and sgRNA in Ark313. (B) Integration of a h19m28z CAR at the Trac locus by Ark313-mediated delivery to Cas9-expressing T cells. Left: flow cytometry analysis of CAR expression after transduction at different MOIs. Right: representative TCRβ and CAR flow cytometry plots for transduction with Trac-CAR Ark313. (C) Left: representative TCRβ and CAR expression measured by flow cytometry after transduction with the indicated Ark313 HDRT at an MOI of 3×10⁴. Edited cells express either CAR, CAR with rescued TCR expression, or HIT. Right: expression of Trac-targeted OT-I TCR T cells in comparison to T cells isolated from transgenic OT-I TCR mice. (D) Cytotoxicity was determined based on the luciferase signal after a 24-hour co-culture of T cells with LL2 cells that express luciferase and hCD19. Results are the mean ± SEM from three technical replicates. Significance was assessed using one-way ANOVA and Dunnett’s multiple comparisons test. (E) Incucyte analysis of Trac-OT-I TCR T cells co-cultured with B78 cells that express mCherry and OVA. Results are the mean ± SEM from three technical replicates. Significance was assessed using a repeated-measures one-way ANOVA and Dunnett’s multiple comparisons test. (F) Efficacy of dual-gene targeting in murine T cells. GFP and CAR flow cytometry plots of Cas9-expressing T cells transduced with GFP-Clta and Trac-CAR Ark313 viruses at an MOI of 1×10⁵ for each AAV. (D,E) *p<0.05; **p<0.01; ***p<0.001; ****p<0.0001.
Figure 5.
Figure 5.. Targeting a CAR to the Trac locus using Ark313 enhances tumor control in an immunocompetent solid tumor mouse model
(A) Schematic of the syngeneic solid tumor model. hCD19-expressing LL2 cells were injected subcutaneously into C57BL/6J mice. The tumor-bearing mice were treated with either Ark313 Trac-CAR-T cells or gRV-CAR-T cells expressing the same h19m28z. The gRV-CAR-T cells were co-transduced with Ark313 expressing either a SCR sgRNA or Trac-targeting sgRNA to generate TCR+ and TCR CAR-T cells, respectively. Mice were pre-treated with 100 mg/kg cyclophosphamide two days before T cell injection. (B) Flow cytometry plots of TCRβ and CAR expression for engineered T cells using the indicated methods. (C) Tumor growth in non-treated (n=6) mice and in mice treated with 1.5×10⁶ Trac-CAR-T cells (n=9), gRV-CAR-gSCR T cells (n=10), or gRV-CAR-gTrac T cells (n=10). (D) Kaplan-Meier survival analysis of mice injected with hCD19-expressing LL2 cells. Comparison of non-treated mice to mice injected with either Trac-CAR-T cells (n=9), gRV-CAR-gSCR T cells (n=10), or gRV-CAR-gTrac T cells (n=10). Significance was assessed using a log-rank (Mantel-Cox) test. (E) Tumor growth in mice treated with 2×10⁶ Trac-CAR-T cells (n=11) or gRV-CAR-gTrac T cells (n=7). (F) Tumor and dLNs were isolated nine days after T cell injection. Tumors were weighed, and flow cytometry was conducted on the tumor and dLNs together. Results are the mean ± SEM. Significance were assessed using one-tailed Mann-Whitney tests. (G) Trac-CAR-T cells and gRV-CAR-gTrac T cells underwent either one stimulation (0 h) or two stimulations (0 and 12 h) with LL2-hCD19 cells. CAR MFI was measured at 12 h intervals for 48 h. Results are the mean ± SEM from three technical replicates (n=3). (H) T cell memory formation as determined by CD44 and CD62L expression at 48 h after either one or two stimulations with LL2-hCD19 cells. EM: CD44hi CD62Llo. CM: CD44hi CD62Lhi. N/SCM: CD44lo CD62hi. (D,F) ns = not significant; *p<0.05; **p<0.01.

References

    1. Sadelain M, Riviere I, and Riddell S. (2017). Therapeutic T cell engineering. Nature 545, 423–431. 10.1038/nature22395. - DOI - PMC - PubMed
    1. June CH, O'Connor RS, Kawalekar OU, Ghassemi S, and Milone MC (2018). CAR T cell immunotherapy for human cancer. Science 359, 1361–1365. 10.1126/science.aar6711. - DOI - PubMed
    1. June CH, and Sadelain M. (2018). Chimeric Antigen Receptor Therapy. N Engl J Med 379, 64–73. 10.1056/NEJMra1706169. - DOI - PMC - PubMed
    1. Fraietta JA, Nobles CL, Sammons MA, Lundh S, Carty SA, Reich TJ, Cogdill AP, Morrissette JJD, DeNizio JE, Reddy S, et al. (2018). Disruption of TET2 promotes the therapeutic efficacy of CD19-targeted T cells. Nature 558, 307–312. 10.1038/s41586-018-0178-z. - DOI - PMC - PubMed
    1. Shah NN., Qin H., Yates B., Su L., Shalabi H., Raffeld M., Ahlman MA., Stetler-Stevenson M., Yuan C., Guo S., et al.. (2019). Clonal expansion of CAR T cells harboring lentivector integration in the CBL gene following anti-CD22 CAR T-cell therapy. Blood Adv 3, 2317–2322. 10.1182/bloodadvances.2019000219. - DOI - PMC - PubMed

Publication types