. 2023 Jan 13;14(1):200.
doi: 10.1038/s41467-023-35806-8.

Interleukin-13 and its receptor are synaptic proteins involved in plasticity and neuroprotection

Affiliations

Interleukin-13 and its receptor are synaptic proteins involved in plasticity and neuroprotection

Shun Li et al. Nat Commun. .

Abstract

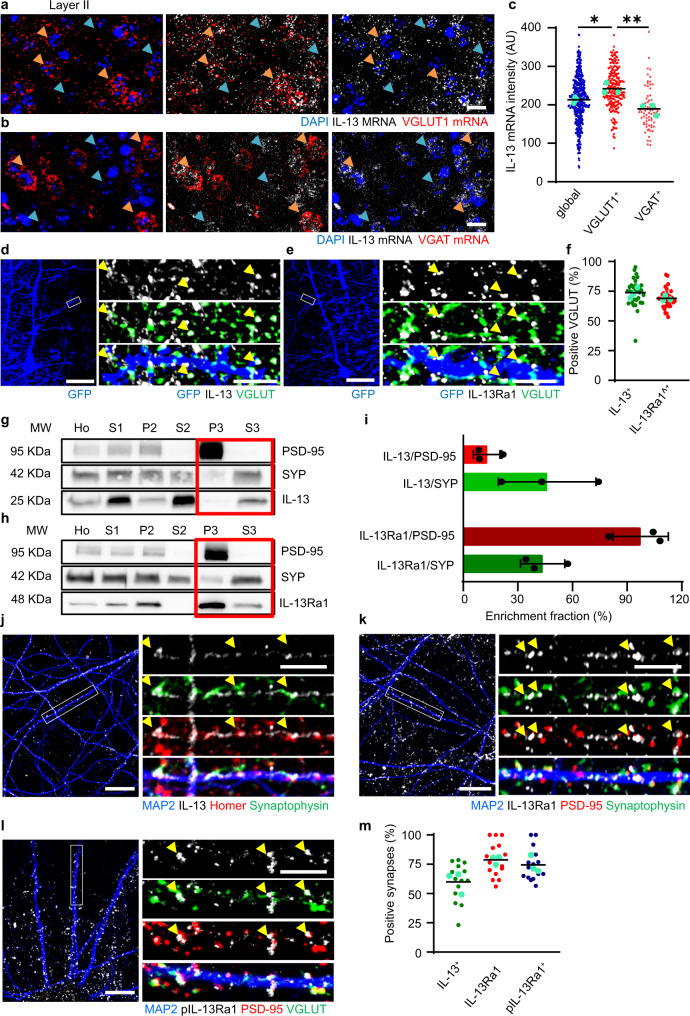
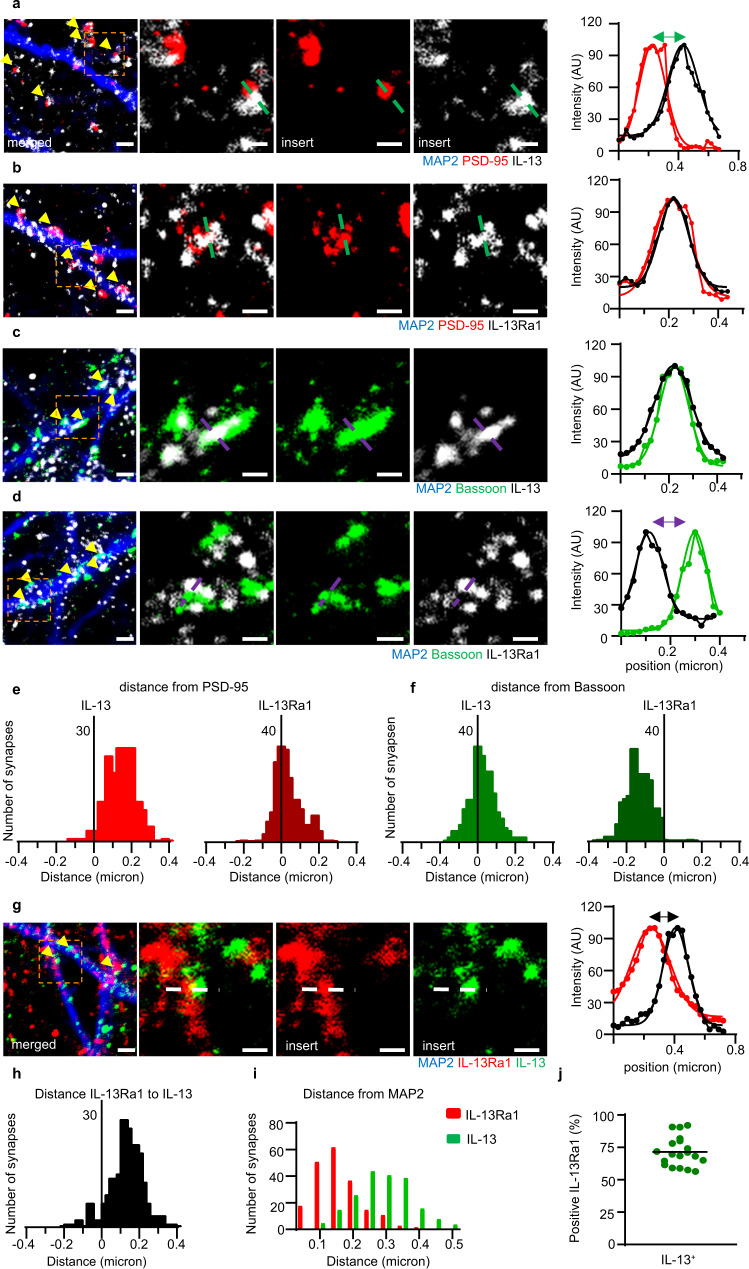
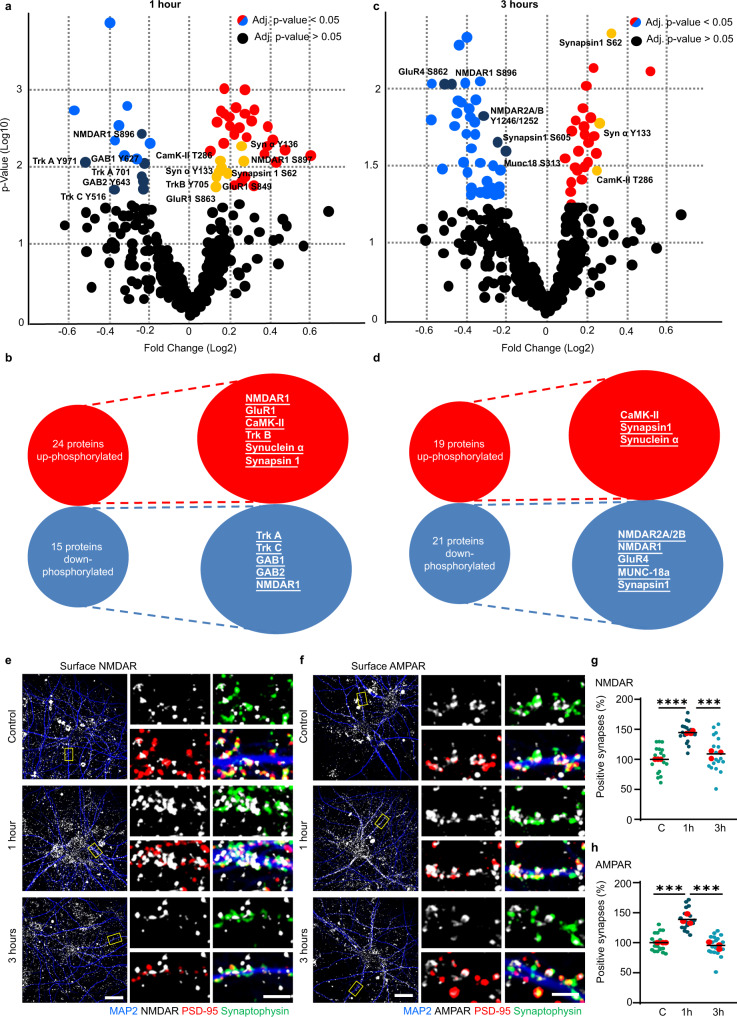
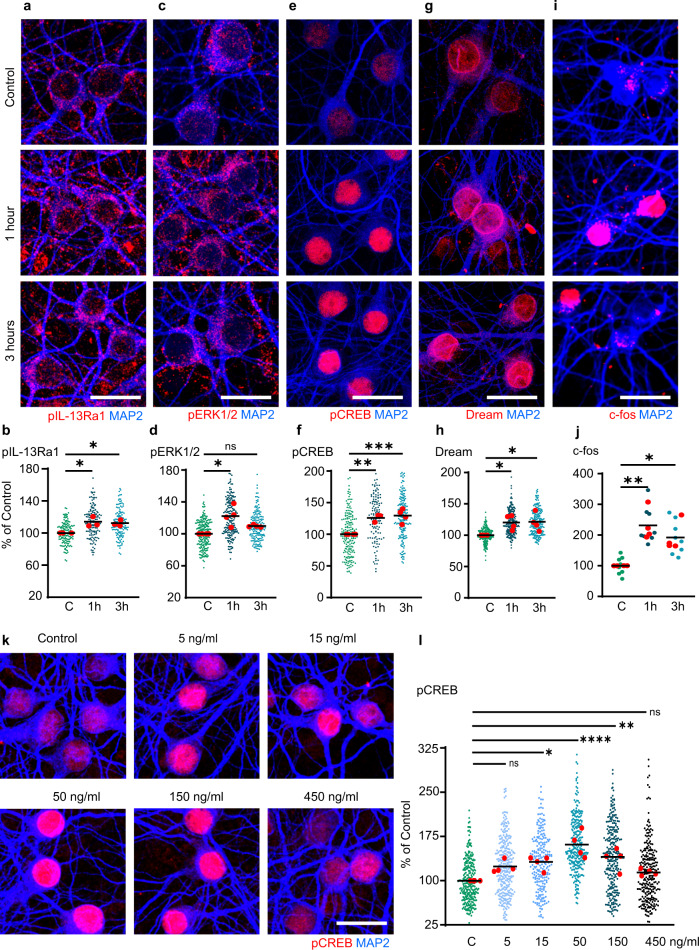
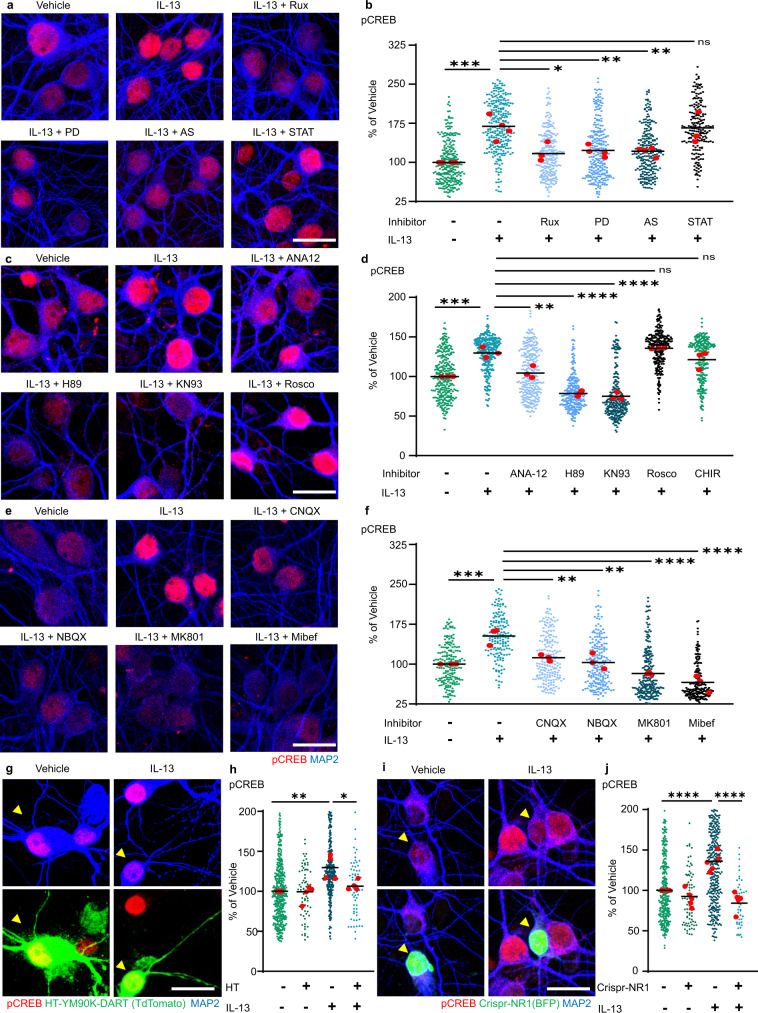
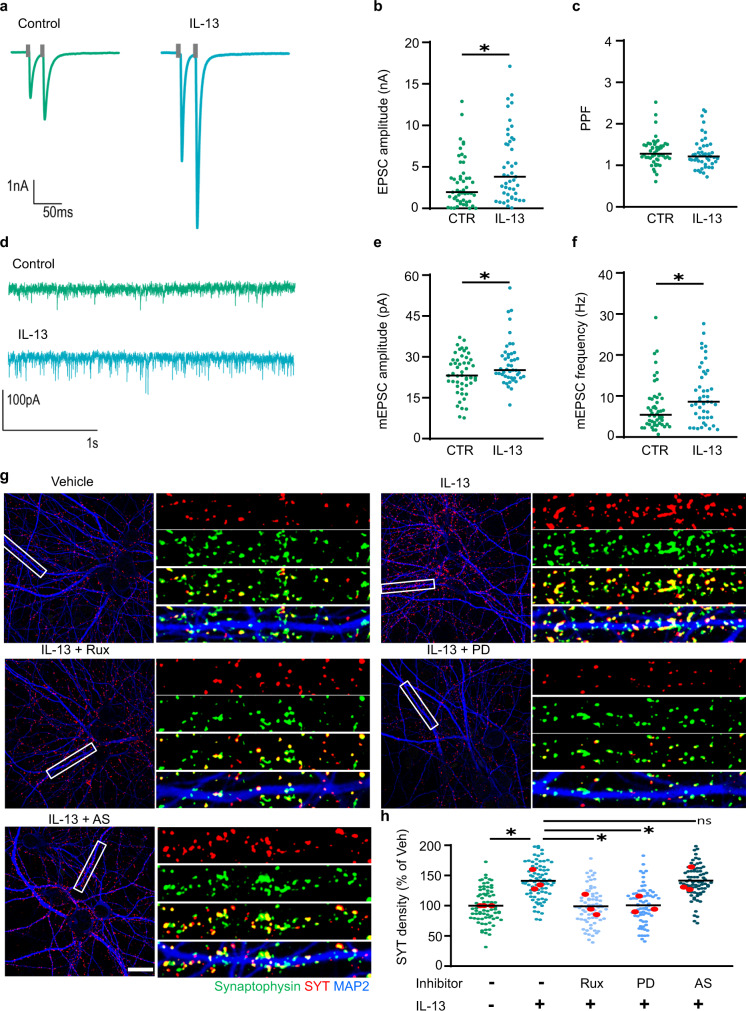
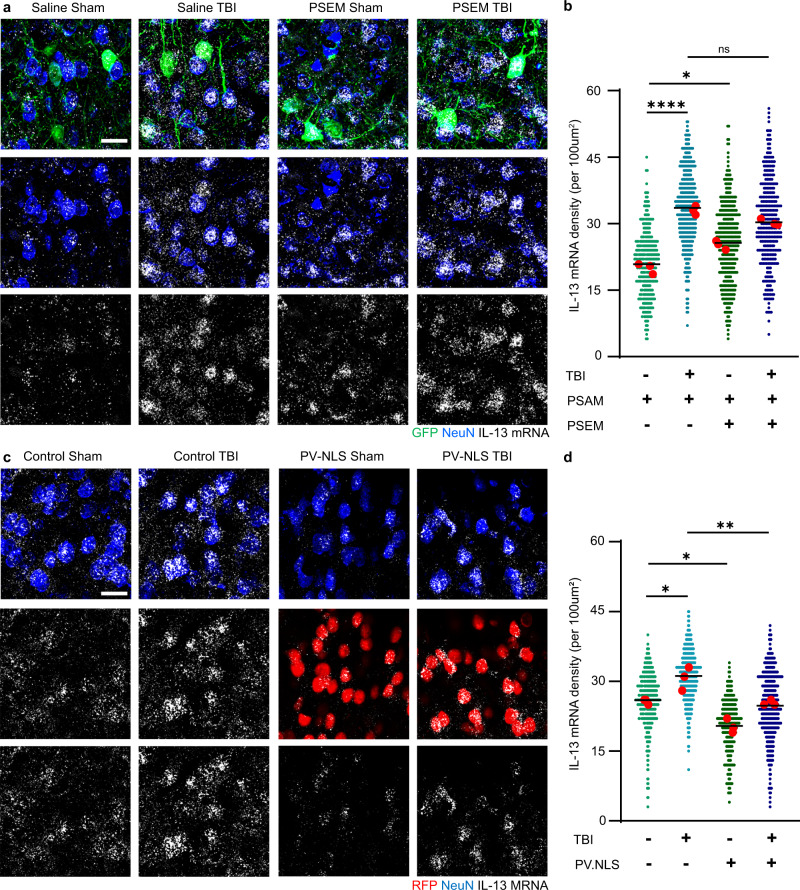
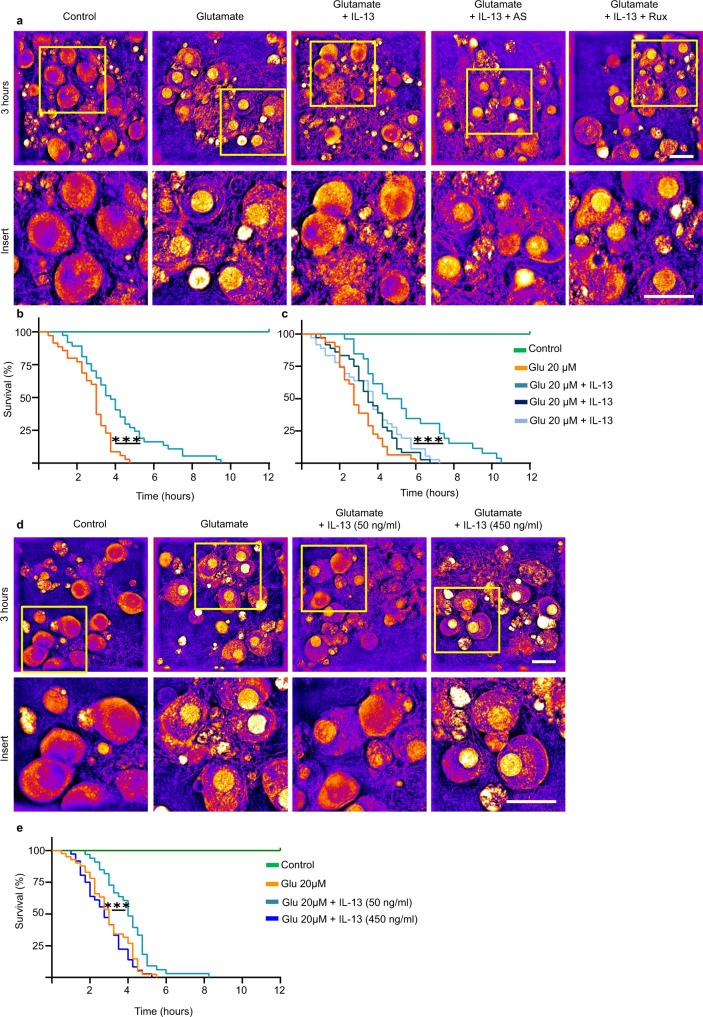
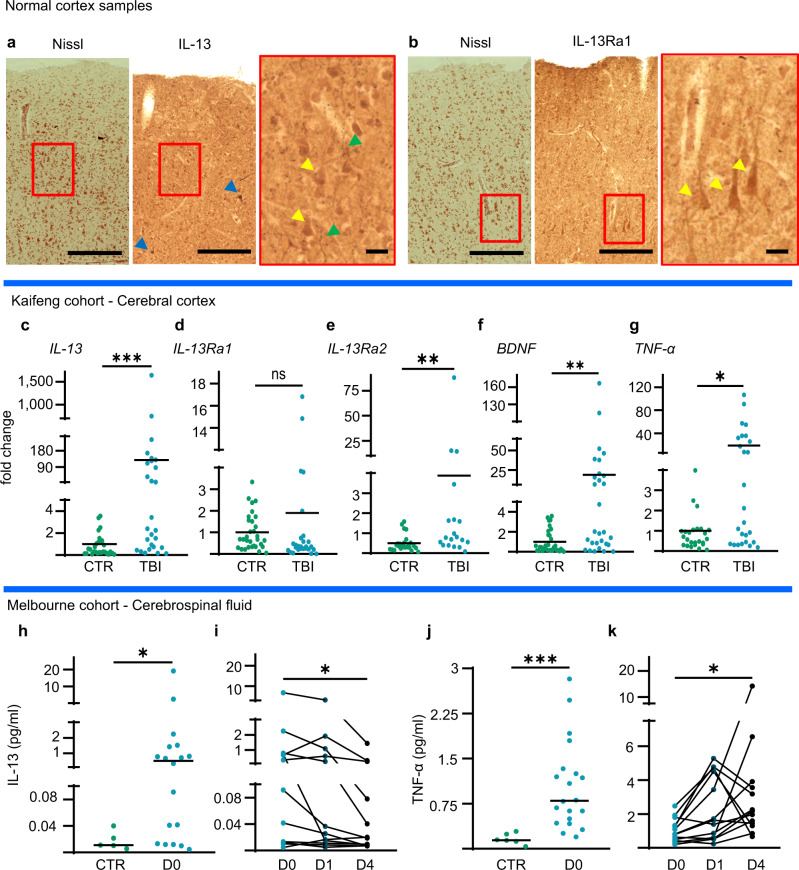
Immune system molecules are expressed by neurons, yet their functions are often unknown. We have identified IL-13 and its receptor IL-13Ra1 as neuronal, synaptic proteins in mouse, rat, and human brains, whose engagement upregulates the phosphorylation of NMDAR and AMPAR subunits and, in turn, increases synaptic activity and CREB-mediated transcription. We demonstrate that increased IL-13 is a hallmark of traumatic brain injury (TBI) in male mice as well as in two distinct cohorts of human patients. We also provide evidence that IL-13 upregulation protects neurons from excitotoxic death. We show IL-13 upregulation occurring in several cohorts of human brain samples and in cerebrospinal fluid (CSF). Thus, IL-13 is a physiological modulator of synaptic physiology of neuronal origin, with implications for the establishment of synaptic plasticity and the survival of neurons under injury conditions. Furthermore, we suggest that the neuroprotection afforded through the upregulation of IL-13 represents an entry point for interventions in the pathophysiology of TBI.


Conflict of interest statement

The authors declare no competing interests.

Figures

Fig. 1
Fig. 1. Neuronal IL-13 and its receptor IL-13Ra1 are synaptic proteins.
ac Increased IL-13 mRNA intensity in VGLUT1 positive population (orange arrows, a) compared to VGAT positive (orange arrows, b; p = 0.0049) and global cell populations (blue arrows; p = 0.0481) in layer II/III of mouse cortical sections (single molecule in situ hybridization). N = 3; n = global: 425; VGLUT1+: 214; VGLUT2+: 72 neurons. Scale bar: 20 μm. *: p < 0.05; **: p < 0.01. AU: arbitrary units. df Synaptic localization of IL-13 in mouse cortical sections (GFP sparse labelling and Immunostaining with GFP, pan-VGLUT and IL-13/IL-13Ra1). IL-13 and IL-13Ra1 show 74% and 69% respectively, of colocalization with VGLUT positive synapses. N = 3; n = IL-13: 31; IL-13Ra1: 30 dendrites. Scale bar overview 50 μm and insert 5 μm. gi Fractionation experiment in mouse cortical tissue shows IL-13 and IL-13Ra1 localization in homogenates (Ho), homogenates without nuclei, cell debris and extracellular matrix (S1), crude membrane fraction (P2), cytosolic compartment (S2), postsynaptic density (P3) and presynaptic cytosol fraction (S3). Enriched fractions show a lower amount of IL-13 in the PSD-95 positive fraction (13%) compared to the synaptophysin positive fraction (46%). Enriched fractions show a higher amount of IL-13Ra1 in the PSD-95 positive fraction (97%) compared to the synaptophysin positive fraction (44%). N = 3. Data shown as mean ± SD. jm Synaptic localization of IL-13, IL-13Ra1 and pIL-13Ra1 in rat cortical neurons (Immunostaining with MAP2, pre- and postsynaptic markers). IL-13, IL-13Ra1 and pIL-13Ra1 show 60%, 79% and 75%, respectively, of colocalization with mature synapses. N = 3; n = IL-13 + : 14; IL-13Ra1 + : 15; pIL-13Ra1: 15 dendrites. Scale bar overview 10 μm and insert 5 μm. c One-way ANOVA with Sidak’s multiple comparison. Source data are provided as a Source Data file.
Fig. 2
Fig. 2. Presynaptic IL-13 and a postsynaptic lL-13Ra1 demonstrated by super-resolution microscopy.
a Distinct separation between PSD-95 and IL-13 visible in STED images of single synapses. b STED imaging and intensity profile plots of single synapses show an overlap between PSD-95 and IL-13Ra1. c STED imaging and intensity profile plots of single synapses show an overlap between Bassoon and IL-13. d Distinct separation between Bassoon and IL-13Ra1 visible in STED images of single synapses. e Distribution of distance between IL-13 and IL-13Ra1 peaks compared to PSD-95 reveals that IL-13 peak is distal to PSD-95, the IL-13Ra1 overlaps with the PSD-95 peak. f Distribution of distance between peaks reveal an overlap between IL-13 and Bassoon, whereas IL-13Ra1 peak is distinct at −150 nm from Bassoon. g STED imaging and intensity profile of single synapses show a separation between IL-13Ra1 and IL-13. h Distribution of distance of IL-13 and IL-13Ra1 reveals that the two peaks do not overlap and are located at ~150 nm. i Distribution of the separation of IL-13Ra1 and IL-13 in reference to the MAP2 + dendritic profile reveals that IL-13Ra1 peak is proximal, whereas IL-13 peak is distally located, in agreement with post- and presynaptic localization. j IL-13 shows 72% synaptic colocalization with IL-13Ra1. aj In all experiments N = 3; n = 200 synapses (19 dendrites for j). Scale bar overview: 1 μm, scale bar insert: 500 nm. AU: arbitrary units. Source data are provided as a Source Data file.
Fig. 3
Fig. 3. IL-13 causes the large-scale phosphorylation of glutamate receptors and presynaptic proteins.
a, b Volcanoplot and list of proteins showing significant change in their phosphorylation (up or down) 1 h after neurons were exposed to IL-13 (50 ng/ml) or control (0.1% BSA). red = up-phosphorylated, blue = down-phosphorylated. N = 4. c, d Volcanoplot and list of proteins showing significant change in their phosphorylation (up or down) 3 h after neurons were exposed to IL-13 (50 ng/ml) or control (0.1% BSA). red = up-phosphorylated, blue = down-phosphorylated. N = 4. Complete list of significantly phosphorylated proteins can be found in supplementary information. eg Extracellular NDMAR antibody feeding assay co-stained with MAP2, Synaptophysin and PSD-95 in rat primary cortical neurons 1 h and 3 h after IL-13 treatment (50 ng/ml) or vehicle (0.1% BSA). Significant increase in surface NMDAR is visible 1 h (p < 0.0001) after IL-13 application. N = 3. Scale bar overview: 20 μm, scale bar insert: 2 μm. ***: p < 0.001; ****: p < 0.0001. fh Extracellular AMPAR antibody feeding assay co-stained with MAP2, Synaptophysin and PSD-95 in rat primary cortical neurons 1 h and 3 h after IL-13 treatment (50 ng/ml) vs vehicle (0.1% BSA). Significant increase in surface AMPAR is visible 1 h (p = 0.0005) after IL-13 application. N = 3. Scale bar overview: 20 μm, scale bar insert: 2 μm. ***: p < 0.001 (a, c): PROTein array Expression AnalysiS; https://github.com/Rida-Rehman/PROTEAS. (f, g): One-way ANOVA with Sidak’s multiple comparison. Source data are provided as a Source Data file.
Fig. 4
Fig. 4. IL-13 induces CREB phosphorylation and immediate-early genes transcription.
a, b Significant up-phosphorylation of IL-13Ra1 in rat cortical neurons 1 h (p = 0.0147) and 3 h (p = 0.0220) after IL-13 treatment (50 ng/ml). N = 3; n = C: 143; 1 h: 137; 3 h: 137 neurons. c, d Significant up-phosphorylation of ERK1/2 in rat cortical neurons 1 h (p = 0.0029) after IL-13 treatment (50 ng/ml). N = 4; n = C: 208; 1 h: 195; 3 h: 161 neurons. e, f Significant up-phosphorylation of CREB in rat cortical neurons 1 h (p = 0.0028) and 3 h (p = 0.0008) after IL-13 treatment (50 ng/ml). N = 3; n = C: 208; 1 h: 121; 3 h: 187 neurons. g, h Significant up-phosphorylation of DREAM in rat cortical neurons 1 h (p = 0.0381) and 3 h (p = 0.0387) after IL-13 treatment (50 ng/ml). N = 4; n = C: 232; 1 h: 243; 3 h: 246 neurons. i, j Significant increase of c-fos positive cells in rat cortical neurons 1 h (p = 0.0027) and 3 h (p = 0.0207) after IL-13 treatment (50 ng/ml). N = 4. k, l Dose-dependent effect of IL-13 treatment on CREB phosphorylation until 50 ng/ml, doses exceeding this limit reduces phosphorylation of CREB (C vs 5 ng/ml: p = 0.1089; C vs 15 ng/ml: p = 0.0219; C vs 50 ng/ml: p < 0.0001; C vs 150 ng/ml: p = 0.0052; C vs 450 ng/ml: p = 0.4619). N = 4; n = C: 274; 5 ng/ml: 292; 15 ng/ml: 232; 50 ng/ml: 283; 150 ng/ml: 265; 450 ng/ml: 265 neurons. In all experiments, vehicle (0.1% BSA) was used as control. Scale bar (ak): 20 μm. *: p < 0.05; **: p < 0.01; ****: p < 0.0001. b, d, f, h, j, l One-way ANOVA with Dunnet’s multiple comparison. Source data are provided as a Source Data file.
Fig. 5
Fig. 5. IL-13 activates CREB phosphorylation through JAK/ERK1/2 and NMDAR/AMPAR signaling.
a, b JAK (Ruxolitinib; 280 nM), ERK1/2 (PD98059; 20 μM) and STAT6 (AS1517499; 1 μM) inhibitors significantly abolish the IL-13 dependent CREB phosphorylation in rat cortical neurons (veh vs IL-13: p = 0.0002; IL-13 vs RUX: p = 0.0108; IL-13 vs PD: p = 0.0083; IL-13 vs AS: p = 0.0082). STAT3 inhibitor (Stattic; 20 μM) did not alter the IL-13 induced phosphorylation of CREB (IL-13 vs STAT: p = 0.9994). N = 3–4; n = veh: 268; IL-13: 275; Rux: 249; PD: 249; AS: 248; STAT: 199 neurons. c, d TrkB receptor antagonist (ANA-12; 10 μM), PKA inhibitor (H89; 10 μM) and CAMK-II inhibitor (KN93; 10 μM) significantly reduce the IL-13 induced CREB phosphorylation (veh vs IL-13: p = 0.0002; IL-13 vs ANA-12: p = 0.0012; IL-13 vs H89: p < 0.0001; IL-13 vs KN93: p < 0.0001). Both the CDK5 inhibitor (Roscovitine; 10 μM) and GSK-3 inhibitor (CHIR 98014; 10 μM) do not alter IL-13 induced CREB phosphorylation (IL-13 vs Rosco: p = 0.8861; IL-13 vs CHIR: p = 0.5020). N = 3; n = Veh: 282; IL-13: 301; ANA-12: 276; H89: 253; KN93: 262; Rosco: 264; CHIR: 251 neurons. e, f AMPA receptor antagonists (CNQX, NBQX; both 10 μM), NMDA receptor antagonist (MK-801; 10 μM) and calcium channel blocker (Mibefradil; 10 μM) significantly reduce the IL-13 induced CREB phosphorylation (veh vs IL-13: p = 0.0004; IL-13 vs CNQX: p = 0.0037; IL-13 vs NBQX: p = 0.0010; IL-13 vs MK801: p < 0.0001; IL-13 vs Mibef: p < 0.0001). N = 3; n = Veh: 190; IL-13: 160; CNQX: 197; NBQX: 198; MK801: 234; Mibef: 202 neurons. g, h Cell specific inhibition of the AMPAR using the YM90K-DART (100 nM) pharmacology tethered to a transmembranal HaloTag (HaloTag-TM) significantly decreases CREB phosphorylation 1 h post IL-13 treatment (50 ng/ml; p = 0.0157). N = 4; n = HT-/IL-13-: 440; HT+/IL-13-: 70; HT-/IL-13+: 322; HT+/IL-13+: 62 neurons. i, j Cell specific genetic mutagenesis of Grin1 using CRISPR-Cas9/BFP-Cre transfected cells significantly decreases CREB phosphorylation 1 h post IL-13 treatment (50 ng/ml: yellow arrows; p < 0.0001). N = 5; n = BFP-/IL-13-: 324; BFP+/IL-13-: 77; BFP-/IL-13+: 366; BFP+/IL-13+: 46 neurons. Vehicle (0.1% DMSO) was used as control in (af); (0.1% BSA) was used as control in (gi). Scale bar: 20 μm. **: p < 0.01; ***: p < 0.001; ****: p < 0.0001. b, d, f, h, j One-way ANOVA with Sidak’s multiple comparison. Source data are provided as a Source Data file.
Fig. 6
Fig. 6. IL-13 increases synaptic activity.
a, b Significant increase in the amplitude of excitatory postsynaptic currents (EPSC) after 30 min of IL-13 treatment (p = 0.0139). N = CTR: 50 cells; IL-13: 45 cells. c No significant difference in paired pulse facilitation (PPF - interstimulus interval 25 ms) after 30 min of IL-13 treatment (p = 0.2508). N = CTR: 50 cells; IL-13: 45 cells. d, e Significant increase in the amplitude of miniature excitatory postsynaptic currents (mEPSC) after 30 min of IL-13 treatment (p = 0.0475). N = CTR: 50 cells; IL-13: 45 cells. f Significant increase in the frequency of miniature excitatory postsynaptic currents (mEPSC) after 30 min of IL-13 treatment (p = 0.0179). N = CTR: 50 cells; IL-13: 45 cells. g, h Anti-synaptotagmin antibody feeding assay; significant increase of anti-synaptotagmin-labelled synapses after IL-13 treatment in rat cortical neurons. JAK (Ruxolitinib; 280 nM) and ERK1/2 (PD98059; 20 μM) inhibitors significantly abolish the IL-13 induced synaptotagmin labelling (veh vs IL-13: p = 0.0366; IL-13 vs Rux: p = 0.0344; IL-13 vs PD: p = 0.0368). STAT6 (AS1517499; 1 μM) inhibitor did not alter IL-13 induced synaptotagmin labelling (p > 0.9999). Total number of synapses was assessed by synaptophysin immunostaining after fixation/permeabilization. N = 3; n = Veh: 72; IL-13: 78; Rux: 69; PD: 69; AS: 76 dendrites. IL-13 used at 50 ng/mL; 0.1% BSA (electrophysiology) or 0.1% DMSO (pharmacology) as vehicle control. Scale bar overview: 20 μm, insert: 10 μm. *: p < 0.05. b, c, e, f two-tailed Mann–Whitney test. h One-way ANOVA with Sidak’s multiple comparison. Source data are provided as a Source Data file.
Fig. 7
Fig. 7. Upregulation of neuronal IL-13 is driven by neuronal activity and nuclear calcium signaling upon traumatic brain injury.
a, b Upregulation of IL-13 mRNA expression upon blunt, closed TBI in mouse (3 h post injury). Chemogenetic suppression of inhibitory PV interneurons enhances the upregulation of IL-13 mRNA at baseline and after trauma (Saline Sham vs Saline TBI: p < 0.0001; Saline Sham vs PSEM Sham: p = 0.0150; Saline TBI vs PSEM TBI: p = 0.0742). N = 3; n = SS: 332; ST: 422; PS: 382; PT: 319 neurons. c, d Neuronal nuclear calcium buffering (PV.NLS) strongly reduces IL-13 mRNA at baseline and upon TBI (Control Sham vs Control TBI: p = 0.0141; Control Sham vs PV.NLS Sham: p = 0.00141; Control TBI vs PV.NLS TBI: p = 0.0069). N = 3; n = MS: 427; MT: 394; PS: 215; PT: 385 neurons. Scale bar: 20 μm. *: p < 0.05; **: p < 0.01; ****: p < 0.0001. b, d One-way ANOVA with Sidak’s multiple comparison. Source data are provided as a Source Data file.
Fig. 8
Fig. 8. IL-13 reduces excitotoxic neuronal death.
ac Significant reduction of glutamate (20 μM) induced neuronal toxicity after IL-13 treatment (50 ng/ml) in rat cortical neurons revealed in holotomography microscopy live imaging (p = 0.0003). Treatment with JAK (Ruxolitinib; 280 nM) and STAT6 (AS1517499; 1 μM) inhibitors show that the protective effects of IL-13 are dependent on a JAK/STAT6 dependent mechanism (IL-13 vs Rux: p = 0.0030; IL-13 vs AS: p = 0.0006). N = 4; n = C: 40; 20 μM: 35; 20 μM + IL-13: 37; AS: 36; Rux: 36 neurons. d, e High dose IL-13 (450 ng/ml) does not prevent to glutamate induced neuronal toxicity (IL-13 450 ng/ml vs IL-13 50 ng/ml: p = 0.0002). N = 4; n = C: 41; 20 μM: 41; 20 μM + IL-13 50 ng/ml: 33; 20 μM + IL-13 450 ng/ml: 36 neurons. 0.1% BSA + 0.1% DMSO used as vehicle control. Scale bar: 20 μm. **: p < 0.01; ***: p < 0.001. b, c, e Log-rank (Mantel–Cox) test. Source data are provided as a Source Data file.
Fig. 9
Fig. 9. IL-13 is expressed in the human brain and is upregulated upon TBI in the human cortex and CSF.
a Darrow red Pigment-Nissl and Immunohistochemistry for IL-13 shows moderate, high and very high-expressing neuronal populations in human post-mortem cortical tissue. N = 3. b Darrow red Pigment-Nissl and Immunohistochemical staining of IL-13Ra1 shows a large number of neurons across all cortical layers of post-mortem cortical tissue. N = 3. a, b Scale bar overview: 100 μm, scale bar insert: 10 μm. cg Significant upregulation of the mRNA for IL-13 (p = 0.0002), IL-13Ra2 (p = 0.0021), BDNF (p = 0.0015) and TNF-α (p = 0.0160), but not of IL-13Ra1 (p = 0.0998), in human cortical tissue samples resected after traumatic brain injury vs controls from elective surgery. (RT-qPCR). CTR N = 34; TBI N = 29. h Significant upregulation of IL-13 protein in cerebrospinal fluid samples from severe TBI patients within 24 h of TBI (p = 0.0243). CTR N = 5; TBI N = 18. i Time course of CSF levels of IL-13 in severe TBI patients: progressive decrease of IL-13 levels between D0 and D4 (p = 0.0016). D0 N = 12; D1 N = 12; D4 N = 12. j Significant upregulation of TNF- α in CSF of TBI patients (p < 0.0001). CTR N = 5; TBI N = 20. k Progressive increase of TNF-α levels in the CSF of severe TBI patients between d0 and D4 (p = 0.0181). D0 N = 12; D1 N = 12; D4 N = 12.Cytokines measured by SIMOA assay. *: p < 0.05. **: p < 0.01. ***: p < 0.001. cg, h, j Two-tailed Mann–Whitney test. i, k Friedman test with Dunn’s multiple comparison. Source data are provided as a Source Data file.

References

    1. Nguyen PT, et al. Microglial Remodeling of the Extracellular Matrix Promotes Synapse Plasticity. Cell. 2020;182:388–403.e15. doi: 10.1016/j.cell.2020.05.050. - DOI - PMC - PubMed
    1. Stellwagen D, Malenka RC. Synaptic scaling mediated by glial TNF-alpha. Nature. 2006;440:1054–1059. doi: 10.1038/nature04671. - DOI - PubMed
    1. Nelson TE, et al. Altered synaptic transmission in the hippocampus of transgenic mice with enhanced central nervous systems expression of interleukin-6. Brain. Behav. Immun. 2012;26:959–971. doi: 10.1016/j.bbi.2012.05.005. - DOI - PMC - PubMed
    1. Datwani A, et al. Classical MHCI molecules regulate retinogeniculate refinement and limit ocular dominance plasticity. Neuron. 2009;64:463–470. doi: 10.1016/j.neuron.2009.10.015. - DOI - PMC - PubMed
    1. Boulanger LM. Immune proteins in brain development and synaptic plasticity. Neuron. 2009;64:93–109. doi: 10.1016/j.neuron.2009.09.001. - DOI - PubMed

Publication types