. 2023 Jan 13;42(1):20.
doi: 10.1186/s13046-022-02553-5.

Stroma-derived miR-214 coordinates tumor dissemination

Affiliations

Stroma-derived miR-214 coordinates tumor dissemination

Francesca Orso et al. J Exp Clin Cancer Res. .

Abstract

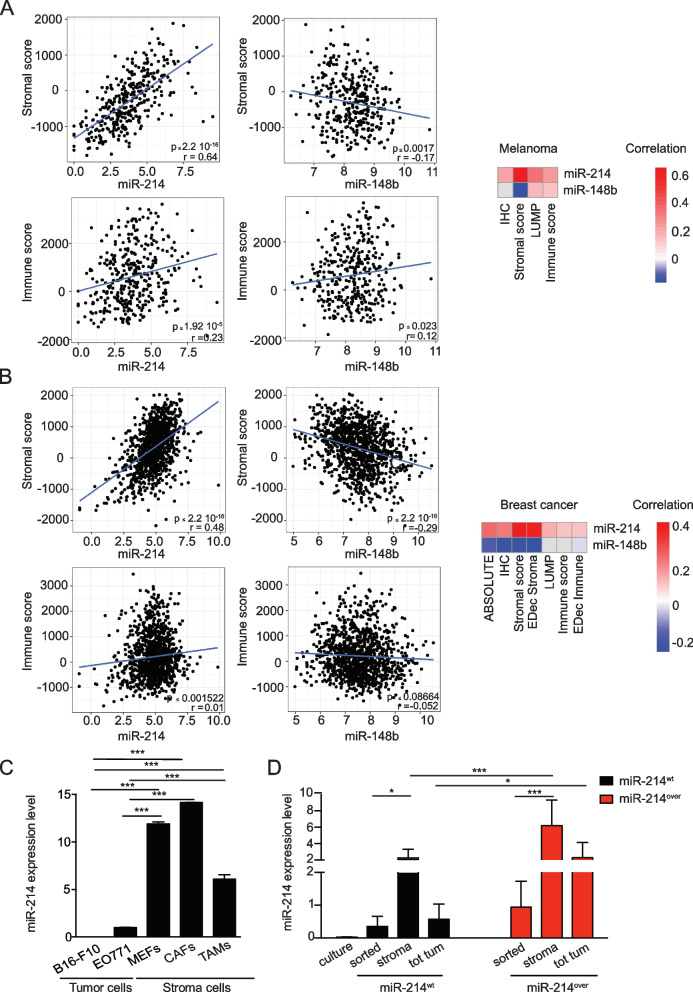
Background: Tumor progression is based on a close interaction between cancer cells and Tumor MicroEnvironment (TME). Here, we focus on the role that Cancer Associated Fibroblasts (CAFs), Mesenchymal Stem Cells (MSCs) and microRNAs (miRs) play in breast cancer and melanoma malignancy.

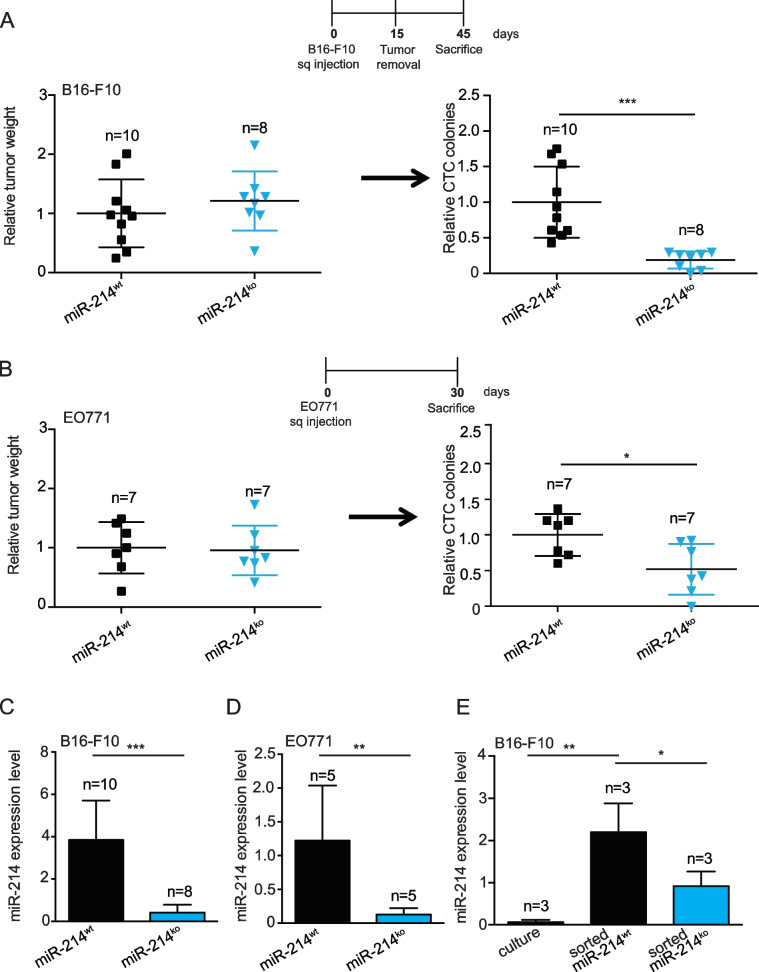
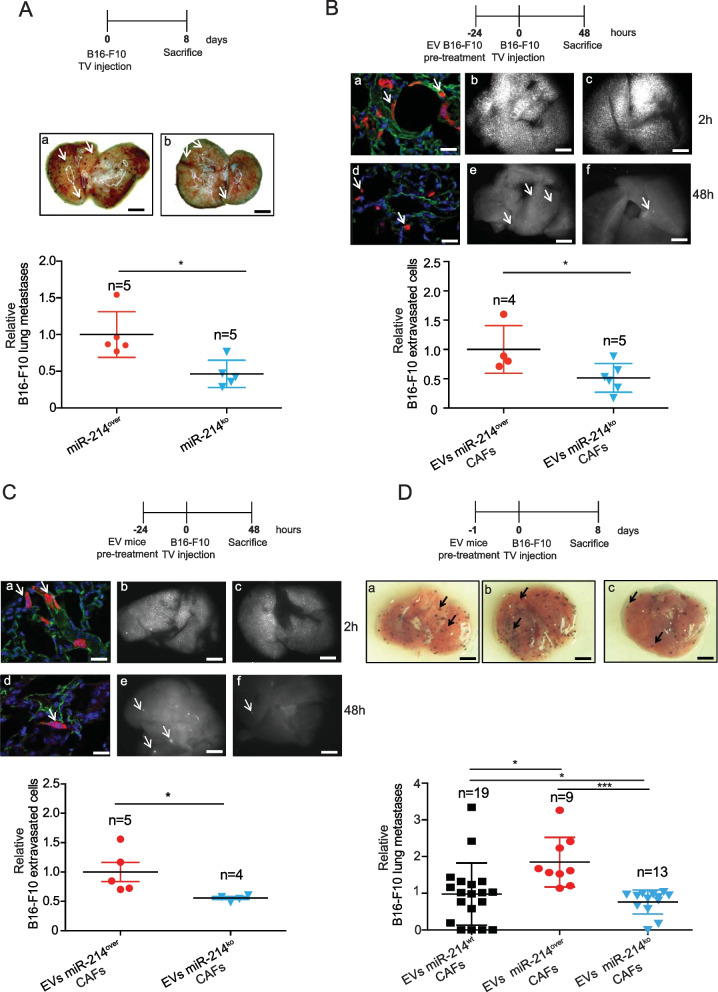
Methods: We used public databases to investigate miR-214 expression in the stroma compartment of primary human samples and evaluated tumor formation and dissemination following tumor cell injections in miR-214 overexpressing (miR-214over) and knock out (miR-214ko) mice. In addition, we dissected the impact of Conditioned Medium (CM) or Extracellular Vesicles (EVs) derived from miR-214-rich or depleted stroma cells on cell metastatic traits.

Results: We evidence that the expression of miR-214 in human cancer or metastasis samples mostly correlates with stroma components and, in particular, with CAFs and MSCs. We present data revealing that the injection of tumor cells in miR-214over mice leads to increased extravasation and metastasis formation. In line, treatment of cancer cells with CM or EVs derived from miR-214-enriched stroma cells potentiate cancer cell migration/invasion in vitro. Conversely, dissemination from tumors grown in miR-214ko mice is impaired and metastatic traits significantly decreased when CM or EVs from miR-214-depleted stroma cells are used to treat cells in culture. Instead, extravasation and metastasis formation are fully re-established when miR-214ko mice are pretreated with miR-214-rich EVs of stroma origin. Mechanistically, we also show that tumor cells are able to induce miR-214 production in stroma cells, following the activation of IL-6/STAT3 signaling, which is then released via EVs subsequently up-taken by cancer cells. Here, a miR-214-dependent pro-metastatic program becomes activated.

Conclusions: Our findings highlight the relevance of stroma-derived miR-214 and its release in EVs for tumor dissemination, which paves the way for miR-214-based therapeutic interventions targeting not only tumor cells but also the TME.

Keywords: Crosstalk; Extracellular vesicles (EVs); IL-6; Metastasis formation; Stroma; miR-214.


Conflict of interest statement

The authors declare that they have no known competing financial interests.

Figures

Fig. 1
Fig. 1
miR-214 expression correlates with stroma components in human tumors and it is highly expressed in stroma fibroblasts. A-B Significant correlations between miR-214 (positive) and miR-148b (negative) expression and stroma/immune cell composition in TCGA-SKCM (A) and TCGA-BRCA (B), for metastasis or primary samples, are presented as “scores”, based on 4 (A) or 7 (B) different evaluation methods, in plots and heatmaps (Red = positive; white/blue = negative; grey = no correlation). Non significant relationships: p-value > 0.05. Estimates: EDec Immune/Stromal = Epigenomic Deconvolution of stromal/immune percentage [38]; Immune Score = ssGSEA based on gene expression profiles of 141 immune genes [39]; LUMP = Leukocytes Unmethylation for Purity, which averages 44 non-methylated immune-specific CpG sites [40]; Stromal score = ssGSEA based on gene expression profiles of 141 stromal genes [39]; IHC = estimated by image analysis of haematoxylin and eosin stained slides produced by the Nationwide Children's Hospital Biospecimen Core Resource [41]; ABSOLUTE = based on somatic copy-number data [42]. C miR-214 expression levels in murine tumor, stroma and immune cells as indicated and evaluated by qRT-PCR analysis. D GFP+ B16-F10 cells were subcutaneously injected into miR-214wt and miR-214over syngenic mice to generate tumors. 15 days later, mice were sacrificed, transplants dissected and tumor/stroma cells separated by FACS sorting. miR-214 expression levels were measured in GFP.+ B16-F10 cells before the injection (culture) or FACS sorted from subcutaneous tumors (sorted), in the remaining stroma cells, after the sorting (stroma) and in the total tumor mass (tot tumor) by qRT-PCR analysis, 3 animals per group (n = 3). C-D Results are represented as fold changes (mean ± SD of triplicates) relative to the median, normalized on U6. Two independent experiments were performed and representative results are shown. MEFs = murine embryo fibroblasts; CAFs = cancer associated fibroblasts; TAMs = Tumor Associated Macrophages; SD = standard deviation. H&E = Haematoxylin & Eosin; *P ≤ 0.05; **P ≤ 0.01; ***P ≤ 0.001
Fig. 2
Fig. 2
Overexpression of miR-214 in stroma cells favors metastasis formation of melanoma and breast cancer cells. A Analyses of experimental lung metastasis formation 8 days after tail vein injection of B16-F10 cells into miR-214wt and miR-214over syngeneic mice. Representative pictures of the whole lungs (a, b; scale bar = 2 mm), arrows indicate metastasis formations. Relative lung metastases between the two groups of mice is shown in the graph for the indicated number (n) of animals. B CMRA-labeled B16-F10 cells (red) were injected into the tail vein of miR-214wt and miR-214over syngeneic mice and extravasation was evaluated 2 h (a, b, c) or 48 h (d, e, f) later. Representative fields of murine lung sections stained for CD31 (green) to highlight blood vessels and counterstained with DAPI (blue); scale bar: 25 µm (a, d). Representative pictures of whole lungs containing red-labeled B16-F10 cells are shown; scale bar: 1 mm (b, c, e, f). Relative extravasated cells in the whole lungs at 48 h is shown in the graph for the indicated number (n) of mice, as mean ± SEM. C-D In vivo tumor growth and metastatic dissemination of B16-F10 (C) or EO771 (D) cells injected subcutaneously in miR-214wt and miR-214.over syngeneic mice, 45 or 30 days pos-inoculation respectively. In (C) tumors were removed 15 days post-injection and analyzed. Relative primary tumor weight and Circulating Tumor Cells (CTCs) are shown in the graphs as mean ± SEM, for the indicated number of mice (n). Two independent experiments were performed and representative results are shown. CMRA = CellTracker™ Orange; CD31 = cluster of differentiation 31; n = number of mice; DAPI = 4’, 6-diamidino-2-fenylindole SEM = standard error of mean. *P ≤ 0.05; **P ≤ 0.01; ***P ≤ 0.001
Fig. 3
Fig. 3
Stroma components favor tumor cell motility in a miR-214-dependent manner. AL Wound healing (A, B, E, F, G, H, I, J) or transwell (C, D, K, L) assays for mouse B16-F10 or EO771 or human MA-2 or 4175-TGL cells were pretreated for 24 h with conditioned medium (CM) or Extracellular Vesicles (EVs) derived from either miR-214wt and miR-214over CAFs (A, C) or MEFs (B, D) or, from either NIH3T3 mouse fibroblasts (E-H) or HS5 human bone marrow stroma cells (I-L) previously transduced with a miR-214sponge (miR-214sponge) or an empty (control) expressing vector. M Wound healing assay for MA-2 cells pretreated for 24 h with EV-depleted Conditioned Medium (CM) or EVs derived from HS5 cells previously transduced with a miR-214sponge (miR-214sponge) or an empty (control) expressing vector. All transwell migration assays were evaluated 18 h later; while wound healing motility assays were evaluated 6 h (B16-F10)—18 h (EO771, MA-2)—24 h (4175-TGL) later. All results are shown as mean ± SEM and respectively shown as mean ± SEM of the area (pixels) or distance/time (μm/h of 10 pictures/duplicates) covered by migrated cells. For (A, B, E, F, G, H; I, J, M) experiments were performed at least twice as duplicates and pooled results of two or three experiments are shown. For (C, D, K, L) experiments were performed as triplicates and representative experiments are shown. CAFs = cancer associated fibroblasts; MEFs = murine embryo fibroblasts; SEM = standard error of mean. *P ≤ 0.05; **P ≤ 0.01; ***P ≤ 0.001
Fig. 4
Fig. 4
miR-214 is transferred from stroma to tumor cells. A-D miR-214 and miR-223 expression levels in Extracellular Vesicles (EVs) derived from miR-214over and miR-214wt MEFs or from HS5 were previously transduced with a miR-214sponge (miR-214sponge) or an empty (control) expressing vector, measured by qRT-PCR analysis. EF miR-214 expression levels in B16-F10 and MA-2 cells pretreated for 24 h with EVs derived from miR-214over or miR-214wt MEFs or from miR-214 sponged HS5 (miR-214sponge) or empty controls (control), measured by qRT-PCR analysis. A-F Results are shown as fold changes (mean ± SD of triplicates) relative to controls, normalized on U6. At least 2 independent experiments (with triplicates) were performed and representative results are shown. G-H Expression levels of TFAP2C, ALCAM and ITGA5 in B16-F10 (G) and MA-2 (H) cells pretreated for 24/48 h with EVs derived from miR-214over and miR-214wt MEFs (G) or from HS5 (H) miR-214sponged HS5 (miR-214sponge) or empty controls (control), measured by Western Blot analysis. Protein modulations were calculated relative to controls, normalized on the loading control and expressed as percentages. MEFs = murine embryo fibroblasts; SEM = standard error of mean. SD = standard deviation. *P ≤ 0.05; **P ≤ 0.01; ***P ≤ 0.001
Fig. 5
Fig. 5
Ablation of miR-214 in stroma cells inhibits metastasis formation of melanoma and breast cancer cells. A-B In vivo tumor growth and metastatic dissemination of B16-F10 (A) and EO771 (B) cells injected subcutaneously in miR-214wt and miR-214ko syngeneic mice, respectively 45 or 30 days post-inoculation. In (A) tumors were removed 15 days post-injection. Relative primary tumor weight (measured in grams) and number of Circulating Tumor Cells (CTCs) is shown in the graphs as mean ± SEM, for the indicated number of mice (n). C-D miR-214 expression levels assessed in B16-F10- and EO771-derived xenografts grown in miR-214wt and miR-214ko mice by qRT-PCR analysis for the indicated number (n) of animals. E GFP+ B16-F10 cells were subcutaneously injected into miR-214wt and miR-214ko syngenic mice to generate tumors. 15 days later, mice were sacrificed, transplants dissected and tumor/stroma cells separated by FACS sorting. miR-214 expression levels were measured in GFP+ B16-F10 cells before injection (culture) or FACS sorted from subcutaneous tumors (sorted) by qRT-PCR analysis, for the indicated number (n) of animals. C-E Results are shown as fold changes (mean ± SD of triplicates) relative to the median, normalized on U6. E Results are pools of 3 animals per group. n = number of mice. SD = standard deviation. SEM = standard error of mean. *P ≤ 0.05; **P ≤ 0.01; ***P ≤ 0.001
Fig. 6
Fig. 6
miR-214-rich Extracellular Vesicles (EVs) promote melanoma cell dissemination. A Analyses of experimental lung metastasis formation 8 days after tail vein injection of B16-F10 cells into miR-214over and miR-214ko syngeneic mice. Representative pictures of the whole lungs are shown (a, b; scale bar: 2 mm); arrows indicate metastasis formation. Relative lung metastases between the two groups of animals is presented in the graph for the indicated number (n) of mice. B CMRA-labeled B16-F10 cells (red) were pretreated for 24 h with EVs derived from miR-214over or miR-214ko CAFs and then injected into the tail vein of miR-214ko syngeneic mice for the evaluation of extravasation 2 h (a, b, c) or 48 h (d, e, f) later. Alternatively (C), extravasation was similarly evaluated for the same CMRA-labeled B16-F10 cells (red) injected into the tail vein of miR-214ko syngeneic mice in which EVs derived from miR-214over or miR-214ko CAFs were administered 24 h earlier. For (B-C) Representative fields of murine lung sections stained for CD31 (green) to highlight blood vessels and counterstained with DAPI (blue) are shown in (a, d); scale bar: 25 µm. Representative pictures of whole lungs containing red-labeled B16-F10 cells are shown in (b, c, e, f); scale bar: 1 mm; arrows indicate extravasated cells. Relative extravasated cells in the whole lungs at 48 h is shown in the graph for the indicated number (n) of mice, as mean ± SEM. D Analyses of experimental lung metastasis formation 8 days after tail vein injection of B16-F10 cells into miR-214ko syngeneic mice in which EVs derived from miR-214wt or miR-214over or miR-214.ko CAFs were systemically administered 24 h earlier. Representative pictures of the whole lungs are shown (a, b, c); scale bar: 2 mm; arrows indicate metastasis formations. Relative lung metastases between the three groups of animals are presented in the graphs for the indicated number (n) of mice. CAFs = cancer associated fibroblasts; CD31 = cluster of differentiation 31; n = number of mice; DAPI = 4’, 6-diamidino-2-fenylindole; SEM = standard error of mean. *P ≤ 0.05; **P ≤ 0.01; ***P ≤ 0.001
Fig. 7
Fig. 7
Tumor cells influence miR-214 expression in stroma cells. A miR-214 expression levels assessed by qRT-PCR analysis in Stat3wt or Stat3.ko MEFs, treated with IL-6 for 6 h. B miR-214 expression levels evaluated by qRT-PCR analysis in NIH3T3 or CAFs or HS5 cells following pretreatment with B16-F10 or MA-2 Conditioned Medium (CM) or left untreated (NT) for 6 h. C-D miR-214 expression assessed by qRT-PCR analysis in CAFs treated for 6 h with B16-F10 EV-depleted Conditioned Medium (CM) in presence of 50 μg/ml of anti-IL-6R Ab (C) or 10 μg/ml of anti-IL-6 Ab (D) or control IgG. E Significant positive correlations between miR-214 expression and different IL-6 and Stat3-related signatures in TCGA-SKCM (top) or TCGA-BRCA (bottom) datasets. Samples are presented in plots and heatmaps (Red = positive; white/blue = negative; grey = no correlation). Non-significant relationships: p-value > 0.05. AZARE_sig [32]; DAUER_sig [33]; IL-6_sig [34, 45] M5897; ALVAREZ_sig [35]; TH_sig [36]; Stat3_sig_up [37]; Jak/Stat [34, 45] M11564; Stat3_sig_down [36]. For (A-D) results are presented as fold changes (mean ± SD of triplicates) relative to controls, normalized on U6. At least 2 independent experiments (with triplicates) were performed and either representative results (A, C) or pools of all results (B, D) are shown. SD = standard deviation; Ab = antibody. *P ≤ 0.05; **P ≤ 0.01; ***P ≤ 0.001
Fig. 8
Fig. 8
miR-214 in tumor-stroma cell interactions. Scheme illustrating miR-214-mediated crosstalk between tumor and stroma cells coordinating tumor dissemination

References

    1. Siegel RL, Miller KD, Fuchs HE, Jemal A. Cancer Statistics, 2021. CA Cancer J Clin. 2021;71(1):7–33. doi: 10.3322/caac.21654. - DOI - PubMed
    1. Virga F, Quirico L, Cucinelli S, Mazzone M, Taverna D, Orso F. MicroRNA-Mediated Metabolic Shaping of the Tumor Microenvironment. Cancers (Basel). 2021;13(1):127. 10.3390/cancers13010127. - PMC - PubMed
    1. Fares J, Fares MY, Khachfe HH, Salhab HA, Fares Y. Molecular principles of metastasis: a hallmark of cancer revisited. Signal Transduct Target Ther. 2020;5(1):28. doi: 10.1038/s41392-020-0134-x. - DOI - PMC - PubMed
    1. Bejarano L, Jordao MJC, Joyce JA. Therapeutic Targeting of the Tumor Microenvironment. Cancer Discov. 2021;11(4):933–959. doi: 10.1158/2159-8290.CD-20-1808. - DOI - PubMed
    1. Sahai E, Astsaturov I, Cukierman E, DeNardo DG, Egeblad M, Evans RM, et al. A framework for advancing our understanding of cancer-associated fibroblasts. Nat Rev Cancer. 2020;20(3):174–186. doi: 10.1038/s41568-019-0238-1. - DOI - PMC - PubMed