. 2023 Jan 18;43(3):501-521.
doi: 10.1523/JNEUROSCI.0680-22.2022. Epub 2022 Dec 7.

Neuronopathic GBA1L444P Mutation Accelerates Glucosylsphingosine Levels and Formation of Hippocampal Alpha-Synuclein Inclusions

Affiliations

Neuronopathic GBA1L444P Mutation Accelerates Glucosylsphingosine Levels and Formation of Hippocampal Alpha-Synuclein Inclusions

Casey L Mahoney-Crane et al. J Neurosci. .

Abstract

The most common genetic risk factor for Parkinson's disease (PD) is heterozygous mutations GBA1, which encodes for the lysosomal enzyme, glucocerebrosidase. Reduced glucocerebrosidase activity associates with an accumulation of abnormal α-synuclein (α-syn) called Lewy pathology, which characterizes PD. PD patients heterozygous for the neuronotypic GBA1L444P mutation (GBA1+/L444P) have a 5.6-fold increased risk of cognitive impairments. In this study, we used GBA1+/L444P mice of either sex to determine its effects on lipid metabolism, expression of synaptic proteins, behavior, and α-syn inclusion formation. At 3 months of age, GBA1+/L444P mice demonstrated impaired contextual fear conditioning, and increased motor activity. Hippocampal levels of vGLUT1 were selectively reduced in GBA1+/L444P mice. We show, using mass spectrometry, that GBA1L444P expression increased levels of glucosylsphingosine, but not glucosylceramide, in the brains and serum of GBA1+/L444P mice. Templated induction of α-syn pathology in mice showed an increase in α-syn inclusion formation in the hippocampus of GBA1+/L444P mice compared with GBA1+/+ mice, but not in the cortex, or substantia nigra pars compacta. Pathologic α-syn reduced SNc dopamine neurons by 50% in both GBA1+/+ and GBA1+/L444P mice. Treatment with a GlcCer synthase inhibitor did not affect abundance of α-syn inclusions in the hippocampus or rescue dopamine neuron loss. Overall, these data suggest the importance of evaluating the contribution of elevated glucosylsphingosine to PD phenotypes. Further, our data suggest that expression of neuronotypic GBA1L444P may cause defects in the hippocampus, which may be a mechanism by which cognitive decline is more prevalent in individuals with GBA1-PD.SIGNIFICANCE STATEMENT Parkinson's disease (PD) and dementia with Lewy bodies (DLB) are both pathologically characterized by abnormal α-synuclein (α-syn). Mutant GBA1 is a risk factor for both PD and DLB. Our data show the expression of neuronotypic GBA1L444P impairs behaviors related to hippocampal function, reduces expression of a hippocampal excitatory synaptic protein, and that the hippocampus is more susceptible to α-syn inclusion formation. Further, our data strengthen support for the importance of evaluating the contribution of glucosylsphingosine to PD phenotypes. These outcomes suggest potential mechanisms by which GBA1L444P contributes to the cognitive symptoms clinically observed in PD and DLB. Our findings also highlight the importance of glucosylsphingosine as a relevant biomarker for future therapeutics.

Keywords: Parkinson's disease; glucocerebrosidase; glucosylceramide; glucosylsphingosine; venglustat; α-synuclein.


Figures

Figure 1.
Figure 1.
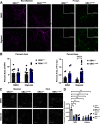
Primary hippocampal neurons from GBA1+/L444P mice show increased α-syn inclusions 14 d after exposure to fibrils and eliglustat, and reduced lysosome activity compared with GBA1+/+ mice. A, Representative images of neurofilament-H (magenta, left) and p-α-syn (green, right) in hippocampal primary cultures at DIV21. There were also no differences at DIV14 (Extended Data Fig. 1-1). Top row of panels shows neurons treated with equivalent volumes of DMSO as eliglustat (100 nm, bottom row of panels). GlcCer levels were reduced with 100 nm of eliglustat treatment (Extended Data Fig. 1-2). Scale bars: 100 µm; zoom, 50 µm. B, Quantification of the percent area of NF (left; nested two-way ANOVA; Interaction: Time × genotype: F(1,49) = 1.365, p = 0.2484, Drug treatment: F(1,49) = 0.03061, p = 0.8618, Genotype: F(1,49) = 1.004, p = 0.3212) and p-α-syn (right, nested two-way ANOVA; Time × genotype: F(1,48) = 1.838, p = 0.1815, Drug treatment: F(1,48) = 0.8887, p = 0.3506, Genotype: F(1,48) = 20.29, ****p < 0.0001, N = 9 for GBA1+/+ and GBA1+/L444P DMSO-treated neuron groups, N = 15 GBA1+/+ eliglustat-treated neurons, N = 20 GBA1+/L444P eliglustat-treated neurons). One GBA1+/+ DMSO and one GBA1+/L444P DMSO outlier were removed for both NF and p-α-syn analysis based on Grubbs' test. Internalization of fibrils or α-syn expression was not altered by eliglustat treatment (Extended Data Figs. 1-3, 1-4). α-Syn expression was not changed at DIV7 or DIV21 (Extended Data Fig. 1-4). C, Representative images for DQ-BSA assay showing DQ Red BSA (visualized in black and white). Top row of panels shows neurons treated with equivalent volumes of DMSO as eliglustat (100 nm, bottom row of panels) between GBA1+/+ and GBA1+/L444P primary hippocampal neurons. D, Quantification of background corrected total cell fluorescence (three-way ANOVA; interaction: F(1,18) = 3.621, p = 0.0732, Drug treatment × α-syn treatment: F(1,18) = 7.092, *p = 0.0158, Drug treatment × genotype: F(1,18) = 9.580, **p = 0.0062, α-syn treatment × genotype: F(1,18) = 2.512, p = 0.1304, Drug treatment: F(1,18) = 10.41, **p = 0.0047, α-syn treatment: F(1,18) = 1.966, p = 0.1778, Genotype: F(1,18) = 6.234, *p = 0.0225; N = 3 for GBA1+/+ monomer DMSO and eliglustat-treated neuron groups, N = 2 for GBA1+/L444P monomer DMSO and eliglustat-treated neuron groups, N = 4 for GBA1+/+ and GBA1+/L444P fibril DMSO and eliglustat-treated neurons groups). Eliglustat increased CatB activity only in GBA1+/L444P hippocampal neurons (Extended Data Fig. 1-5). For all graphs, error bars indicate SEM. Scale bar, 100 µm. *p < 0.05. **p < 0.01. ***p < 0.001. ****p < 0.0001.
Figure 2.
Figure 2.
Brain homogenates from GBA1+/L444P mice showed reduced GCase activity and selective reduction of vGLUT1 compared with GBA1+/+mice. A, GCase activity assay to evaluate enzymatic activity of GCase in 2-month-old GBA1+/L444P mice in the cortex (independent t test: t(10) = 7.406, ****p < 0.0001), striatum (t(10) = 3.023, *p = 0.0128), hippocampus (t(10) = 6.870, ****p < 0.0001), and the midbrain (t(10) = 4.593; ***p < 0.0010) expressed as nm 4-MU/mg protein. N = 6 for all groups. B, Representative immunoblot analyses of hippocampal brain lysates for GCase, endogenous total α-syn, p-α-syn, Homer1, TUJ1, SNAP25, VAMP2, and syntaxin-1 expression. C, Quantitation of immunoblots; vinculin was used as the loading control to normalize expression. Independent t test for GCase (t(4) = 1.093, p = 0.3360, N = 3 for both groups, one GBA1+/+ outlier removed) and Mann–Whitney U test for endogenous total α-syn (W = 4, p = 0.9999, N = 3 for both groups). An independent t test was used for p-α-syn (t(9) = 2.808; *p = 0.0205, N = 6 GBA1+/+ and N = 5 GBA1+/L444P). D, Analysis of vGLUT1 (independent t test: t(5) = 6.686; **p = 0.0011, N = 4 GBA1+/+ and N = 3 GBA1+/L444P, one GBA1+/+ outlier removed based on Grubbs' test), Homer1 (t(4) = 1.481; p = 0.2127, N = 3 both groups), and TUJ1 (t(9) = 0.05656, p = 0.9561, N = 6 GBA1+/+ and N = 5 GBA1+/L444P) expression. E, Analysis of SNAP25 (independent t test: t(5) = 0005117, p = 0.9996, N = 4 GBA1+/+ and N = 3 GBA1+/L444P), VAMP2 (t(4) = 1.433, p = 0.2251, N = 3 in both groups, one GBA1+/+ outlier removed), and syntaxin-1a (t(6) = 0.3713, p = 0.7232, N = 5 GBA1+/+ and N = 3 GBA1+/L444P) expression. All immunoblots were run with 3-6 individual mice. For all graphs, error bars indicate SEM. The total synuclein data failed the test for normality and graphed as a scatter plot without a bar using a Mann–Whitney test. *p < 0.05. **p < 0.01. ***p < 0.001. ****p < 0.0001.
Figure 3.
Figure 3.
Behavioral analysis of 3-month-old GBA1+/L444P mice compared with GBA1+/+ mice. A, Open field test analysis evaluating average velocity (independent t test: 2 GBA1+/+ outliers removed; t(10) = 2.002; p = 0.0732, N = 6 for both groups), percent in the center (one GBA1+/+ outlier removed; t(11) = 1.436, p = 0.1790, N = 6 GBA1+/+ N = 7 GBA1+/L444P), and distance traveled (one GBA1+/+ and GBA1+/L444P outlier removed; t(10) = 1.243, p = 0.2424, N = 5 GBA1+/+ N = 7 GBA1+/L444P). B, Pole test evaluated total descent time (one GBA1+/+ and GBA1+/L444P outlier removed: t(10) = 2.638, *p = 0.0248, N = 6 for both groups), turnaround time (t(12) = 0.2243, p = 0.8263, N = 7 for both groups), and time descending (one GBA1+/+ outlier removed; t(11) = 1.467; p = 0.1704, N = 6 GBA1+/+ N = 7 GBA1+/L444P). C, Fear conditioning analysis evaluated percent time spent freezing in training (repeated-measures two-way ANOVA: time: F(4,48) = 49.13, ****p < 0.0001, genotype: F(1,12) = 1.106, p = 0.3136, time × genotype: F(4,48) = 2.751, *p = 0.0386), cued fear conditioning (independent t test: t(12) = 2.069, p = 0.0608), and contextual fear conditioning (t(11) = 2.720, *p = 0.0199, one GBA1+/L444P outlier removed). N = 7 for both groups. For all graphs, error bars indicate SEM. *p < 0.05. ***p < 0.001. ****p < 0.0001.
Figure 4.
Figure 4.
Lipid analysis in GBA1+/+ and GBA1+/L444P mice. GBA1+/+ and GBA1+/L444P mice forebrains underwent mass spectrometry for lipid quantification for (A) GlcSph (two-way ANOVA; Interaction: F(3,50) = 2.270, p = 0.0918, Age: F(3,50) = 23.54, ****p < 0.0001, and Genotype: F(1,50) = 64.23, ****p < 0.0001) and (B) total GlcCer (Interaction: F(3,50) = 1.454, p = 0.2384, Age: F(3,50) = 3.340, *p = 0.0265, Genotype: F(1,50) = 2.493, p = 0.1206) at 3, 6, 9, and 12 months. C, Mice plasma was collected and underwent mass spectrometry for lipid quantification for C. GlcSph (independent t test, t(9) = 2.810, *p = 0.0204, N = 6 for GBA1+/+, and N = 5 GBA1+/L444P) and (D) GlcCer (t(10) = 1.015, p = 0.3338, N = 7 for GBA1+/+ and N = 5 GBA1+/L444P). Only GlcCer d18:1_18:0 isoform was reduced in aged GBA1+/+ mice with no changes between GBA1L444P expression (Extended Data Fig. 4-1). For all graphs, error bars indicate SEM. *p < 0.05. **p < 0.01. ***p < 0.001. ****p < 0.0001.
Figure 5.
Figure 5.
p-α-syn pathology burden is increased in the hippocampal formation. A, Ten months after bilateral striatal injections, IF for p-α-syn was performed. Representative images of GBA1+/+ and GBA1+/L444P fibril-injected mice fed control or venglustat chow of the dmPFC were captured using confocal microscopy. Venglustat chow reduced GlcCer (Extended Data Fig. 5-2). Scale bars: 100 μm; zoom, 50 μm. B, Quantification of p-α-syn in the dmPFC (N = 6 for both control chow groups, N = 4 for venglustat chow groups). Two-way ANOVA: Interaction: F(1,16) = 6.890, *p = 0.0184, Drug treatment: F(1,16) = 13.95, **p = 0.0018, Genotype: F(1,16) = 1.842, p = 0.1936. Error bars indicate SEM. Changes in p-α-syn inclusions in the PFC was not because of changes in cell quantity (Extended Data Fig. 5-3). C, Representative images of GBA1+/+ and GBA1+/L444P fibril-injected mice fed control or venglustat chow of the hippocampus were captured using confocal microscopy. Scale bars: 100 µm; zoomed, 50 µm. D, Quantification of p-α-syn in the granule cell layer of the dentate gyrus area of the hippocampus (N = 6 for both control chow groups, N = 4 for venglustat chow groups, two outliers removed (one GBA1+/+ and one GBA1+/L444P). Interaction: F(1,16) = 7.484, *p = 0.0147, Drug treatment: F(1,16) = 0.05575, p = 0.8163, Genotype: F(1,16) = 23.18, ***p = 0.0002. Quantification of CA1-CA3 pyramidal cell layer with control chow (N = 7 GBA1+/+ and N = 8 GBA1+/L444P: t test: CA1 pyramidal cell layer: t(11) = 2.580; *p = 0.0256, CA2-CA3 pyramidal cell layer: t(13) = 1.997; p = 0.0672). Error bars indicate SEM. E, Representative images of GBA1+/+ and GBA1+/L444P fibril-injected mice fed control or venglustat chow of the SNc were captured using confocal microscopy. Scale bars: 100 μm; zoom, 50 μm. F, Quantification of p-α-syn in the SNc (N = 7 for GBA1+/+ and N = 8 for GBA1+/L444P control chow groups, N = 4 for GBA1+/+ and GBA1+/L444P venglustat chow groups). Two-way ANOVA: Interaction: F(1,19) = 0.6662, p = 0.4245, Drug treatment: F(1,19) = 0.02359, p = 0.8795, Genotype: F(1,19) = 1.459, p = 0.2420. The entorhinal cortex and amygdala showed no changes in p-α-syn inclusions (Extended Data Fig. 5-1). Total α-syn expression was not changed between any brain regions (Extended Data Fig. 5-4). There were no changes in MHCII or IgG in the hippocampus (Extended Data Fig. 5-5). For all graphs, error bars indicate SEM. *p < 0.05. **p < 0.01. ***p < 0.001.
Figure 6.
Figure 6.
Quantification of dopaminergic neuron cell death. IHC for TH was performed in GBA1+/+ and GBA1+/L444P mice at 10 months after injection, and the SNc was analyzed for dopaminergic cell death using unbiased stereology. A, Representative images of monomer and fibril-injected GBA1+/+ and GBA1+/L444P mice fed control chow (N = 7 for all groups). B, Representative images of monomer and fibril-injected GBA1+/+ and GBA1+/L444P mice fed venglustat chow (N = 4 for all groups). C, Unbiased stereology was used to estimate TH+ cell count (three-way ANOVA: Interaction: F(1,34) = 0.06097, p = 0.8065, Drug treatment × α-syn treatment: F(1,34) = 0.2240, p = 0.6390, Drug treatment × genotype: F(1,34) = 0.06160, p = 0.8055, α-syn treatment × genotype: F(1,34) = 0.0002467, p = 0.9876, Drug treatment: F(1,34) = 4.451, *p = 0.0423, α-syn treatment: F(1,34) = 36.68, ****p < 0.0001, Genotype: F(1,34) = 2.122, p = 0.1544). Error bars indicate SEM. Scale bar, 200 μm. *p < 0.05.
Figure 7.
Figure 7.
Behavioral analyses of monomer and fibril-injected mice fed venglustat or control chow. GBA1+/+ and GBA1+/L444P mice underwent behavioral test to evaluate motor and cognitive function 7 months after fibril or monomer injection and venglustat or control treatment. A, Quantification of mouse survival using a Kaplan–Meier survival curve (log-rank (Mantel–Cox) test: after monomer injection: χ2 (3, N = 57) = 8.722, *p = 0.0332, after fibril injection: χ2 (3, N = 42) = 0.6481, p = 0.8853). B, Open field test analysis evaluating the total distance traveled (three-way ANOVA: Interaction: F(1,66) = 1.655, p = 0.2028, Drug treatment × α-syn treatment: F(1,66) = 1.201, p = 0.2771, Drug treatment × genotype: F(1,66) = 0.01696, p = 0.8968, α-syn treatment × genotype: F(1,66) = 0.2655, p = 0.6081, Drug treatment: F(1,66) = 2.578, p = 0.1131, α-syn treatment: F(1,66) = 2.965, p = 0.0898, Genotype: F(1,66) = 1.084, p = 0.3016, Control: Monomer-injected GBA1+/+ N = 20, Monomer-injected GBA1+/L444P N = 16, Fibril-injected GBA1+/+ N = 10 (one outlier removed), Fibril-injected GBA1+/L444P N = 9. Venglustat: Monomer-injected GBA1+/+ N = 6, Monomer-injected GBA1+/L444P N = 5, and Fibril-injected GBA1+/+ and GBA1+/L444P N = 4), average velocity (Interaction: F(1,66) = 0.02006, p = 0.8878, Drug treatment × α-syn treatment: F(1,66) = 0.7082, p = 0.4031, Drug treatment × genotype: F(1,66) = 0.3206, p = 0.5732, α-syn treatment × genotype: F(1,66) = 0.6204, p = 0.4337, Drug treatment: F(1,66) = 5.121, *p = 0.0269, α-syn treatment: F(1,66) = 0.5298, p = 0.4693, Genotype: F(1,66) = 0.05453, p = 0.8161, Control: Monomer-injected GBA1+/+ N = 20, Monomer-injected GBA1+/L444P N = 16 (two outliers removed), Fibril-injected GBA1+/+ and GBA1+/L444P N = 10. Venglustat: Monomer-injected GBA1+/+ N = 7, Monomer-injected GBA1+/L444P N = 4, Fibril-injected GBA1+/+ and GBA1+/L444P N = 4), and the percent time in the center (Interaction: F(1,70) = 0.5531, p = 0.4596, Drug treatment × α-syn treatment: F(1,70) = 0.0002562, p = 0.9873, Drug treatment × genotype: F(1,70) = 1.246, p = 0.2681, α-syn treatment × genotype: F(1,70) = 1.774, p = 0.1872, Drug treatment: F(1,70) = 5.160, *p = 0.0262, α-syn treatment: F(1,70) = 0.5955, p = 0.4429, Genotype: F(1,70) = 1.535, p = 0.2195, Control: Monomer-injected GBA1+/+ N = 20, Monomer-injected GBA1+/L444P N = 22 (one outlier removed), Fibril-injected GBA1+/+ N = 10 (one outlier removed), Fibril-injected GBA1+/L444P N = 8 (two outliers removed). Venglustat: Monomer-injected GBA1+/+ N = 6, Monomer-injected GBA1+/L444P N = 5, Fibril-injected GBA1+/+ N = 3 (one outlier removed), Fibril-injected GBA1+/L444P N = 4). C, Mice underwent pole test to evaluate motor deficits by analyzing the time descending (three-way ANOVA: Interaction: F(1,62) = 0.2636, p = 0.6095, Drug treatment × α-syn treatment: F(1,62) = 0.4947, p = 0.4845, Drug treatment × genotype: F(1,62) = 0.3006, p = 0.5855, α-syn treatment × genotype: F(1,62) = 0.3767, p = 0.5416, Drug treatment: F(1,62) = 0.2163, p = 0.6435, α-syn treatment: F(1,62) = 4.483, *p = 0.0382, Genotype: F(1,62) = 4.874, *p = 0.0310, Control: Monomer-injected GBA1+/+ N = 17, Monomer-injected GBA1+/L444P N = 15, Fibril-injected GBA1+/+ N = 9, Fibril-injected GBA1+/L444P N =10. Venglustat: Monomer-injected GBA1+/+ N = 6, Monomer-injected GBA1+/L444P N =5, Fibril-injected GBA1+/+ and GBA1+/L444P N = 4), turnaround time (Interaction: F(1,69) = 2.500, p = 0.1184, Drug treatment × α-syn treatment: F(1,69) = 0.8307, p = 0.3652, Drug treatment × genotype: F(1,69) = 2.814, p = 0.0980, α-syn treatment × genotype: F(1,69) = 0.4537, p = 0.5028, Drug treatment: F(1,69) = 6.223, *p = 0.0150, α-syn treatment: F(1,69) = 5.396, *p = 0.0231, Genotype: F(1,69) = 0.1263, p = 0.7234; Control: Monomer-injected GBA1+/+ N = 18, Monomer-injected GBA1+/L444P N = 18, Fibril-injected GBA1+/+ N = 10, Fibril-injected GBA1+/L444P N =12. Venglustat: Monomer-injected GBA1+/+ N = 6, Monomer-injected GBA1+/L444P N = 5, Fibril-injected GBA1+/+ and GBA1+/L444P N = 4), and total descent time (Interaction: F(1,62) = 0.003431, p = 0.9535, Drug treatment × α-syn treatment: F(1,62) = 0.8643, p = 0.3561, Drug treatment × genotype: F(1,62) = 0.09758, p = 0.7558, α-syn treatment × genotype: F(1,62) = 0.7574, p = 0.3875, Drug treatment: F(1,62) = 3.983, p = 0.0504, α-syn treatment: F(1,62) = 4.805, *p = 0.0321, Genotype: F(1,62) = 2.267, p = 0.1372; Control: Monomer-injected GBA1+/+ N = 17, Monomer-injected GBA1+/L444P N = 15, Fibril-injected GBA1+/+ N = 8, Fibril-injected GBA1+/L444P N = 11. Venglustat: Monomer-injected GBA1+/+ N = 6, Monomer-injected GBA1+/L444P N = 5, Fibril-injected GBA1+/+ and GBA1+/L444P N = 4). D, Quantification of the training phase of fear conditioning for monomer or fibril-injected GBA1+/+ or GBA1+/L444P mice fed control chow (repeated-measures three-way ANOVA: Interaction: F(4240) = 0.6830, p = 0.6044, Time × α-syn treatment: F(4240) = 4.425, **p = 0.0018, Time × genotype: F(4240) = 0.0877, p = 0.9862, α-syn treatment × genotype: F(1,60) = 0.6170, p = 0.4353, Time: F(4240) = 120.1, ****p < 0.0001, α-syn treatment: F(1,60) = 2.12, p = 0.1506, Genotype: F(1,60) = 0.4373, p = 0.5110, GBA1+/+ Monomer N = 21, GBA1+/L444P Monomer N = 19, GBA1+/+ fibril N = 10, GBA1+/L444P fibril N = 13) and venglustat chow (Interaction: F(4,64) = 0.5828, p = 0.6762, Time × α-syn treatment: F(4,64)= 0.5808, p = 0.6776, Time × genotype: F(4,64)= 0.8026, p = 0.5280, α-syn treatment × genotype: F(1,16) = 0.1628, p = 0.6919, Time: F(2.882,46.11) = 25.40, ****p < 0.0001, α-syn treatment: F(1,16) = 0.006116, p = 0.9386, Genotype: F(1,16) = 1.846, p = 0.1931, GBA1+/+ Monomer N = 7, GBA1+/L444P Monomer N = 6, GBA1+/+ fibril N = 4, GBA1+/L444P fibril N = 4). E, Quantification of cued (three-way ANOVA: Interaction: F(1,76) = 0.03063, p = 0.8615, Drug treatment × α-syn treatment: F(1,76) = 1.378, p = 0.2441, Drug treatment × genotype: F(1,76) = 1.865, p = 0.1761, α-syn treatment × genotype: F(1,76) = 0.6219, p = 0.4328, Drug treatment: F(1,76) = 1.757, p = 0.1890, α-syn treatment: F(1,76) = 5.703, *p = 0.0194, Genotype: F(1,76) = 1.960, p = 0.1656). Control: GBA1+/+ Monomer N = 22, GBA1+/L444P Monomer N = 19, GBA1+/+ fibril N = 9 (one outlier removed), GBA1+/L444P fibril N = 14, Venglustat: GBA1+/+ Monomer N = 6, GBA1+/L444P Monomer N = 4, GBA1+/+ fibril N = 4, GBA1+/L444P fibril N = 4), and contextual fear conditioning for all mice groups. Contextual fear conditioning analysis was analyzed by evaluating the first 60 s (Interaction: F(1,76) = 0.07405, p = 0.7863, Drug treatment × α-syn treatment: F(1,76) = 0.07986, p = 0.7783, Drug treatment × genotype: F(1,76) = 0.3424, p = 0.5602, α-syn treatment × genotype: F(1,76) = 0.2234, p = 0.6378, Drug treatment: F(1,76) = 0.0002150, p = 0.9883, α-syn treatment: F(1,76) = 1.850, p = 0.1778, Genotype: F(1,76) = 3.979, *p = 0.0497), Control: GBA1+/+ Monomer N = 18, GBA1+/L444P Monomer N = 19, GBA1+/+ fibril N = 9 (one outlier removed), GBA1+/L444P fibril N = 13, Venglustat: GBA1+/+ Monomer N = 7, GBA1+/L444P Monomer N = 5, GBA1+/+ fibril N = 4, GBA1+/L444P fibril N = 4). Error bars indicate SEM. *p < 0.05. **p < 0.01. ****p < 0.0001.

References

    1. Alcalay RN, et al. . (2010) Self-report of cognitive impairment and mini-mental state examination performance in PRKN, LRRK2, and GBA carriers with early onset Parkinson's disease. J Clin Exp Neuropsychol 32:775–779. 10.1080/13803390903521018 - DOI - PMC - PubMed
    1. Alcalay RN, et al. . (2012) Cognitive performance of GBA mutation carriers with early-onset PD: the CORE-PD study. Neurology 78:1434–1440. 10.1212/WNL.0b013e318253d54b - DOI - PMC - PubMed
    1. Arrant AE, Roth JR, Boyle NR, Kashyap SN, Hoffmann MQ, Murchison CF, Ramos EM, Nana AL, Spina S, Grinberg LT, Miller BL, Seeley WW, Roberson ED (2019) Impaired β-glucocerebrosidase activity and processing in frontotemporal dementia due to progranulin mutations. Acta Neuropathol Commun 7:17. 10.1186/s40478-019-0872-6 - DOI - PMC - PubMed
    1. Belmatoug N, Camou F, Serratrice C, Serratrice J, Brassier A, Rose C, Villemeur T (2017) A review of Gaucher disease pathophysiology, clinical presentation and treatments. Int J Mol Sci 18:1–30. - PMC - PubMed
    1. Bennett LL, Turcotte K (2015) Eliglustat tartrate for the treatment of adults with type 1 Gaucher disease. Drug Des Devel Ther 9:4639–4647. 10.2147/DDDT.S77760 - DOI - PMC - PubMed

Publication types