. 2023 Jan 25;43(4):601-612.
doi: 10.1523/JNEUROSCI.0731-22.2022. Epub 2022 Dec 9.

Expression of a Form of Cerebellar Motor Memory Requires Learned Alterations to the Activity of Inhibitory Molecular Layer Interneurons

Affiliations

Expression of a Form of Cerebellar Motor Memory Requires Learned Alterations to the Activity of Inhibitory Molecular Layer Interneurons

Audrey Bonnan et al. J Neurosci. .

Abstract

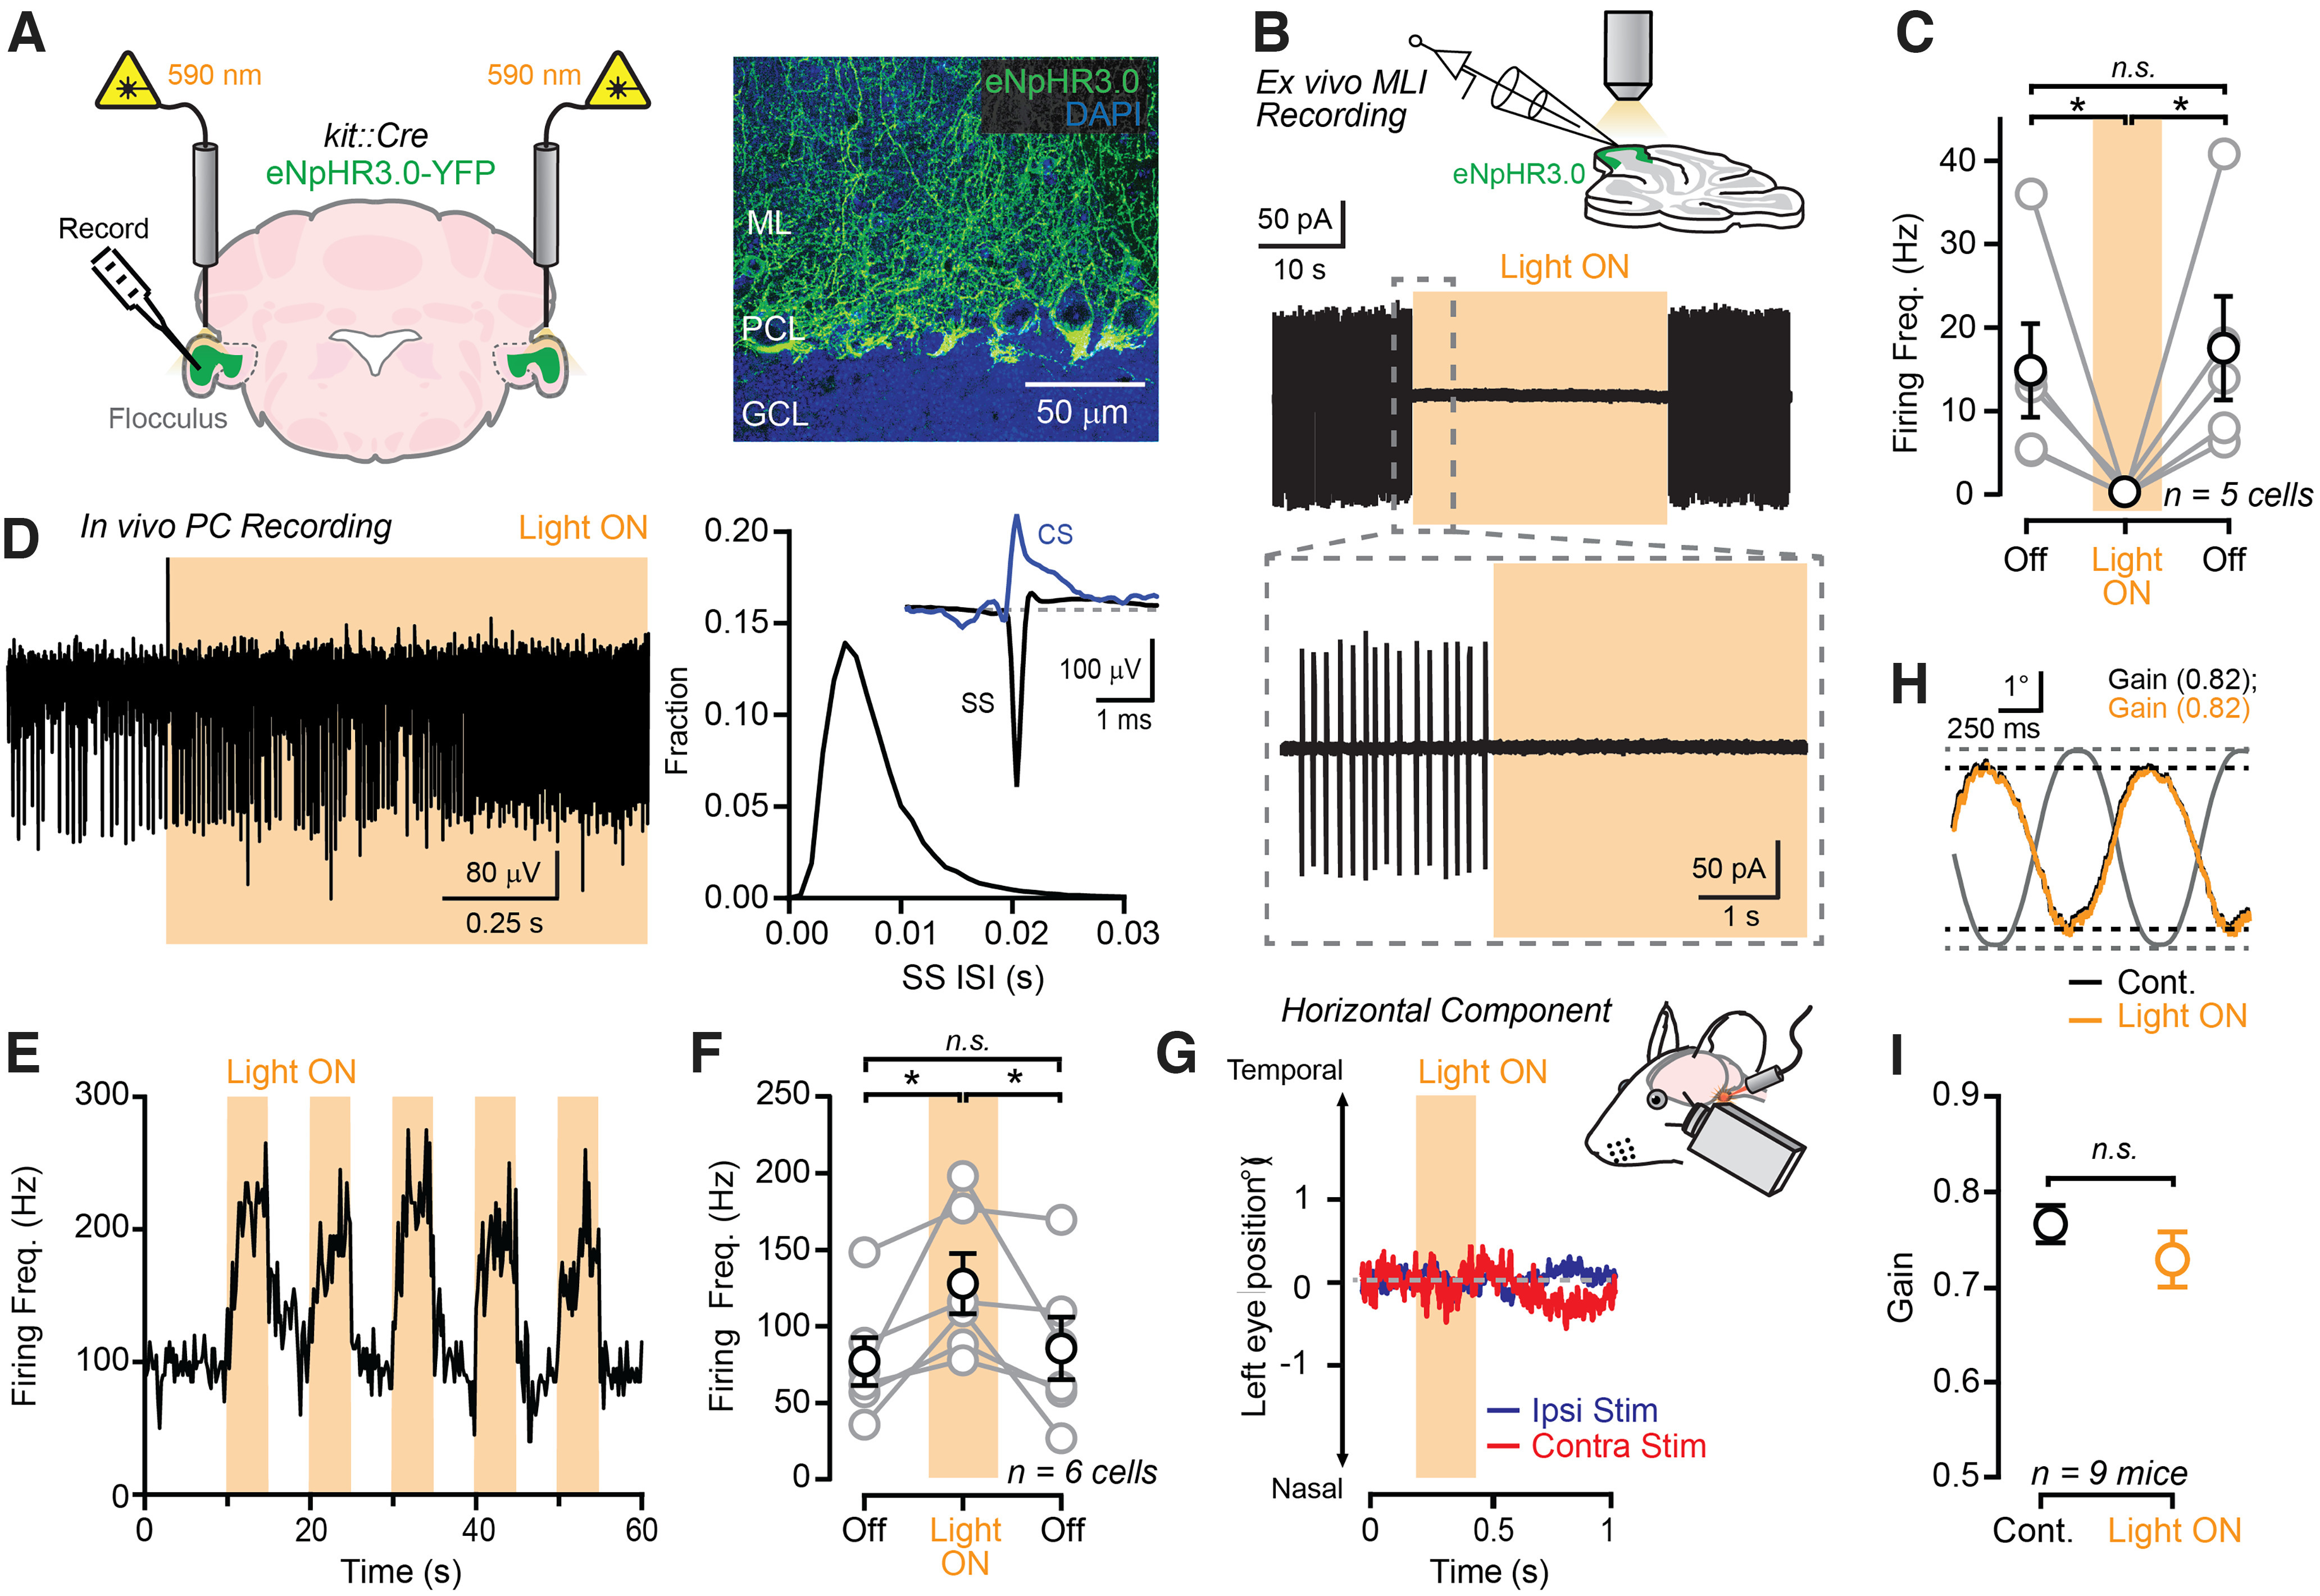
Procedural memories formed in the cerebellum in response to motor errors depend on changes to Purkinje cell (PC) spiking patterns that correct movement when the erroneous context is repeated. Because molecular layer interneurons (MLIs) inhibit PCs, learning-induced changes to MLI output may participate in reshaping PC spiking patterns. However, it remains unclear whether error-driven learning alters MLI activity and whether such changes are necessary for the memory engram. We addressed this knowledge gap by measuring and manipulating MLI activity in the flocculus of both sexes of mice before and after vestibulo-ocular reflex (VOR) adaptation. We found that MLIs are activated during vestibular stimuli and that their population response exhibits a phase shift after the instantiation of gain-increase VOR adaptation, a type of error-driven learning thought to require climbing-fiber-mediated instructive signaling. Although acute optogenetic suppression of MLI activity did not affect baseline VOR performance, it negated the expression of gain-increase learning, demonstrating a specific role of MLI activity changes in motor memory expression. This effect was transitory; after a multiday consolidation period, the expression of VOR gain-increase learning was no longer sensitive to MLI activity suppression. Together, our results indicate that error-driven alteration of MLI activity is necessary for labile, climbing-fiber-induced motor memory expression.SIGNIFICANCE STATEMENT In the cerebellum, motor learning induces an associative memory of the sensorimotor context of an erroneous movement that, when recalled, results in a new pattern of output that improves subsequent trials of performance. Our study shows that error-driven motor learning induces changes to the activity pattern of cerebellar molecular layer interneurons (MLIs) and that this new pattern of activity is required to express the corrective motor memory.

Keywords: Purkinje cells; learning; memory; plasticity.


Figures

Figure 1.
Figure 1.
Optogenetic MLI activation evokes eye movement. A, Mice expressing ChR2 in MLIs were bilaterally implanted with optical fibers targeting both flocculi. B, Vector plot of the average direction and amplitude of left eye movements evoked by photostimulation of MLIs in the left (ipsiversive) or right (contraversive) flocculus at different laser powers (λ473 nm, 240 ms; n = 3 mice). C, Decomposed horizontal eye movements from a quiescent mouse in response to unilateral floccular photostimulation of ChR2-expressing MLIs (10 mW). D, For photometry, bulk GCaMP6f fluorescence was collected through an implanted optical fiber targeting the left flocculus as the VOR was passively elicited by sinusoidal vestibular stimulation (1 Hz) in darkness. GCaMP6f-expressing MLIs transduced using a Cre-dependent AAV are shown in the image with the approximate location of the optical fiber also indicated. E, Top, Trial-averaged VOR-evoked eye movements (black; head position in gray) in a GCaMP6f-expressing mouse. Bottom, Calcium activity measurements from MLIs (green) with interleaved isosbestic measurements (purple) during the same recording. F, The timing of peak calcium activity in the MLI population response relative to the phase of the vestibular stimulus for each mouse (each point represents an individual mouse; n = 6 mice total). The position along the radius corresponds to the peak amplitude of the calcium response.
Figure 2.
Figure 2.
MLI activity suppression does not affect baseline VOR performance. A, Light was delivered to eNpHR3.0-expressing MLIs using implanted optical fibers bilaterally targeting each flocculus. The image on the right shows YFP-tagged-eNpHR3.0 in MLIs from an example mouse. Molecular layer, ML; PC layer, PCL; granule cell layer, GCL. B, Effect of eNpHR3.0 photoactivation (λ594 nm; 30 s, 3 mW) on an MLI firing spontaneous spikes, measured in the cell-attached mode, in an acute cerebellar slice. C, Summary plot showing the suppressive effect of eNpHR3.0 photoactivation on MLI firing measured in acute slices (one-way ANOVA with Tukey's multiple comparisons test; before vs during, p = 0.0419, before vs after, p = 0.8521, during vs after, p = 0.0191). D, The simple spiking of a putative floccular PC recorded in an awake eNpHR3.0-expressing mouse to optogenetic suppression of MLI activity (λ594 nm; 34 mW). The distribution of simple spike interspike intervals for the same cell is shown on the right plot as well as averages of simple spikes (SS) and complex spikes (CS) in the inset. E, Same PC as in panel D, but across repeated trials of MLI photo-suppression (5 pulses at 0.1 Hz). F, Summary plot showing the effect of in vivo MLI activity suppression on the spontaneous firing of putative PCs measured in three separate recording sessions (one-way ANOVA with Tukey's multiple comparisons test; before vs during, p = 0.0002, before vs after, p = 0.9995, during vs after, p = 0.0004). G, Eye position measurements from a quiescent mouse as light pulses (λ590 nm, 240 ms, 8 mW) were delivered to the left (ipsiversive) or right (contraversive) flocculus to suppress MLI activity. H, Average VOR-evoked eye movements in a mouse in the control condition (black) or during the bilateral suppression of MLI activity (orange). Light was delivered continuously to both flocculi for 30 s (λ590 nm; 8 mW) while the head was passively rotated in darkness using sinusoidal vestibular stimuli (1 Hz; head position in gray). I, Comparison of the VOR gain (the size of the evoked eye movement relative to the size of the vestibular stimulus) in the control condition and during optogenetic MLI activity suppression; paired t test, p = 0.067. All data are shown mean ± SEM; asterisks denote p < 0.05; not significant, n.s.
Figure 3.
Figure 3.
MLI activity suppression impairs the expression of gain-increase VOR learning. A, Top, In a VOR training session, measurements were made in darkness of evoked eye movements, before and after pairing with a moving visual stimulus. During the pretraining and post-training periods, light was delivered to suppress MLI activity (“Light ON”; orange), alternating with a darkness-only measurement (“Cont.”; black). Middle, Trial-averaged VOR-evoked eye movements in a mouse before (pre) and after (post) training with opposite-direction visual-vestibular motion mismatches (1.5×; 60 min). The responses were obtained in the control condition (black) and during optogenetic suppression of floccular MLI activity (orange). The black dotted lines indicate the amplitude of the baseline VOR in the control condition before training. Changes in gain (Δ) are a comparison to the baseline condition in the absence of optogenetic stimulation. Bottom, Same mouse as above except for same-direction visual-vestibular motion mismatch training (0×; 60 min). B, Left plot, summary showing the effect of MLI activity suppression on the expression of gain-increase learning (control vs Light ON pre: p = 0.1315, control vs Light ON post: p < 0.0001; two-way ANOVA with Sidak's multiple comparisons). Right plot, the lack of effect of light delivery to mice expressing eYFP in MLIs before and after gain-increase training (control vs Light ON pre: p = 0.71, control vs Light ON post: p = 0.96; two-way ANOVA with Sidak's multiple comparisons). C, The effect of optogenetic MLI activity suppression on the expression of gain-decrease learning (control vs Light ON pre: p = 0.90, control vs Light ON post: p = 0.99; two-way ANOVA with Sidak's multiple comparisons). Data are presented as mean ± SEM; asterisk denotes p.
Figure 4.
Figure 4.
MLI population activity is restructured in response to gain-increase VOR learning. A, VOR-evoked eye movements and the simultaneously acquired population activity of MLIs, measured in the left flocculus of a GCaMP6f-expressing mouse using fiber-photometry, in trials before and after gain-increase learning. B, Summary plots showing the timing of peaks in the MLI population response, relative to the phase of the vestibular stimulus, in mice before (left) and after (right) gain-increase learning. Individual mice, represented as single points, are color coded. Note, one mouse (red) developed a second peak in calcium activity after learning. C, D, Same as panels A and B but for gain-decrease VOR learning. Color coding corresponds to the same mice in panel B.
Figure 5.
Figure 5.
Transient requirement for MLI activity in the expression of gain-increase VOR learning. A, Mice received five consecutive days of opposite-direction visual-vestibular-motion mismatch training. At the start and end of each session, the VOR was measured in the control condition and during optogenetic MLI activity suppression. Mice were held in a light-free environment between sessions. B, Trial-averaged VOR eye movements from the same mouse measured on different training days. Responses obtained in the control condition (black) and during MLI activity suppression (orange) are superimposed. Black dotted line indicates the amplitude of the baseline VOR response measured on the first day of training. Changes in gain (Δ) are a comparison to the initial baseline condition in the absence of optogenetic stimulation. C, Plot showing the effect of MLI activity suppression on the VOR gain for the progression of multiday gain-increase learning across mice. Statistics for control versus Light ON: Day1 Pre and Post, p = 0.9993 and p <0.0001, respectively; Day2 Pre and Post: p = 0.0073 and p = 0.0212, respectively; Day5 Pre and Post, p = 0.8411 and p = 0.0470, respectively; two-way ANOVA with Sidak's post comparisons. Data are presented as mean ± SEM; asterisks denote p.

Similar articles

Cited by

References

    1. Amat SB, Rowan MJM, Gaffield MA, Bonnan A, Kikuchi C, Taniguchi H, Christie JM (2017) Using c-kit to genetically target cerebellar molecular layer interneurons in adult mice. PLoS One 12:e0179347. 10.1371/journal.pone.0179347 - DOI - PMC - PubMed
    1. Anzai M, Kitazawa H, Nagao S (2010) Effects of reversible pharmacological shutdown of cerebellar flocculus on the memory of long-term horizontal vestibulo-ocular reflex adaptation in monkeys. Neurosci Res 68:191–198. 10.1016/j.neures.2010.07.2038 - DOI - PubMed
    1. Arenz A, Silver RA, Schaefer AT, Margrie TW (2008) The contribution of single synapses to sensory representation in vivo. Science 321:977–980. 10.1126/science.1158391 - DOI - PMC - PubMed
    1. Astorga G, Li D, Therreau L, Kassa M, Marty A, Llano I (2017) Concerted interneuron activity in the cerebellar molecular layer during rhythmic oromotor behaviors. J Neurosci 37:11455–11468. 10.1523/JNEUROSCI.1091-17.2017 - DOI - PMC - PubMed
    1. Badura A, Schonewille M, Voges K, Galliano E, Renier N, Gao Z, Witter L, Hoebeek FE, Chédotal A, De Zeeuw CI (2013) Climbing fiber input shapes reciprocity of Purkinje cell firing. Neuron 78:700–713. 10.1016/j.neuron.2013.03.018 - DOI - PubMed

Publication types

LinkOut - more resources