Review
. 2023 Jun;36(6):e4906.
doi: 10.1002/nbm.4906. Epub 2023 Feb 15.

CEST-MRI for body oncologic imaging: are we there yet?

Affiliations
Review

CEST-MRI for body oncologic imaging: are we there yet?

Elena Vinogradov et al. NMR Biomed. 2023 Jun.

Abstract

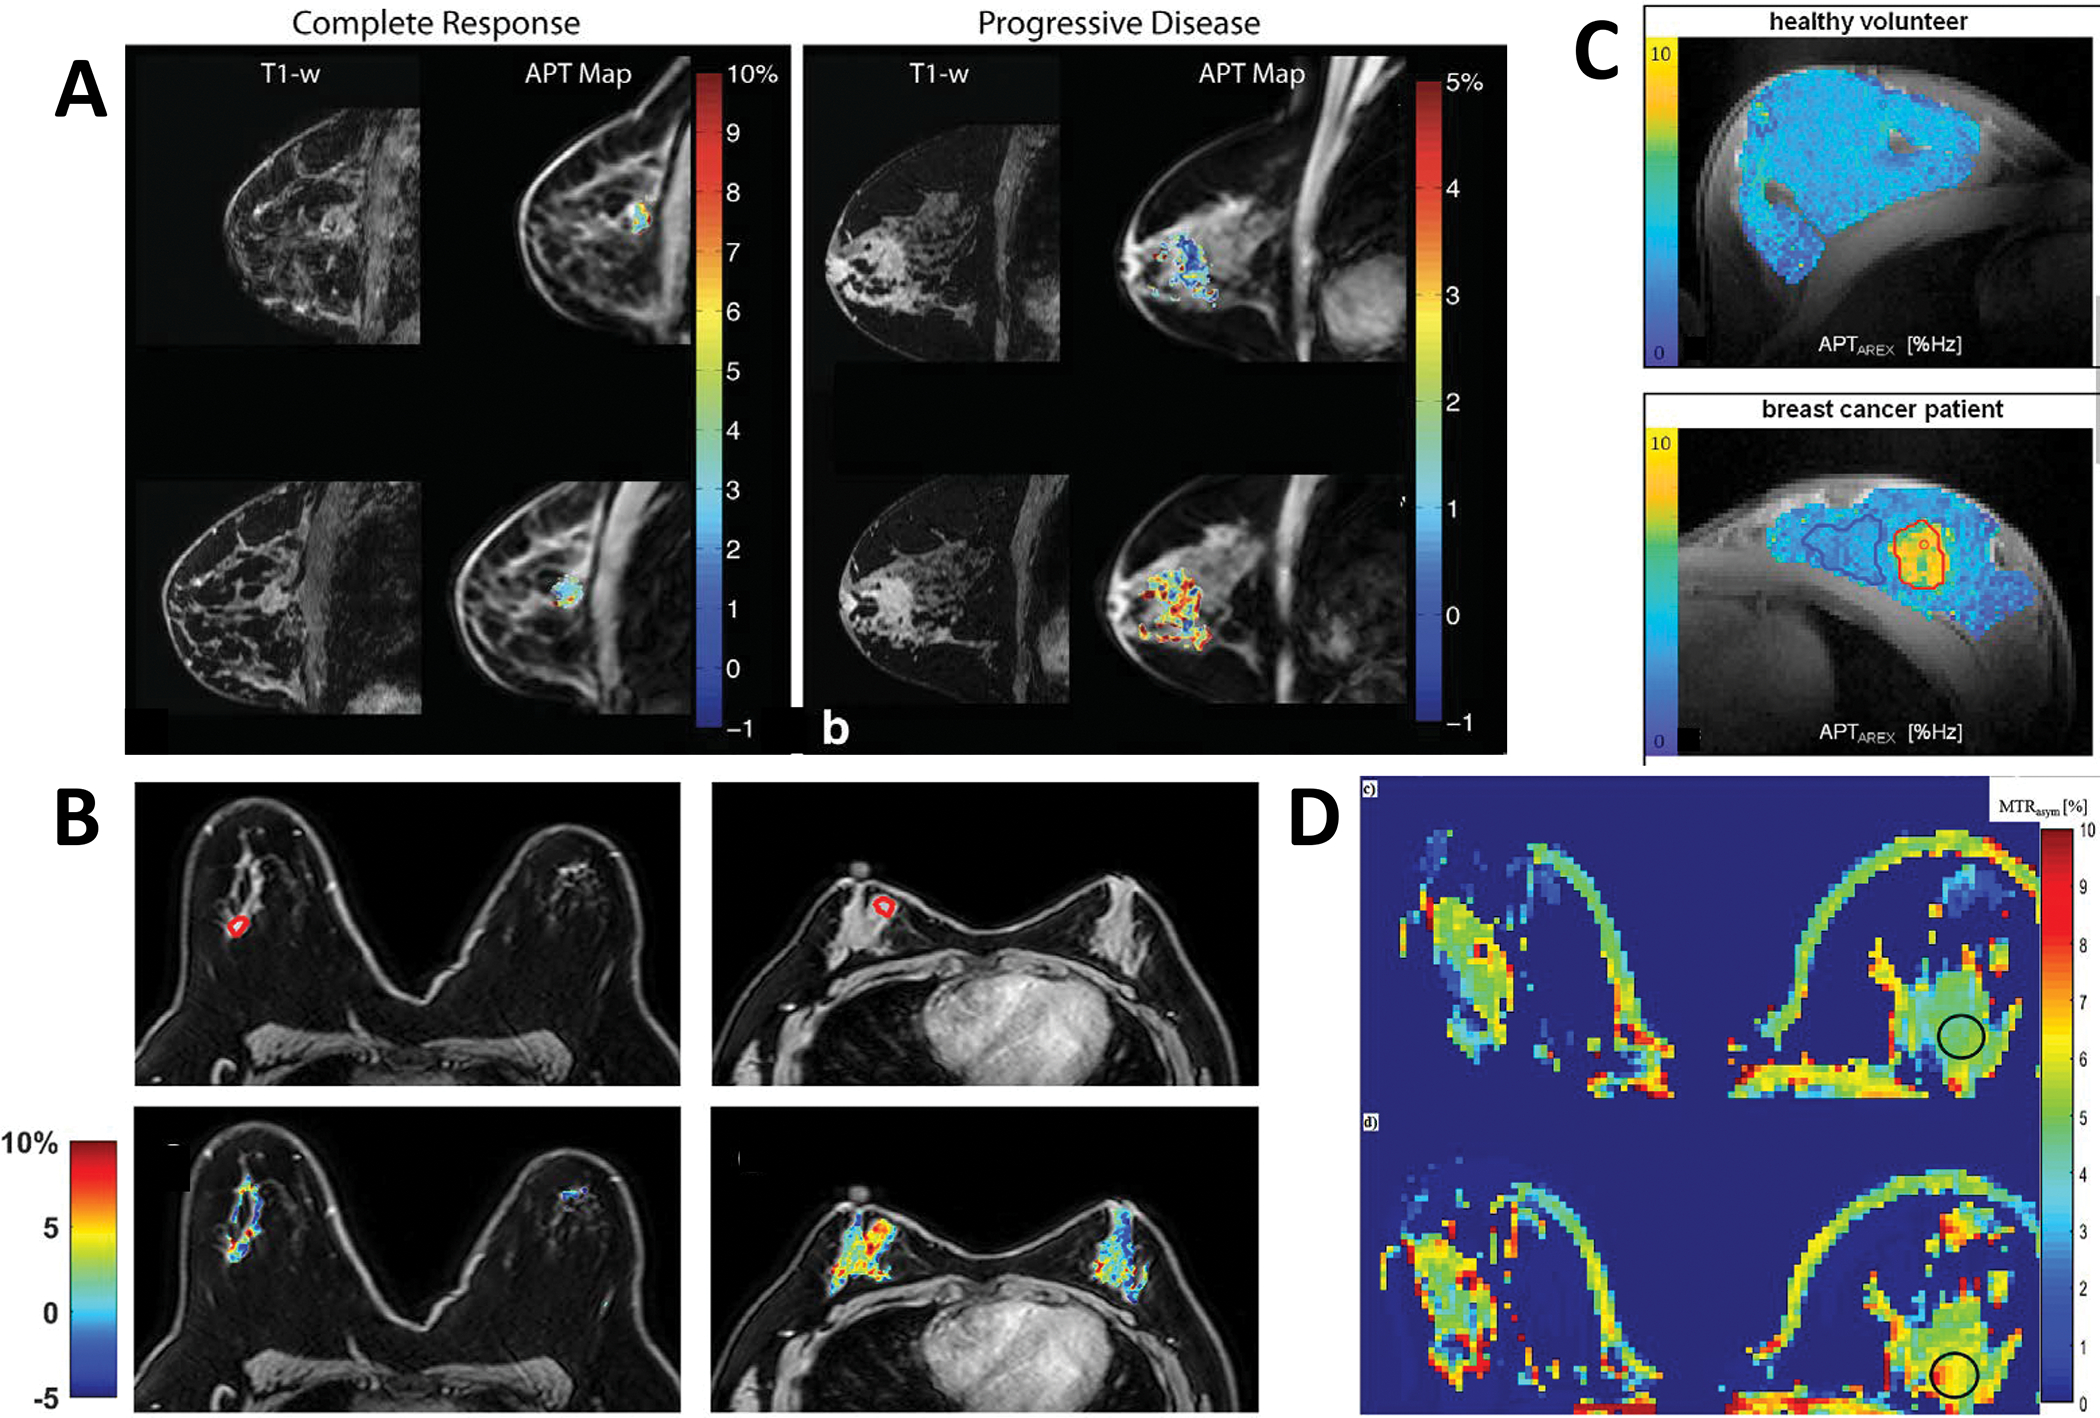
Chemical exchange saturation transfer (CEST) MRI has gained recognition as a valuable addition to the molecular imaging and quantitative biomarker arsenal, especially for characterization of brain tumors. There is also increasing interest in the use of CEST-MRI for applications beyond the brain. However, its translation to body oncology applications lags behind those in neuro-oncology. The slower migration of CEST-MRI to non-neurologic applications reflects the technical challenges inherent to imaging of the torso. In this review, we discuss the application of CEST-MRI to oncologic conditions of the breast and torso (i.e., body imaging), emphasizing the challenges and potential solutions to address them. While data are still limited, reported studies suggest that CEST signal is associated with important histology markers such as tumor grade, receptor status, and proliferation index, some of which are often associated with prognosis and response to therapy. However, further technical development is still needed to make CEST a reliable clinical application for body imaging and establish its role as a predictive and prognostic biomarker.

Keywords: APT; CEST; MRI; body imaging; oncologic imaging.


Figures

Figure 1.
Figure 1.
SCOPUS publication search results for A: overall CEST (using search string “(CEST or APTw) and MRI”, blue), vs neuro CEST (search string “(CEST or APTw) and MRI and (neuro or brain)”, red); B: neuro CEST (search string “(CEST or APTw) and MRI and (neuro or brain)”, red) vs body CEST (search string (CEST or APTw) and MRI and (breast or renal or kidney or prostate or liver or rectum or lung), green). Publication years starting with 2000.
Figure 2.
Figure 2.
Examples of CEST maps in breast cancer studies. A: overlay of tumor APT maps on corresponding anatomical images before (upper panels and after (bottom panels) one cycle of neoadjuvant chemotherapy for a patient achieving complete response (left panels) and a patient with progressive disease (right panels). Reprinted with permission from Ref.. B: Anatomical water only images (top panels) and hydroxyl CEST maps (bottom panels) of Invasive Ductal Carcinoma, not otherwise specified, patient (left) and a triple-negative breast cancer patient (right). ROI on anatomical images mark the tumors. Reprinted with permission from Ref.. C: APTAREX map of a representative breast cancer IDC patient (cancer lesion red ROI, bottom panel) and a healthy volunteer (top panel). Reprinted with permission from Ref. . D: The CEST map calculated at 1.4 ppm (top panel) and 3.5 ppm (bottom panel). Reprinted with permission from Ref..
Figure 3.
Figure 3.
Examples of CEST correlation with therapy response (A) or cancer aggressiveness (B-D) in human breast cancer studies. A: Normalized changes in APT after the first cycle of neoadjuvant chemotherapy in the slice with the largest tumor diameter. The mean of the non-responders (bright red line), partial responders (bright blue line), and complete responders (bright green line) on top of the change in APT signal of all the lesions (transparent lines in the background), where each line represents a different lesion. The standard deviation in each group is shown as error bars. Reprinted from Ref. under Creative Commons Attribution 4.0 International License (http://creativecommons.org/licenses/by/4.0/). B: The MTRasym averaged in three frequency ranges for normal (white), benign (blue), estrogen receptor (ER) positive (ER+, gray) and ER- (black) Invasive Ductal Carcinoma (IDC) groups. Reprinted with permission from Ref.. C: Mean conventional (light blue) and fat-corrected (dark blue) APTAREX in breast cancer lesions vs normal-appearing fibroglandular tissue in volunteers and patients (***, p<0.001) Reprinted with permission from Ref.. D. Boxplot diagram of maximal values of MTRasym from breast cancer lesions (divided into three groups based on grade 1, 2, and 3 (G1, G2, and G3)) and for normal appearing fibroglandular tissues from the contralateral side. Reprinted with permission from Ref .
Figure 4.
Figure 4.
Examples of CEST studies in prostate cancer. A: APT map (left panel) for a case with a Transition Zone (TZ) tumor (Gleason score: 3 + 4 = 7, pathologic stage: T3b). The pathologic slide (right panel) shows the tumor region (yellow dashed line) and two Peripheral Zone (PZ) benign regions (yellow solid line). Reprinted with permission from Ref. . B: APT pseudo-colored maps (top panels) and pathological images (bottom panels) of BPH case (left panels) and GS=8 prostate cancer (right panels, arrow). Reprinted from Ref. under Creative Commons Attribution 4.0 International License (http://creativecommons.org/licenses/by/4.0/).
Figure 5.
Figure 5.
Example of CEST studies in liver. pHe values maps of hepatic carcinoma (left panel) and hepatic hemangioma (right panel) quantified using dual-power CEST-MRI and exogenous agent Ioversol. Reprinted from Ref. under Creative Commons Attribution 4.0 International License (http://creativecommons.org/licenses/by/4.0/).
Figure 6.
Figure 6.
Examples of CEST studies of rectal cancer. A: The APTw maps (left panels) and H. E. staining (right panels) for patients with well differentiated adenocarcinoma (top panel) and moderately differentiated adenocarcinoma including high mucinous components (bottom panel). A region-of-interest placed over tumor is also shown (arrows). Reprinted with permission from Ref. . B: Imaging of patient withs rectal cancer resected after three courses of XEROX (capecitabine and oxaliplatin). The APTw maps (left panels) and H.E. staining (right panels). The degree of histological degeneration and necrosis was Grade 3 (top panels) and Grade 1 (bottom panels) on HE staining. Arrows on APT maps show region-of-interests for quantitative measurements. Case at the top panels demonstrates complete necrosis, while residual tumors are observed in the case at the bottom panels (arrows on H.E. staining). Reprinted with permission from Ref. .
Figure 7.
Figure 7.
Lipid influence on CEST signal and proposed solutions. A: APT maps (top panels), the corresponding Z-spectra and MTRasym (bottom row) from region of interest (ROI) encompassing all fibroglandular tissue obtained with (right-most panels) and without Dixon (left-most and middle panels). The non-Dixon and Dixon images refer to the second echo source image (left-most panels) or first echo source image (middle panels) and water-only image (right-most panels). Reprinted pending permission from Ref. . B: APT maps (top row) reconstructed using three-point mDixon (left panels) and self-adapting multi-peak model (SMPM, right panels), the corresponding Z-spectrum (blue line) and MTRasym (red line) of two pixels in a high fat fraction region (middle row) and a low fat-fraction region (bottom row). Reprinted with permission from Ref. . C: APTAREX image (bottom row) of a patient with invasive mucinous mamma carcinoma (G2). Conventional (left panels) and fat signal–corrected (right panels) Z-spectra (B1 = 0.6 μT, top row) of an exemplary voxel within the tumor. Reprinted with permission from Ref. .

References

    1. Hylton NM. Residual Disease after Neoadjuvant Therapy for Breast Cancer: Can MRI Help? Radiology. 2018/November/01 2018;289(2):335–336. doi:10.1148/radiol.2018181846 - DOI - PMC - PubMed
    1. Nicolini A. Biomarkers: a framework driving advances in oncology. Biomarkers in Medicine. 2015/March/01 2015;9(4):303–306. doi:10.2217/bmm.15.7 - DOI - PubMed
    1. Mendichovszky I, Pullens P, Dekkers I, et al. Technical recommendations for clinical translation of renal MRI: a consensus project of the Cooperation in Science and Technology Action PARENCHIMA. (1352–8661 (Electronic)) - PMC - PubMed
    1. Stabile A, Giganti F, Rosenkrantz AB, et al. Multiparametric MRI for prostate cancer diagnosis: current status and future directions. Nature Reviews Urology. 2020/January/01 2020;17(1):41–61. doi:10.1038/s41585-019-0212-4 - DOI - PubMed
    1. Hagiwara A, Tatekawa H, Yao J, et al. Visualization of tumor heterogeneity and prediction of isocitrate dehydrogenase mutation status for human gliomas using multiparametric physiologic and metabolic MRI. Article. Scientific Reports. 2022;12(1)1078. doi:10.1038/s41598-022-05077-2 - DOI - PMC - PubMed

Publication types