Meta-Analysis
. 2023 Jan 31;42(1):111990.
doi: 10.1016/j.celrep.2023.111990. Epub 2023 Jan 13.

A multiplexed in vivo approach to identify driver genes in small cell lung cancer

Affiliations
Meta-Analysis

A multiplexed in vivo approach to identify driver genes in small cell lung cancer

Myung Chang Lee et al. Cell Rep. .

Abstract

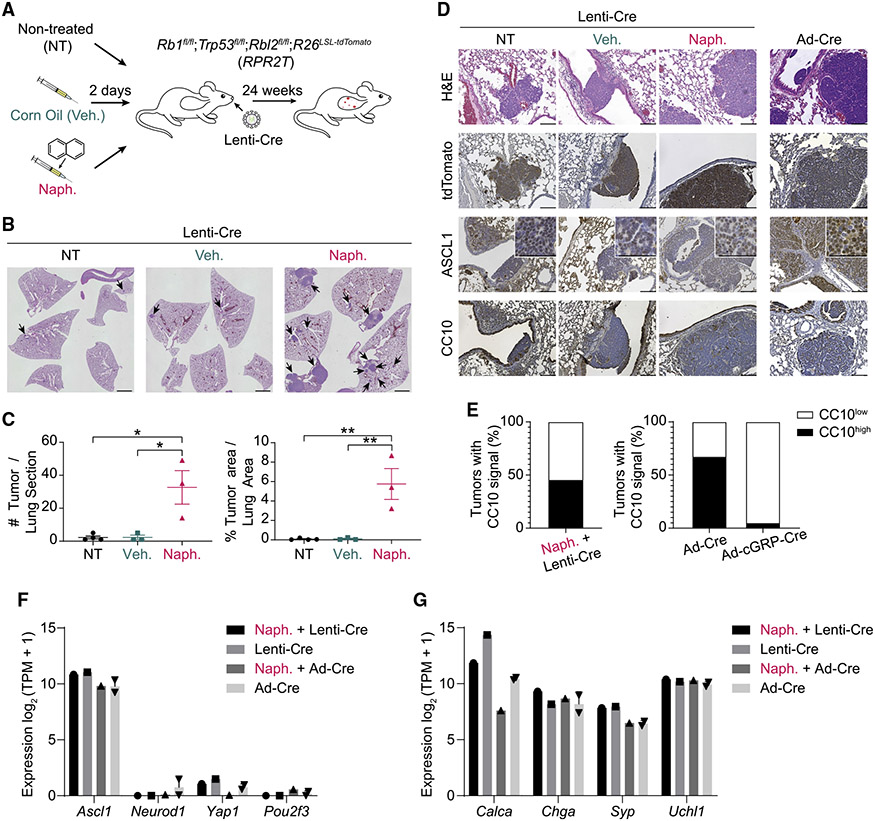
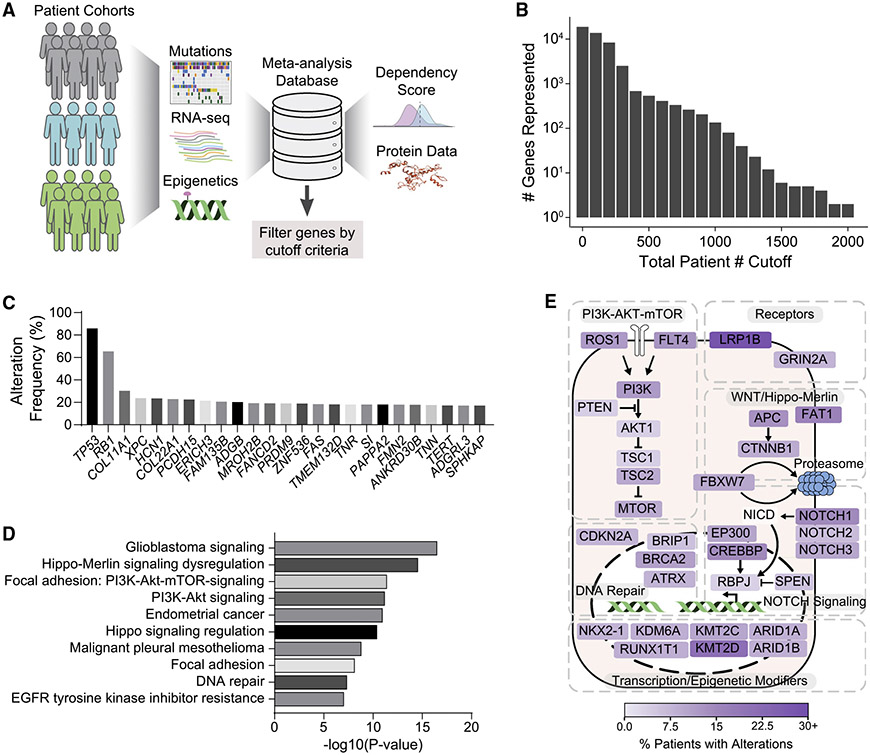
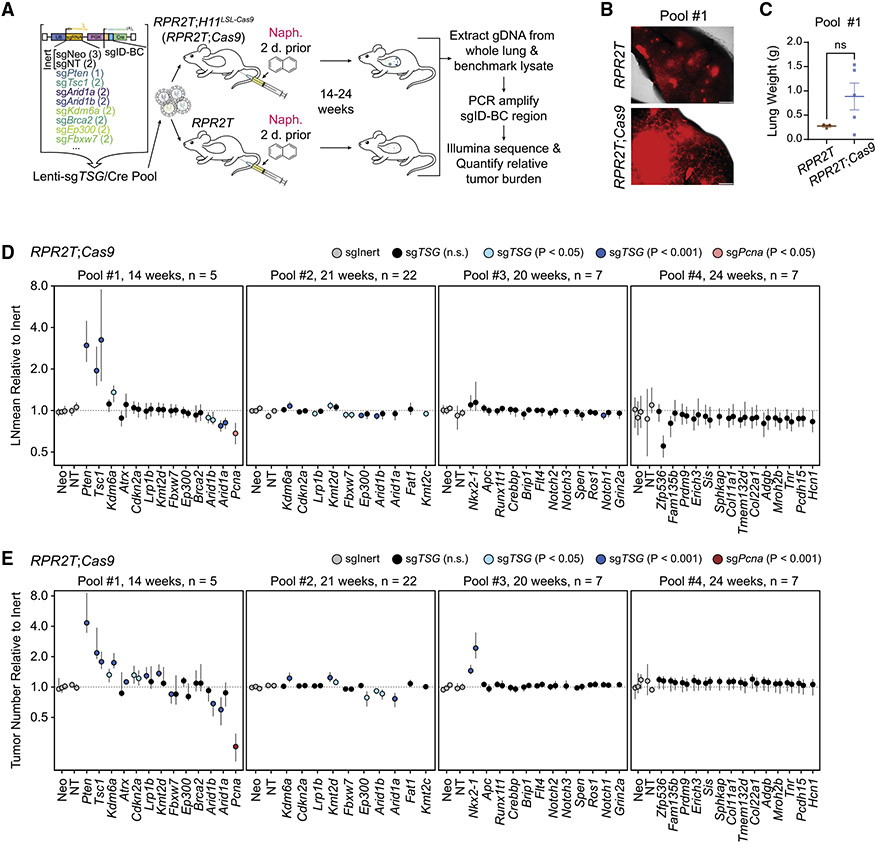
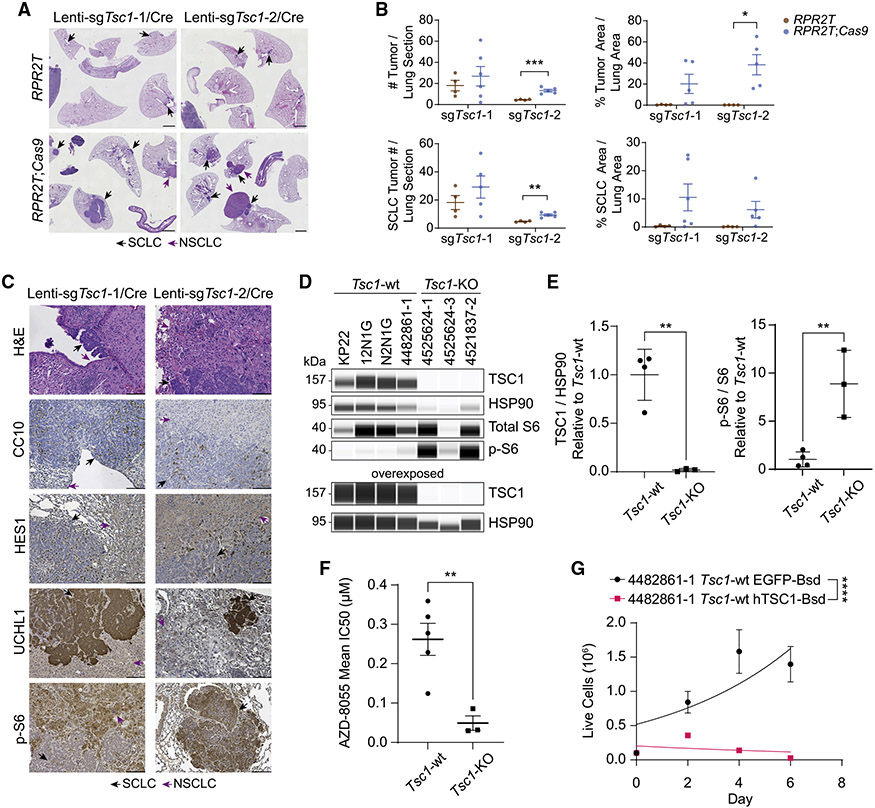
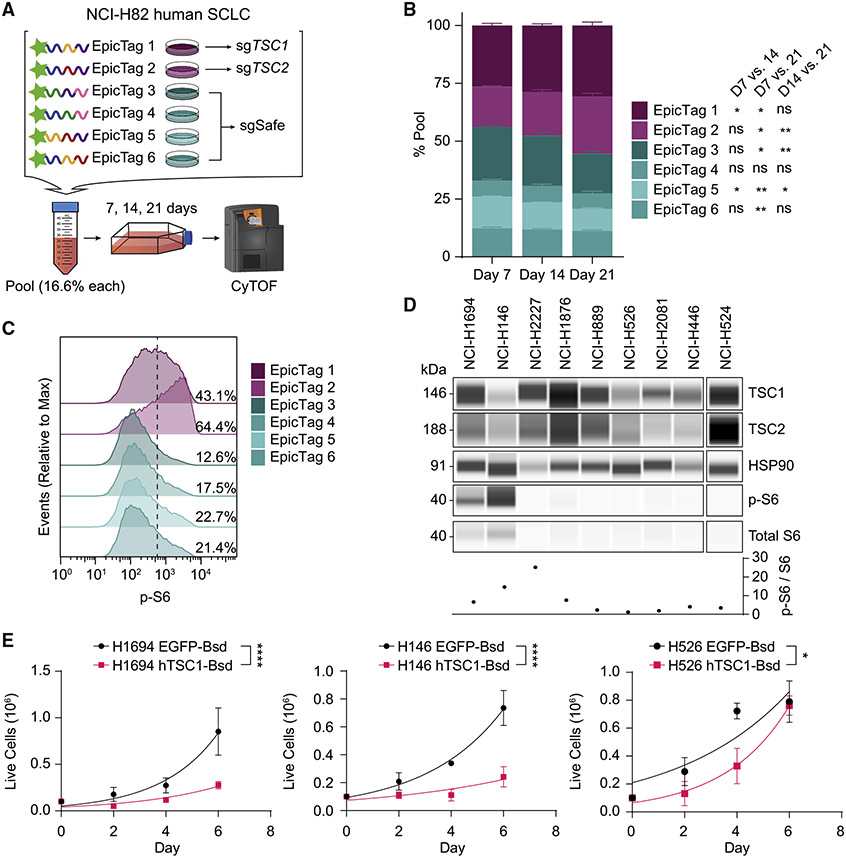
Small cell lung cancer (SCLC) is a lethal form of lung cancer. Here, we develop a quantitative multiplexed approach on the basis of lentiviral barcoding with somatic CRISPR-Cas9-mediated genome editing to functionally investigate candidate regulators of tumor initiation and growth in genetically engineered mouse models of SCLC. We found that naphthalene pre-treatment enhances lentiviral vector-mediated SCLC initiation, enabling high multiplicity of tumor clones for analysis through high-throughput sequencing methods. Candidate drivers of SCLC identified from a meta-analysis across multiple human SCLC genomic datasets were tested using this approach, which defines both positive and detrimental impacts of inactivating 40 genes across candidate pathways on SCLC development. This analysis and subsequent validation in human SCLC cells establish TSC1 in the PI3K-AKT-mTOR pathway as a robust tumor suppressor in SCLC. This approach should illuminate drivers of SCLC, facilitate the development of precision therapies for defined SCLC genotypes, and identify therapeutic targets.

Keywords: CP: Cancer; CRISPR screening; MTOR; SCLC; TSC1; functional genomics; meta-analysis; mouse models; naphthalene; small cell lung cancer; tumor suppression.


Conflict of interest statement

Declaration of interests J.S. has equity in and is an advisor for DISCO Pharmaceuticals. M.M.W. and D.A.P. are founders of and hold equity in D2G Oncology.

Figures

Figure 1.
Figure 1.. Naphthalene treatment enhances SCLC tumor development upon lentiviral Cre delivery
(A) Workflow diagram for lentiviral Cre delivery (Lenti-Cre) used to generate SCLC in mice. (B) Representative H&E staining of lung sections (with some intestine in the middle panel) from mice transduced with Ad-CMV-Cre (Ad-Cre) or HIV-PGK-Cre (Lenti-Cre) alone (NT) or following corn oil (vehicle [veh.]) or naphthalene (naph.) pre-treatment as in (A). Scale bar, 2 mm. (C) Quantification of tumor burden and numbers from mice in (B) (n = 1 experiment, with n = 3 or 4 mice per condition). p values were calculated using one-way ANOVA with post-hoc Tukey test. *p < 0.05 and **p < 0.01. (D) Representative H&E and immunohistochemistry (IHC) staining (brown signal) images of lung sections from mice transduced with HIV-PGK-Cre (Lenti-Cre) or Ad-CMV-Cre (Ad-Cre) as a control. Scale bar, 100 μm. Higher magnification images are shown in insets, where scale bar indicates 50 μm. (E) Frequencies of CC10high versus CC10low tumors quantified from images of lung sections from mice transduced with HIV-PGK-Cre (Lenti-Cre) as in (D) (n = 2 mice). The analyses of tumors from mice infected with Ad-CMV-Cre (Ad-Cre) and Ad-cGRP-Cre are derived from data available in Yang et al. (2018). (F and G) Bar graphs of RNA expression of selected genes (RNA-seq) in SCLC cell lines (Naph. + Lenti-Cre, n = 1; Lenti-Cre, n = 1; Naph. + Ad-CMV-Cre, n = 1; Ad-CMV-Cre, n = 2) (Lenti-Cre: HIV-PGK-Cre). (F) Genes representing the four major SCLC subtypes. (G) Common neuroendocrine markers. Data represented as mean ± SEM (C) or mean ± SD (F and G).
Figure 2.
Figure 2.. A meta-analysis of genetic studies identifies candidate drivers of SCLC development
(A) Diagram of the meta-analysis workflow. (B) Total number of genes represented when cutoff criteria are applied on total patient number (e.g., 2 genes were profiled in ≥2,000 patients, ~100 genes were profiled in ≥1,100 patients). (C) Alteration frequencies of top 25 gene candidates in all available patient data profiled. (D) Top 10 enriched pathways for genes altered in ≥3% of SCLC patients, were profiled in at least 250 patients and coded for protein with amino acid residue length of ≤2,000. Changing the gene cutoff criteria (e.g., removing amino acid residue length limits on protein products and keeping only genes that are expressed at ≥5 reads per kilobase of exon per million reads mapped [RPKM] in human SCLC) did not strongly affect the pathway enrichments. WikiPathways was used for enrichment analysis, with the word “pathways” removed in the figure for space considerations. (E) Diagram of selected SCLC driver candidates placed in signaling pathways on the basis of (D). RB1 and TP53 were not represented to highlight other candidate drivers. Fill color indicates percentage of patients with alterations in that gene. p value was determined using Bonferroni step-down correction on two-sided hypergeometric test (D).
Figure 3.
Figure 3.. In vivo CRISPR screen uncovers both positive and negative effects of gene inactivation on SCLC growth and initiation
(A) Diagram of the Tuba-seq workflow (n = 4 independent experimental pools, n = 3–22 mice per group). (B) Lung fluorescence images from mice transduced with pool 1. tdTomato fluorescence and bright-field images were merged. Scale bar, 1 mm. (C) Lung weights of mice (n = 3–5 per group) transduced with pool 1 at the time of collection. (D) Log-normal mean tumor size (normalized to tumors with sgInerts) for each putative tumor suppressor gene targeting sgRNA in RPR2T;Cas9 mice. For each gene, each circle represents a unique sgRNA. p values are indicated with a color code. (E) Tumor numbers (normalized to tumors with sgInerts as well as tumors in RPR2T mice for pools #1, 3 and 4 or RPR2L mice for pool #2) for each putative tumor suppressor gene targeting sgRNA in RPR2T;Cas9 mice. For each gene, each circle represents a unique sgRNA. p values are indicated with a color code. The 95% confidence intervals were calculated using bootstrapping (D and E). p values were determined using two-sided unpaired t test (C) or bootstrapping followed by Benjamini-Hochberg correction (D and E). Data are represented as mean ± SEM (C) or mean ± 95% confidence interval (D and E). ns, not significant.
Figure 4.
Figure 4.. TSC1 is a tumor suppressor in mouse SCLC
(A) Representative H&E sections of lungs (and spleen and intestine) from RPR2T and RPR2T;Cas9 mice transduced with Lenti-sgTsc1/Cre sgRNA 1 (Lenti-sgTsc1-1/Cre) or Lenti-sgTsc1/Cre sgRNA2 (Lenti-sgTsc1-2/Cre) (n = 2 independent experiments, n = 2–6 mice per group). Mice were collected 18 weeks after transduction. Scale bar, 2 mm. (B) Quantification of tumor size and number in (A). (C) Representative H&E and immunohistochemistry (IHC) staining (brown signal) images of lung sections from mice transduced with Lenti-sgTsc1-1/Cre or Lenti-sgTsc1-2/Cre. Scale bar, 100 μm. (D) Immunoassay of TSC1, S6, and phosphorylated S6 (p-S6) in cell lines derived from Tsc1-wild-type (WT) and Tsc1-knockout (KO) mouse tumors. Overexposed image is shown to confirm the knockout. HSP90 was used as a loading control. (E) Quantification of TSC1 and phosphorylated S6 (p-S6) expression from (D). Values were normalized to Tsc1-WT cell lines. (F) IC50 values of cell lines derived from Tsc1-wild-type (WT) and Tsc1-knockout (KO) mouse tumors with the mTOR inhibitor AZD8055. (G) Proliferation curves of mouse SCLC lines following transduction with Lenti-EFS-EGFP-T2A-Bsd (EGFP-Bsd) or Lenti-EFS-hTSC1-T2A-Bsd (hTSC1-Bsd) lentiviruses, as indicated. Exponential (Malthusian) growth least squares fit was used to model growth curves. p values were determined using two-sided unpaired t test (B, E, and F) or extra sum-of-squares F test (G). Data are represented as mean ± SEM (B), mean ± SD for n = 3 or 4 cell lines derived from independent tumors (E), mean ± SEM for IC50 values calculated from n = 3–8 biological replicates with n = 3 technical replicates (F), or mean ± SD for a representative experiment from n = 2 biological replicates with n = 3 technical replicates (G). ns, not significant. *p < 0.05, **p < 0.01, ***p < 0.001, and ****p < 0.0001.
Figure 5.
Figure 5.. TSC1 is a tumor suppressor in human SCLC
(A) Schematic of the pool competition assay (n = 1 experiment with n = 3 technical replicates) using epitope-tagged (EpicTag) NCI-H82 cells. (B) Stacked bar plot of percentage representation of epitope-labeled populations on days 7, 14, and 21. Day 0 sample was unavailable. Statistical significance indicated next to epitope tags represent comparisons between days 7 and 14, days 7 and 21, and days 14 and 21. (C) Modal distribution of phosphorylated S6 (p-S6) signal across the different epitope-labeled populations. Percentage values represent the proportion of p-S6-high population. One representative experimental replicate from day 21 is shown; all other replicates across days exhibit similar p-S6 signal distribution to what is shown. (D) Immunoassay of TSC1-mTOR pathway members in human SCLC cell lines. Graph shows the ratio of p-S6 to S6 signal following normalization to HSP90 loading control. (E) Growth curves of human SCLC lines following transduction with Lenti-EFS-EGFP-T2A-Bsd (EGFP-Bsd) or Lenti-EFS-hTSC1-T2A-Bsd (hTSC1-Bsd) lenti-viruses. NCI-H446 hTSC1-Bsd cells never reached sufficient numbers for plating post-transduction and selection. Data are represented as mean ± SD for a representative experiment out of n = 2 biological replicates (B), a representative experiment (D), or n = 3 (E) biological replicates with n = 3 technical replicates. Exponential (Malthusian) growth least squares fit was used to model growth curves in (E). p values were determined using repeated measures two-way ANOVA with Geisser-Greenhouse correction followed by post-hoc Tukey test (B) or extra sum-of-squares F test (E). ns, not significant. *p < 0.05, **p < 0.01, ***p < 0.001, and ****p < 0.0001.

References

    1. Beasley MB, Brambilla E, and Travis WD (2005). The 2004 World Health Organization classification of lung tumors. Semin. Roentgenol 40, 90–97. 10.1053/j.ro.2005.01.001. - DOI - PubMed
    1. Travis WD, Brambilla E, Nicholson AG, Yatabe Y, Austin JHM, Beasley MB, Chirieac LR, Dacic S, Duhig E, Flieder DB, et al. (2015). The 2015 world Health organization classification of lung tumors: impact of genetic, clinical and radiologic advances since the 2004 classification. J. Thorac. Oncol 10, 1243–1260. 10.1097/JTO.0000000000000630. - DOI - PubMed
    1. Barnholtz-Sloan JS, Sloan AE, Davis FG, Vigneau FD, Lai P, and Sawaya RE (2004). Incidence proportions of brain metastases in patients diagnosed (1973 to 2001) in the metropolitan detroit cancer surveillance system. J. Clin. Oncol 22, 2865–2872. 10.1200/JCO.2004.12.149. - DOI - PubMed
    1. Reck M, Luft A, Szczesna A, Havel L, Kim S-W, Akerley W, Pietanza MC, Wu YL, Zielinski C, Thomas M, et al. (2016). Phase III randomized trial of ipilimumab plus etoposide and platinum versus placebo plus etoposide and platinum in extensive-stage small-cell lung cancer. J. Clin. Oncol 34, 3740–3748. 10.1200/JCO.2016.67.6601. - DOI - PubMed
    1. George J, Lim JS, Jang SJ, Cun Y, Ozretić L, Kong G, Leenders F, Lu X, Fernández-Cuesta L, Bosco G, et al. (2015). Comprehensive genomic profiles of small cell lung cancer. Nature 524, 47–53. 10.1038/nature14664. - DOI - PMC - PubMed

Publication types

Substances

LinkOut - more resources