. 2023 Jan 31;42(1):111982.
doi: 10.1016/j.celrep.2022.111982. Epub 2023 Jan 9.

Defining the age-dependent and tissue-specific circadian transcriptome in male mice

Affiliations

Defining the age-dependent and tissue-specific circadian transcriptome in male mice

Christopher A Wolff et al. Cell Rep. .

Abstract

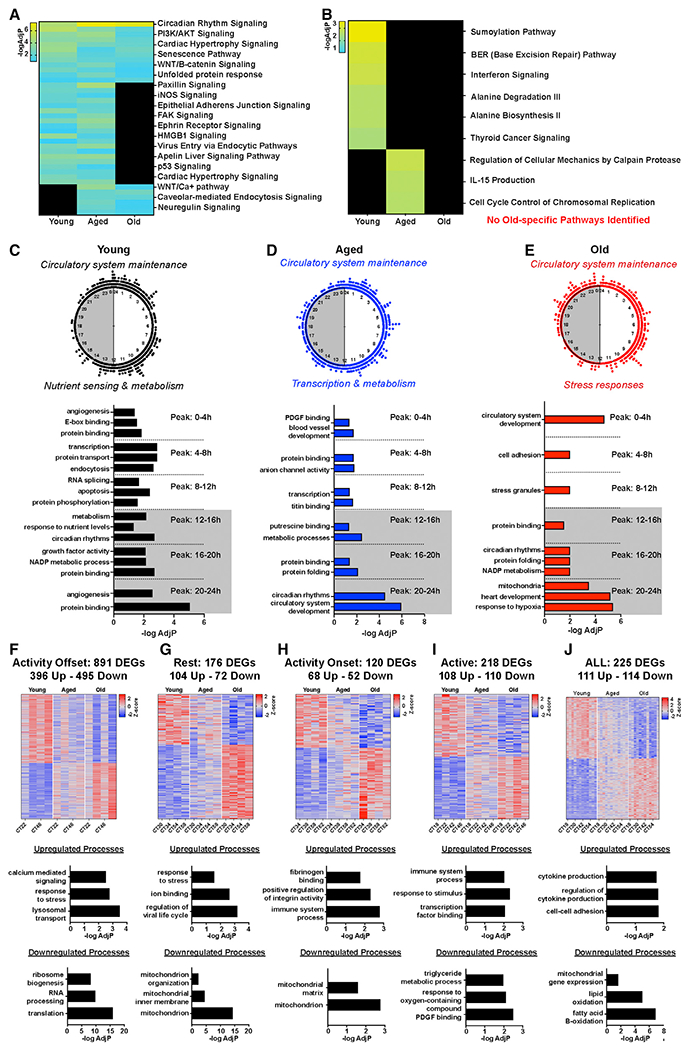
Cellular circadian clocks direct a daily transcriptional program that supports homeostasis and resilience. Emerging evidence has demonstrated age-associated changes in circadian functions. To define age-dependent changes at the systems level, we profile the circadian transcriptome in the hypothalamus, lung, heart, kidney, skeletal muscle, and adrenal gland in three age groups. We find age-dependent and tissue-specific clock output changes. Aging reduces the number of rhythmically expressed genes (REGs), indicative of weakened circadian control. REGs are enriched for the hallmarks of aging, adding another dimension to our understanding of aging. Analyzing differential gene expression within a tissue at four different times of day identifies distinct clusters of differentially expressed genes (DEGs). Increased variability of gene expression across the day is a common feature of aged tissues. This analysis extends the landscape for understanding aging and highlights the impact of aging on circadian clock function and temporal changes in gene expression.

Keywords: CP: Developmental biology; CP: Molecular biology; RNA-seq; adrenal gland; aging; circadian clock; heart; hypothalamus; kidney; lung; skeletal muscle.


Conflict of interest statement

Declaration of interests The authors declare no competing interests.

Figures

Figure 1.
Figure 1.. Circadian transcriptome analysis from six tissues and three ages
(A) Simplified study design schematic. Heatmap of z-scored rhythmically expressed genes (REGs) and a Venn diagram of the REGs from each age for the (B) hypothalamus, (C) lung, (D) kidney, (E) skeletal muscle, (F) adrenal gland, and (G) heart. Due to technical difficulties with adrenal samples, only CT38-CT62 from the Aged were included for circadian transcriptome analysis.
Figure 2.
Figure 2.. Age-dependent circadian transcriptomic changes in the hypothalamus
(A) Shared IPA pathways enriched by the REGs that cycle in two to three age groups. (B) Age-specific circadian oscillatory IPA pathways. (C–E) Peak time maps of all oscillating genes from the hypothalamus of (C) Young, (D) Aged, and (E) Old mice. Each dot represents the peak time of a single significantly circadian gene. Underneath the peak time map is a histogram of top time of day-specific gene expression pathways. (F–I) Heatmap of z-scored age-related differentially expressed genes (DEGs) and histograms of up- or downregulated pathways from the specific gene sets from the active to rest transition period (F), the rest phase (G), the rest to active transition period (H), and the active period (I). (J) Heatmap of z-scored age-related DEGs from all time domains and histograms of up- or downregulated pathways from the specific gene sets.
Figure 3.
Figure 3.. Age-associated changes in the lung circadian transcriptional output and time of day-dependent interpretations of age-related changes in gene expression
(A) Shared IPA pathways enriched by the REGs that cycle in two to three age groups. (B) Age-specific circadian oscillatory IPA pathways. (C–E) Peak time maps of all oscillating genes from the lungs of Young (C), Aged (D), and Old mice (E). Each dot represents the peak time of a single significantly circadian gene. Underneath the peak time map is a histogram of top time of day-specific gene expression pathways. (F–I) Heatmap of z-scored age-related DEGs and histograms of up- or downregulated pathways from the specific gene sets from the active to rest transition period (F), the rest phase (G), the rest to active transition period (H), and the active period (I). (J) Heatmap of z-scored age-related DEGs from all time domains and histograms of up- or downregulated pathways from the specific gene sets.
Figure 4.
Figure 4.. Age-associated changes in the kidney circadian transcriptional output and time of day-dependent interpretations of age-related changes in gene expression
(A) Shared IPA pathways enriched by the REGs that cycle in two to three age groups. (B) Age-specific circadian oscillatory IPA pathways. (C–E) Peak time maps of all oscillating genes from the kidneys of Young (C), Aged (D), and Old mice (E). Each dot represents the peak time of a single significantly circadian gene. Underneath the peak time map is a histogram of top time of day-specific gene expression pathways. (F–I) Heatmap of z-scored age-related DEGs and histograms of up- or downregulated pathways from the specific gene sets from the active to rest transition period (F), the rest phase (G), the rest to active transition period (H), and the active period (I). (J) Heatmap of z-scored age-related DEGs from all time domains and histograms of up- or downregulated pathways from the specific gene sets.
Figure 5.
Figure 5.. Age-associated changes in the muscle circadian transcriptional output and time of day-dependent interpretations of age-related changes in gene expression
(A) Shared IPA pathways enriched by the REGs that cycle in two to three age groups. (B) Age-specific circadian oscillatory IPA pathways. (C–E) Peak time maps of all oscillating genes from the skeletal muscle of Young (C), Aged (D), and Old mice (E). Each dot represents the peak time of a single significantly circadian gene. Underneath the peak time map is a histogram of top time of day-specific gene expression pathways. (F–I) Heatmap of z-scored age-related DEGs and histograms of up- or downregulated pathways from the specific gene sets from the active to rest transition period (F), the rest phase (G), the rest to active transition period (H), and the active period (I). (J) Heatmap of z-scored age-related DEGs from all time domains and histograms of up- or downregulated pathways from the specific gene sets.
Figure 6.
Figure 6.. Age-associated changes in the heart circadian transcriptional output and time of day-dependent interpretations of age-related changes in gene expression
(A) Shared IPA pathways enriched by the REGs that cycle in two to three age groups. (B) Age-specific circadian oscillatory IPA pathways. (C–E) Peak time maps of all oscillating genes from the heart of Young (C), Aged (D), and Old mice (E). Each dot represents the peak time of a single significantly circadian gene. Underneath the peak time map is a histogram of top time of day-specific gene expression pathways. (F–I) Heatmap of z-scored age-related DEGs and histograms of up- or downregulated pathways from the specific gene sets from the active to rest transition period (F), the rest phase (G), the rest to active transition period (H), and the active period (I). (J) Heatmap of z-scored age-related DEGs from all time domains and histograms of up- or downregulated pathways from the specific gene sets.
Figure 7.
Figure 7.. Age-related changes in variably expressed genes across tissues and summary of age-related changes in circadian and non-circadian gene expression
(A) Tissue-specific table of age-related changes in variable gene expression. (B) Hypothalamic variably expressed genes, “Change in Variability” means “change in variability (measured by absolute deviance) per unit change in age group (young vs. age or age vs. old)”. Change in Variability above 0 indicates genes that are more variably expressed with age, notated by the red arrow. (C–F) (C) Lung variable gene dispersion plot, (D) kidney variable gene dispersion plot, (E) skeletal muscle variable gene dispersion plot, (F) heart variable dispersion plot. (G) Number of variably expressed genes changing from Young to Aged and Aged to Old. (H) Venn diagram of overlapping variable genes across tissues. (I) Top biological processes enriched by overlapping variable genes in the muscle, kidney, and lung.

References

    1. Frenk S, and Houseley J (2018). Gene expression hallmarks of cellular ageing. Biogerontology 19, 547–566. 10.1007/s10522-018-9750-z. - DOI - PMC - PubMed
    1. Kennedy BK, Berger SL, Brunet A, Campisi J, Cuervo AM, Epel ES, Franceschi C, Lithgow GJ, Morimoto RI, Pessin JE, et al. (2014). Geroscience: linking aging to chronic disease. Cell 159, 709–713. 10.1016/j.cell.2014.10.039. - DOI - PMC - PubMed
    1. López-Otín C, Blasco MA, Partridge L, Serrano M, and Kroemer G (2013). The hallmarks of aging. Cell 153, 1194–1217. 10.1016/j.cell.2013.05.039. - DOI - PMC - PubMed
    1. Schaum N, Lehallier B, Hahn O, Pálovics R, Hosseinzadeh S, Lee SE, Sit R, Lee DP, Losada PM, Zardeneta ME, et al. (2020). Ageing hallmarks exhibit organ-specific temporal signatures. Nature 583, 596–602. 10.1038/s41586-020-2499-y. - DOI - PMC - PubMed
    1. Shavlakadze T, Morris M, Fang J, Wang SX, Zhu J, Zhou W, Tse HW, Mondragon-Gonzalez R, Roma G, and Glass DJ (2019). Age-related gene expression signature in rats demonstrate early, late, and linear transcriptional changes from multiple tissues. Cell Rep. 28, 3263–3273.e3. 10.1016/j.celrep.2019.08.043. - DOI - PubMed

Publication types