. 2023 Jan 31;42(1):111937.
doi: 10.1016/j.celrep.2022.111937. Epub 2023 Jan 1.

Single-cell RNA sequencing identifies a population of human liver-type ILC1s

Affiliations

Single-cell RNA sequencing identifies a population of human liver-type ILC1s

Benjamin Krämer et al. Cell Rep. .

Abstract

Group 1 innate lymphoid cells (ILCs) comprise a heterogeneous family of cytotoxic natural killer (NK) cells and ILC1s. We identify a population of "liver-type" ILC1s with transcriptional, phenotypic, and functional features distinct from those of conventional and liver-resident NK cells as well as from other previously described human ILC1 subsets. LT-ILC1s are CD49a+CD94+CD200R1+, express the transcription factor T-BET, and do not express the activating receptor NKp80 or the transcription factor EOMES. Similar to NK cells, liver-type ILC1s produce IFN-γ, TNF-α, and GM-CSF; however, liver-type ILC1s also produce IL-2 and lack perforin and granzyme-B. Liver-type ILC1s are expanded in cirrhotic liver tissues, and they can be produced from blood-derived ILC precursors in vitro in the presence of TGF-β1 and liver sinusoidal endothelial cells. Cells with similar signature and function can also be found in tonsil and intestinal tissues. Collectively, our study identifies and classifies a population of human cross-tissue ILC1s.

Keywords: CP: Immunology; ILC1; TGF-β; cirrhotic liver; cross-tissue ILC1; human group 1 ILC; innate lymphoid cell; liver ILC1; liver environment; natural killer cell.


Conflict of interest statement

Declaration of interests The authors declare no competing interests.

Figures
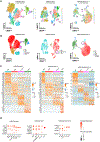
Figure 1.
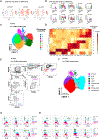
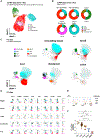
Figure 1.. Single-cell RNA sequencing identified an ILC1-like population in the human liver
(A) Cluster analysis of scRNA-seq data from ex vivo sorted hepatic LinCD45+ lymphocytes following quality control (clusters are indicated). Two experimentally independent scRNA-seq analyses (left: batch 1; middle: batch 2) and an external dataset (Heinrich et al.) are shown for comparison. (B) Analysis of ex vivo sorted hepatic LinCD45+ lymphocytes with assignment of cell populations (trNK, tr/cNK, ILC3, cNK, ILC3/ILC2, CD49a+trNK, LT-ILC1) based on a match to known gene signatures and illustrated in UMAP. LT-ILC1s are marked with a circle. Two experimentally independent scRNA-seq analyses (left: batch 1; middle: batch 2) and an external dataset (Heinrich et al.) are shown for comparison. (C) Heatmap showing a selection of the top 100 cells from each indicated cell type that has the highest expression for each gene. Two experimentally independent scRNA-seq analyses (left: batch 1; middle: batch 2) and an external dataset (Heinrich et al.) are shown for comparison. (D) Dot plots depicting relative expression of selected genes from cell types defined in (B). Two experimentally independent scRNA-seq analyses (batches 1 and 2) and an external dataset (Heinrich et al.) are shown for comparison. See Figure S1 and Table S1.
Figure 2.
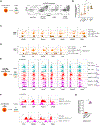
Figure 2.. Identification and phenotypic characterization of human liver-type ILC1s
(A) CITE-seq analysis (protein) of hepatic LinCD45+ lymphocytes showing relative expression of CD49a, CD94, and NKp80 in the LT-ILC1 cluster illustrated in UMAP (only batch 2). (B) Relative expression levels of the indicated markers among each of the indicated populations as measured by CITE-seq analysis (only batch 2). (C) PhenoGraph cluster analysis of flow cytometry data from hepatic LinCD45+ lymphocytes displayed in UMAP. Clustering and UMAP is based on following markers: CD94, CD45, CD56, CD117, CD52, CD200R1, CRTH2, T-BET, NKp80, CD161, CD49a, EOMES, CXCR6, and CD127. (D) Heatmap showing the relative expression of the indicated markers from nine PhenoGraph clusters identified in (C) as measured by flow cytometry and calculated to a Z score for each marker. (E) Representative flow cytometry plots showing the gating strategy from singlet LinCD45+ lymphocytes (from healthy livers) to identify liver-type (LT)-ILC1 (pink), cNK (turquoise), CD49a+trNK cells (violet), CD49atrNK cells (red), classical (c) ILC1 (gray), ILC2 (blue), and ILC3 (green) populations. (F) PhenoGraph cluster analysis of flow cytometry data from hepatic LinCD45+ lymphocytes with assignment of the indicated populations. (G) Representative histograms showing the relative expression of the indicated markers in each identified population to distinguish ILCs from NK cell populations. (H) Representative histograms showing the relative expression of the indicated markers in each identified population, each of which is elevated on LT-ILC1. See Figure S2.
Figure 3.
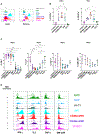
Figure 3.. Liver-type ILC1s were non-cytolytic but produced IFN-γ, TNF-α, IL-2, and GM-CSF
(A) Ex vivo intracellular flow cytometry showing perforin and granzyme-B expression patterns of human liver ILC and NK cell subsets as defined in Figure 2. Data are representative of at least three independent experiments. (B) CD107a degranulation assay of the indicated populations following 5 h stimulation by either phorbol myristate acetate (PMA) and ionomycin or K562 target cells. All experiments were performed with healthy livers (n = 5). (C) Analysis of cytokine production by NK cell and ILC populations from livers. For each cytokine, graphs depict intracellular flow cytometry analysis of hepatic lymphocytes following 5 h stimulation by PMA and ionomycin (IFN-γ, n ≥ 11, upper left panel; IL-2, n ≥ 4, upper right panel; TNF-α, n ≥ 5, lower left panel; GM-CSF, n ≥ 3, lower right panel). (D) Representative histograms showing intracellular cytokine staining of the indicated hepatic ILC and NK cell subsets either unstimulated (control, semi-transparent histograms) or following 5 h stimulation with PMA and ionomycin (P/I, filled histograms). *p < 0.05, **p < 0.01, ***p < 0.001, ****p < 0.0001, error bars represent SEM. See Figure S3.
Figure 4.
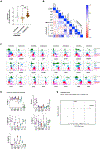
Figure 4.. Liver-type ILC1s are increased in cirrhotic liver tissues
(A) Comparison of LT-ILC1 (LinCD45+CD94+NKp80CD200R1+CD49a+) frequencies calculated as percentages among total Lin lymphocytes between control livers (perfusate n = 7), control livers (non-perfusate; n = 8), and cirrhotic livers (n = 29) (patient characteristics shown in Table S2). (B) Correlation matrix estimated for LT-ILC1s (percent of Lin), age, AST, ALT, gamma-GT, total bilirubin, MELD score (Model of End Stage Liver Disease), IFNG (mRNA), IL13 (mRNA), IL1B (mRNA), IL2 (mRNA), IL7 (mRNA), and TGFB1 (mRNA). LT-ILC1 frequencies were obtained from 25 cirrhotic livers. Spearman correlation coefficients (R) are given as color code. Statistically significant correlations are indicated with *p < 0.05, **p < 0.01, ***p < 0.001. (C) Representative expression of the indicated markers by human LT-ILC1 (pink), cNK cells (turquoise), CD49a+trNK cells (violet), CD49atrNK cells (red), cILC1s (gray), ILC2s (blue), and ILC3s (green), comparing populations derived from healthy and cirrhotic livers. Data are representative of at least three independent experiments. (D) Comparison of IFN-γ production (healthy, n ≥ 7; cirrhotic, n ≥ 9), IL-2 production (healthy, n = 4; cirrhotic, n ≥ 4), CD107a degranulation (healthy, n = 3; cirrhotic, n = 5), TNF-α production (healthy, n ≥ 7; cirrhotic, n ≥ 5), and GM-CSF production (healthy, n ≥ 4; cirrhotic, n ≥ 3) between healthy and cirrhotic livers related to LT-ILC1 (pink), cNK cells (turquoise), CD49a+trNK cells (violet), CD49atrNK cells (red), and ILC3s (green), from healthy and cirrhotic livers following 5 h PMA and ionomycin stimulation and measured by intracellular flow cytometry. (E) Volcano plot showing DEG differences based on scRNA-seq data between LT-ILC1s comparing “control versus cirrhotic liver tissues” from batch 2. *p < 0.05, ***p < 0.001, error bars represent SEM. See Figure S4.
Figure 5.
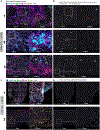
Figure 5.. LT-ILC1 cells accumulate in fibrotic area of the human liver
Representative images of three cirrhotic (A) and two control livers (C) generated with PhenoCycler (formerly Codex) with a selection of markers such as CD56, CD94, aSMA, CD36, and CD32, as well as DAPI for nucleus staining (A, C). An overview (left) and magnification (right) are shown side by side with scale bar and indicated diameters. Fibrotic regions were recognized and delineated with a white dashed line using aSMA-staining. The red arrows indicate LT-ILC1 cells automatically detected by the HALO image analysis software by CD45+CD3CD56+CD94+EOMESKLRG1+ definition (see staining in Figure S5). Images in (B) and (D) were artificially generated as cell contours using HALO image analysis and correspond to the respective section from (A) and (C). Only the identified LT-ILC1 cells were highlighted for enhanced visibility (surface is green, nucleus is blue and indicated with red arrows) with visualization of the non-fibrotic (NF) and fibrotic (F) regions.
Figure 6.
Figure 6.. Liver sinusoidal endothelial cells supported the differentiation of liver-type ILC1s
(A) Sorted peripheral blood ILCPs (Figure S5A; LinCD45+CD127+CD94NKp80CD45RA+CD117+CD294KLRG1NKP44) from four healthy donors were cultured for 2 weeks on OP9-DL4 feeder cells or LSECs with IL-7 +/− TGF-β1 as shown to the left. The dot plots to the right show the expression patterns of CD56 and CD94 among Lin lymphocytes derived in the indicated culture conditions. (B) Frequencies of CD200R1+CD49a+EOMES cells among total LinCD45+CD94+CD56+ cells derived in vitro following culture of ILCPs (n = 8) as in (A). (C) Representative flow cytometry analyses of EOMES, T-BET, perforin, CXCR6, NKp80, CD200R1, and CD49a expression by LinCD45+CD94+CD56+ cells derived from ILCPs in the indicated culture conditions. Fluorescence minus one (FMO) control with the respective lacking specific antibody is shown as black dotted lines in each histogram. (D) Intracellular flow cytometry analysis of IFN-γ, IL-2, GM-CSF, TNF-α, and IL-22 production by in vitro derived LinCD45+CD94+CD56+ cells generated from ILCPs as in (A) and following stimulation for 5 h with PMA and ionomycin. Unstimulated cells were set as controls (dotted black line). (E) Representative flow cytometry analyses showing expression of the indicated markers by total LinCD45+ cells obtained after 2 weeks culture of primary sorted liver-type hepatic cNK, CD49a+trNK, or CD49atrNK cells on OP9-DL4 feeder cells or LSECs with IL-7 +/− TGF-β1 as shown to the left. Data are representative of at least three independent experiments. (F) Representative flow cytometry analyses showing expression of the indicated markers by total LinCD45+ cells obtained after 2-week culture of primary sorted liver-type ILC1s (LT-ILC1s) or hepatic NK cells (sorted as LinCD56+CD94+NKp80+) with OP9-DL4 cells and IL-7. Data are representative of at least three independent experiments. (G) Frequencies of CD200R1+CD49a+EOMEScells among total LinCD45+CD94+ lymphocytes obtained from cultures initiated with either total hepatic NK cells or liver-type ILC1s (F). *p < 0.05, **p < 0.01, ***p < 0.001, error bars represent SEM. See Figure S6.
Figure 7.
Figure 7.. Population of cells with liver-type ILC1-associated features are identified in other tissues
(A) scRNA-seq analysis of LinCD45+ lymphocytes from control livers, cirrhotic livers, tonsils, duodenum, and colon from batches 1 and 2 with assignment of cell populations trNK, cNK, ILC3/ILC2, and LT-ILC1-like cells based on a match to known gene signatures and illustrated in UMAP with 16,187 cells (assignment in Figures S7A-S7C; G). LT-ILC1-like cells are marked with a black circle. (B) scRNA-seq analysis showing the relative proportion of cNK, ILC2/ILC3, LT-ILC1-like, and trNK populations among control liver, cirrhotic liver, tonsil, duodenum, and colon tissues (n = 3 per compartment). (C) Dot plot showing CD45+Lin lymphocytes with the relative distribution of the indicated populations identified in Figures 1B and S7I among peripheral blood, tonsil, liver, duodenum, and colon tissues of each three subjects displayed in UMAP (based on markers indicated in Table S3). The left black dashed circle includes LT-ILC1-like cells, and the right dashed circle includes intraepithelial ILC1 cells. (D) Representative histograms showing the relative expression of the indicated markers among the populations identified in Figures 1B and S7I in peripheral blood, tonsil, colon, and duodenum tissues in addition to control liver. (E) Representative histogram of intracellular flow cytometry analysis of IFN-γ, TNF-α, and IL-2 produced by LT-ILC1-like cells (same gating as for Figures 1C and 1D) following ex vivo stimulation for 5 h with PMA and ionomycin. Unstimulated cells were set as controls. (F) Relative frequency of LT-ILC1-like cells calculated as the percentage of total CD45+ lymphocytes in the duodenum (n = 6), liver (n = 29), colon (n = 7), tonsil (n = 6), and peripheral blood (n = 8). *p < 0.05, **p < 0.01, ***p < 0.001, ****p < 0.0001, error bars represent SEM. See Figure S7.

Similar articles

Cited by

References

    1. Vivier E, Artis D, Colonna M, Diefenbach A, Di Santo JP, Eberl G, Koyasu S, Locksley RM, McKenzie ANJ, Mebius RE, et al. (2018). Innate lymphoid cells: 10 Years on. Cell 174, 1054–1066. 10.1016/j.cell.2018.07.017. - DOI - PubMed
    1. Bernink JH, Peters CP, Munneke M, te Velde AA, Meijer SL, Weijer K, Hreggvidsdottir HS, Heinsbroek SE, Legrand N, Buskens CJ, et al. (2013). Human type 1 innate lymphoid cells accumulate in inflamed mucosal tissues. Nat. Immunol 14, 221–229. 10.1038/ni.2534. - DOI - PubMed
    1. Fuchs A, Vermi W, Lee JS, Lonardi S, Gilfillan S, Newberry RD, Cella M, and Colonna M (2013). Intraepithelial type 1 innate lymphoid cells are a unique subset of IL-12- and IL-15-responsive IFN-γ-Producing cells. Immunity 38, 769–781. 10.1016/j.immuni.2013.02.010. - DOI - PMC - PubMed
    1. Mjösberg JM, Trifari S, Crellin NK, Peters CP, van Drunen CM, Piet B, Fokkens WJ, Cupedo T, and Spits H (2011). Human IL-25- and IL-33-responsive type 2 innate lymphoid cells are defined by expression of CRTH2 and CD161. Nat. Immunol 12, 1055–1062. 10.1038/ni.2104. - DOI - PubMed
    1. Cella M, Fuchs A, Vermi W, Facchetti F, Otero K, Lennerz JKM, Doherty JM, Mills JC, and Colonna M (2009). A human natural killer cell subset provides an innate source of IL-22 for mucosal immunity. Nature 457, 722–725. 10.1038/nature07537. - DOI - PMC - PubMed

Publication types

Substances

LinkOut - more resources