. 2023 Jan 31;42(1):111907.
doi: 10.1016/j.celrep.2022.111907. Epub 2023 Jan 5.

Specification of human germ cell fate with enhanced progression capability supported by hindgut organoids

Affiliations

Specification of human germ cell fate with enhanced progression capability supported by hindgut organoids

João Pedro Alves-Lopes et al. Cell Rep. .

Abstract

Human primordial germ cells (hPGCs), the precursors of sperm and eggs, are specified during weeks 2-3 after fertilization. Few studies on ex vivo and in vitro cultured human embryos reported plausible hPGCs on embryonic day (E) 12-13 and in an E16-17 gastrulating embryo. In vitro, hPGC-like cells (hPGCLCs) can be specified from the intermediary pluripotent stage or peri-gastrulation precursors. Here, we explore the broad spectrum of hPGCLC precursors and how different precursors impact hPGCLC development. We show that resetting precursors can give rise to hPGCLCs (rhPGCLCs) in response to BMP. Strikingly, rhPGCLCs co-cultured with human hindgut organoids progress at a pace reminiscent of in vivo hPGC development, unlike those derived from peri-gastrulation precursors. Moreover, rhPGCLC specification depends on both EOMES and TBXT, not just on EOMES as for peri-gastrulation hPGCLCs. Importantly, our study provides the foundation for developing efficient in vitro models of human gametogenesis.

Keywords: CP: Stem cell research; Hindgut organoid; Primordial germ cell; Primordial germ cell-like cell precursor.


Conflict of interest statement

Declaration of interests The authors declare no competing interests.

Figures
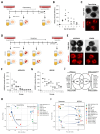
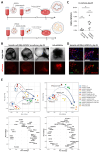
Figure 1
Figure 1. hPGCLC specification from capacitating and resetting precursors
(A) Schematic diagram for capacitation of naïve hESCs; capacitating hESCs are competent for hPGCLC fate. (B) Efficiency of hPGCLC induction (% of hPGCLCs in day 4 embryoid bodies) from capacitating hESCs over six days of capacitation protocol, measured by the co-expression of NANOS3−tdTomato and TNAP on flow cytometry analysis. Horizontal bars represent the mean percentage for each day. At least n=3 measurements were taken from independent experiments for each time point. (C) Day 4 embryoid bodies generated from capacitating NANOS3−tdTomato hESCs. Scale bar: 200 um. (D) Schematic diagram for resetting (tt2iGöXAV and HENSM) primed hESCs into naïve hESCs; resetting hESCs are competent for hPGCLC specification. (E) Day 4 embryoid bodies from resetting (tt2iGöXAV and HENSM) NANOS3−tdTomato hESCs. Scale bar, 200 um. (F and G) Efficiency of hPGCLC induction (% of hPGCLCs in day 4 embryoid bodies) from resetting tt2iGöXAV (F) and HENSM (G) hESCs over 10 passages, measured by the co-expression of NANOS3−tdTomato and TNAP on flow cytometry analysis. P0 represents the induction efficiency of primed hESCs (cultured in E8 medium). Horizontal bars represent the mean percentage for each day. At least n=3 measurements were taken from independent experiments for each time point. (H) Two-dimensional principal component analysis for hESCs and hPGCLC precursors from peri-gastrulation (4i and PreME), resetting tt2iGöXAV, resetting HENSM, and capacitating (cap) conditions. Passage after conversions (P) or days of capacitation (d) are indicated. Arrows show potential conversion trajectories. (I) Two-dimensional principal component analysis for hESCs, hPGCLC precursors, and day 4 hPGCLCs from peri-gastrulation (4i and PreME), resetting tt2iGöXAV, resetting HENSM, and capacitating (cap) conditions. Passage after conversions (P) or days of capacitation (d) are indicated. Arrows show potential specification trajectories. (J) Venn diagram showing differentially expressed genes (log2FC > 2 and adjusted p-value < 0.05) commonly upregulated in day 4 peri-gastrulation hPGCLCs (4i and PreME) versus rhPGCLCs (tt2iGöXAV and HENSM), and vice versa. See also Figures S1, S2, S3, S4, and S5.
Figure 2
Figure 2. Dependency of BMP and SOX17 for hPGCLC specification from resetting precursors
(A) Schematic diagram for the BMP dependency experiment. (B) Efficiency of hPGCLC induction (% of hPGCLCs in day 4 embryoid bodies) from peri-gastrulation (4i and PreME) and resetting (tt2iGöXAV and HENSM) hESCs under three experimental conditions (Cyto+BMP, Cyto-BMP, and Cyto+BMP+LDN), measured by the co-expression of NANOS3−tdTomato and TNAP on flow cytometry analysis. Horizontal bars represent the mean percentage for each condition. At least n=3 measurements were taken from independent experiments for each condition. (C) Schematic diagram for the SOX17 dependency experiment. (D) Bright-field images for day 4 embryoid bodies generated from HENSM resetting hESCs with three different genetic backgrounds (parental (W24), SOX17 knockout (SKO5), and SOX17 rescue (S17.11) lines), under the absence or presence of DOX. Scale bar, 200 um. (E and F) Efficiency of hPGCLC induction (% of hPGCLCs in day 4 embryoid bodies) from (E) tt2iGöXAV and (F) HENSM resetting hESCS in four different genetic backgrounds (W15, parental W24, SOX17 knockout (SKO5), and SOX17 rescue (S17.11) lines), under the absence or presence of DOX, measured by the co-expression of PDPN and TNAP on flow cytometry analysis. Horizontal bars represent the mean percentage for each condition. At least n=4 measurements were taken from independent experiments for each condition. See also Figures S6 and S7.
Figure 3
Figure 3. Progression of resetting hPGCLCs supported by human hindgut organoid co-cultures
(A) Schematic diagram for the co-culture strategy of hPGCLCs with human hindgut organoids. (B) Co-culture of human hindgut organoid and NANOS3−tdTomato resetting (tt2iGöXAV) hPGCLCs over 25 days. Scale bar, 200 um (except day 2: 100 um). (C) Immunofluorescence of OCT4, CDH1, and CDX2 on sections of a CS13 human hindgut (left panel) and Immunofluorescence of CDH1 and CDX2 on section of a day 25 human hindgut organoid (HG) co-culture containing resetting (tt2iGöXAV) hPGCLCs expressing NANOS3−tdTomato (right panel). DAPI nuclear counterstain showed in blue. Scale bar, 50 um. (D) Immunofluorescence of OCT4, CDX2, and DAZL on sections of a CS14 human hindgut (left panel) and Immunofluorescence of CDX2 and DAZL on section of a day 25 human hindgut organoid (HG) co-culture containing resetting (tt2iGöXAV) hPGCLCs expressing NANOS3−tdTomato (right panel). DAPI nuclear counterstain showed in blue. Scale bar, 50 um. (E) Immunofluorescence of SOX17 and DAZL on section of a day 25 human hindgut organoid (HG) co-culture containing resetting (tt2iGöXAV) hPGCLCs expressing NANOS3−tdTomato. DAPI nuclear counterstain showed in blue. Scale bar, 50 um. (F) Percentage of DAZL positive hPGCs out of Oct4 positive hPGCs in CS12−CS14 human embryos. Total number of cells counted (double DAZL and OCT4 positive/OCT4 positive cells) per condition shown between brackets. Only one human embryo for each stage was analysed due to the rarity of these samples. (G) Percentage of DAZL positive peri-gastrulation (4i or PreME) or resetting (tt2iGöXAV or HENSM) hPGCLCs out of NANOS3-tdTomato positive hPGCLCs in day 25 human hindgut organoid (HG) co-cultures. Horizontal bars represent the mean percentage for each condition. At least n=3 measurements were taken from independent experiments for each condition. Total number of cells counted (double DAZL and tdTomato positive/tdTomato positive cells) per condition shown between brackets. See also Figures S8, S9, S10 and S11.
Figure 4
Figure 4. Progression of resetting hPGCLCs supported by human hindgut organoid and mouse female gonadal somatic cell co-cultures
(A) Schematic diagram for the co-culture strategy of hPGCLCs with human hindgut organoids or somatic cells from embryoid bodies (EBs; negative control). (B) Co-culture of human hindgut organoid (HG) or somatic cells from embryoid bodies (EBs; negative control) with NANOS3−tdTomato resetting (tt2iGöXAV) hPGCLCs over the 25-day period. Scale bar, 500 um. (C) Percentage of DAZL positive resetting (tt2iGöXAV) hPGCLCs out of NANOS3-tdTomato positive hPGCLCs in day 25 co-cultures with human hindgut organoids or somatic cells from embryoid bodies (EBs; negative control). Horizontal bars represent the mean percentage for each condition. At least n=6 measurements were taken from independent experiments for each condition. Total number of cells counted (double DAZL and tdTomato positive/tdTomato positive cells) per condition shown between brackets. T-test: #p-value <0.05. (D) Immunofluorescence of DAZL on sections of co-cultures of somatic cells from embryoid bodies with NANOS3−tdTomato resetting (tt2iGöXAV) hPGCLCs for 25 days. DAPI nuclear counterstain showed in blue. Scale bar, 50 um. (E) Two-dimensional principal component analysis (PC1 vs PC2 and PC1 vs PC3) and the respective gene loading plots for male weeks (w) 6 and 8 hPGCs, day 4 hPGCLCs, and hPGCLCs co-cultured with human hindgut organoids (HG) or mouse female gonadal somatic cells (E13.5F). Duration of co-cultures in days (d) is indicated. hPGCLCs were specified from peri-gastrulation (4i and PreME), resetting tt2iGöXAV, or resetting HENSM precursors. Arrows show the potential progression trajectories. See also Figures S3, S4, S11, and S12.
Figure 5
Figure 5. EOMES and TBXT requirements for resetting hPGCLC specification
(A) Schematic diagram for hPGCLC specification experiments from EOMES, TBXT, and EOMES/TBXT knockout (KO) peri-gastrulation (4i and PreME) and resetting (tt2iGöXAV and HENSM) precursors. (B) Two-dimensional principal component analysis (PC1 vs PC2) for wildtype, EOMES knockout (KO), and TBXT knockout (TKO) day 4 hPGCLCs specified from peri-gastrulation (4i and PreME), resetting tt2iGöXAV, resetting HENSM, or capacitating (cap) precursors. (C) Efficiency of hPGCLC induction (% of hPGCLCs in day 4 embryoid bodies) from peri-gastrulation (4i and PreME) and resetting (tt2iGöXAV and HENSM) precursors for four genetic backgrounds (parental (W15), EOMES (EKO), TBXT (TKO), and EOMES/TBXT (ETKO) knockouts), measured by the co-expression of NANOS3−tdTomato and TNAP on flow cytometry analysis. Horizontal bars represent the mean percentage for condition. At least n=7 measurements were taken from independent experiments and for each condition. (D) Immunofluorescence of OCT4, SOX17, NANOG and BLIMP1 on sections from day 4 embryoid bodies containing rhPGCLCs expressing NANOS3−tdTomato specified from EOMES knockout (KO) resetting hESCs (tt2iGöXAV, clone 1.7). DAPI nuclear counterstain showed in blue. Scale bar, 50 um. (E) Immunofluorescence of DAZL on sections from day 25 human hindgut organoid (HG) co-cultures containing rhPGCLCs expressing NANOS3−tdTomato specified from EOMES knockout (EKO) resetting hESCs (tt2iGöXAV, clones 1.7 and 1.18). DAPI nuclear counterstain showed in blue. Scale bar, 50 um. (F) Percentage of DAZL positive tt2iGöXAV rhPGCLCs [wildtype and EOMES knockout (EKO)] out of NANOS3-tdTomato positive hPGCLCs in day 25 human hindgut organoid (HG) co-cultures. Horizontal bars represent the mean percentage for each condition. At least n=4 measurements were taken from independent experiments and for each condition. Total number of cell counted (double DAZL and tdTomato positive/tdTomato positive cells) per condition shown between brackets. See also Figures S3, S4, S13, S14, S15, and S16.
Figure 6
Figure 6. Contribution of TBXT over expression to rescue EOMES/TBXT double knockout phenotype in resetting hPGCLC specification
(A) Schematic diagram for TBXT rescue experiment. (B) Efficiency of hPGCLC induction (% of hPGCLCs in day 4 embryoid bodies) from HENSM resetting hESCS in three different genetic backgrounds (parental (W15), EOMES/TBXT double knockout (ETKO), and DOX-inducible TBXT transgene on an ETKO background (ETKO-TOE)), under the absence or presence of DOX, measured by the co-expression of NANOS3−tdTomato and TNAP on flow cytometry analysis. Efficiency of hPGCLC induction from EOMES knockout (EKO) HENSM resetting hESCS, in the absence of DOX is also included (data from Figure 5C). Horizontal bars represent the mean percentage for each condition. At least n=4 measurements were taken from independent experiments and for each condition. (C) Day 4 embryoid bodies generated from parental (W15), EOMES/TBXT double knockout (ETKO), and DOX-inducible TBXT transgene on an ETKO background (ETKO-TOE) NANOS3−tdTomato hESCs cultured in resetting (HENSM) conditions, under the absence or presence of DOX. Scale bar: 200 um. (D) Flow cytometry analysis plots showing the percentage of hPGCLCs co-expressing NANOS3−tdTomato and TNAP in day 4 embryoid bodies generated from HENSM resetting hESCS in three different genetic backgrounds (parental (W15), EOMES/TBXT double knockout (ETKO), and DOX-inducible TBXT transgene on an ETKO background (ETKO-TOE)), under the absence or presence of DOX.
Figure 7
Figure 7. Schematic diagram for in vitro protocols of hPGCLC specification and in vivo hPGC development.
Double headed arrows delineate the edges of the spectrum for hPGCLC specification in vitro and suggest a window for hPGC specification in vivo (E11-E17). The three blocks of cells represent the possibility of a temporally asynchronous epiblast, constituted by a decreasing ratio of early post-implantation epiblast precursors (modelled by in vitro resetting cells) and an increased ratio of peri-gastrulation precursors (modelled by in vitro peri-gastrulation cells), along early post implantation developmental time. Resetting hPGCLCs specification requires both TBXT and EOMES, while peri-gastrulation hPGCLCs rely exclusively on EOMES to be specified. Resetting hPGCLCs progress faster than peri-gastrulation hPGCLCs, and at a tempo similar to that observed in vivo. Elements of the diagram were adapted from Tang et al, 2016 .

References

    1. Ohinata Y, Ohta H, Shigeta M, Yamanaka K, Wakayama T, Saitou M. A Signaling Principle for the Specification of the Germ Cell Lineage in Mice. Cell. 2009;137:571–584. - PubMed
    1. Ohinata Y, Payer B, O’Carroll D, Ancelin K, Ono Y, Sano M, Barton SC, Obukhanych T, Nussenzweig M, Tarakhovsky A, et al. Blimp1 is a critical determinant of the germ cell lineage in mice. Nature. 2005;436:207–213. - PubMed
    1. Ying Y, Zhao G-Q. Cooperation of Endoderm-Derived BMP2 and Extraembryonic Ectoderm-Derived BMP4 in Primordial Germ Cell Generation in the Mouse. Developmental Biology. 2001;232:484–492. - PubMed
    1. Hayashi K, Ohta H, Kurimoto K, Aramaki S, Saitou M. Reconstitution of the Mouse Germ Cell Specification Pathway in Culture by Pluripotent Stem Cells. Cell. 2011;146:519–532. - PubMed
    1. Aramaki S, Hayashi K, Kurimoto K, Ohta H, Yabuta Y, Iwanari H, Mochizuki Y, Hamakubo T, Kato Y, Shirahige K, Saitou M. A Mesodermal Factor, T, Specifies Mouse Germ Cell Fate by Directly Activating Germline Determinants. Developmental Cell. 2013;27:516–529. - PubMed

Publication types

LinkOut - more resources