. 2023 Jan 31;42(1):111962.
doi: 10.1016/j.celrep.2022.111962. Epub 2023 Jan 4.

Lateral entorhinal cortex inputs modulate hippocampal dendritic excitability by recruiting a local disinhibitory microcircuit

Affiliations

Lateral entorhinal cortex inputs modulate hippocampal dendritic excitability by recruiting a local disinhibitory microcircuit

Olesia M Bilash et al. Cell Rep. .

Abstract

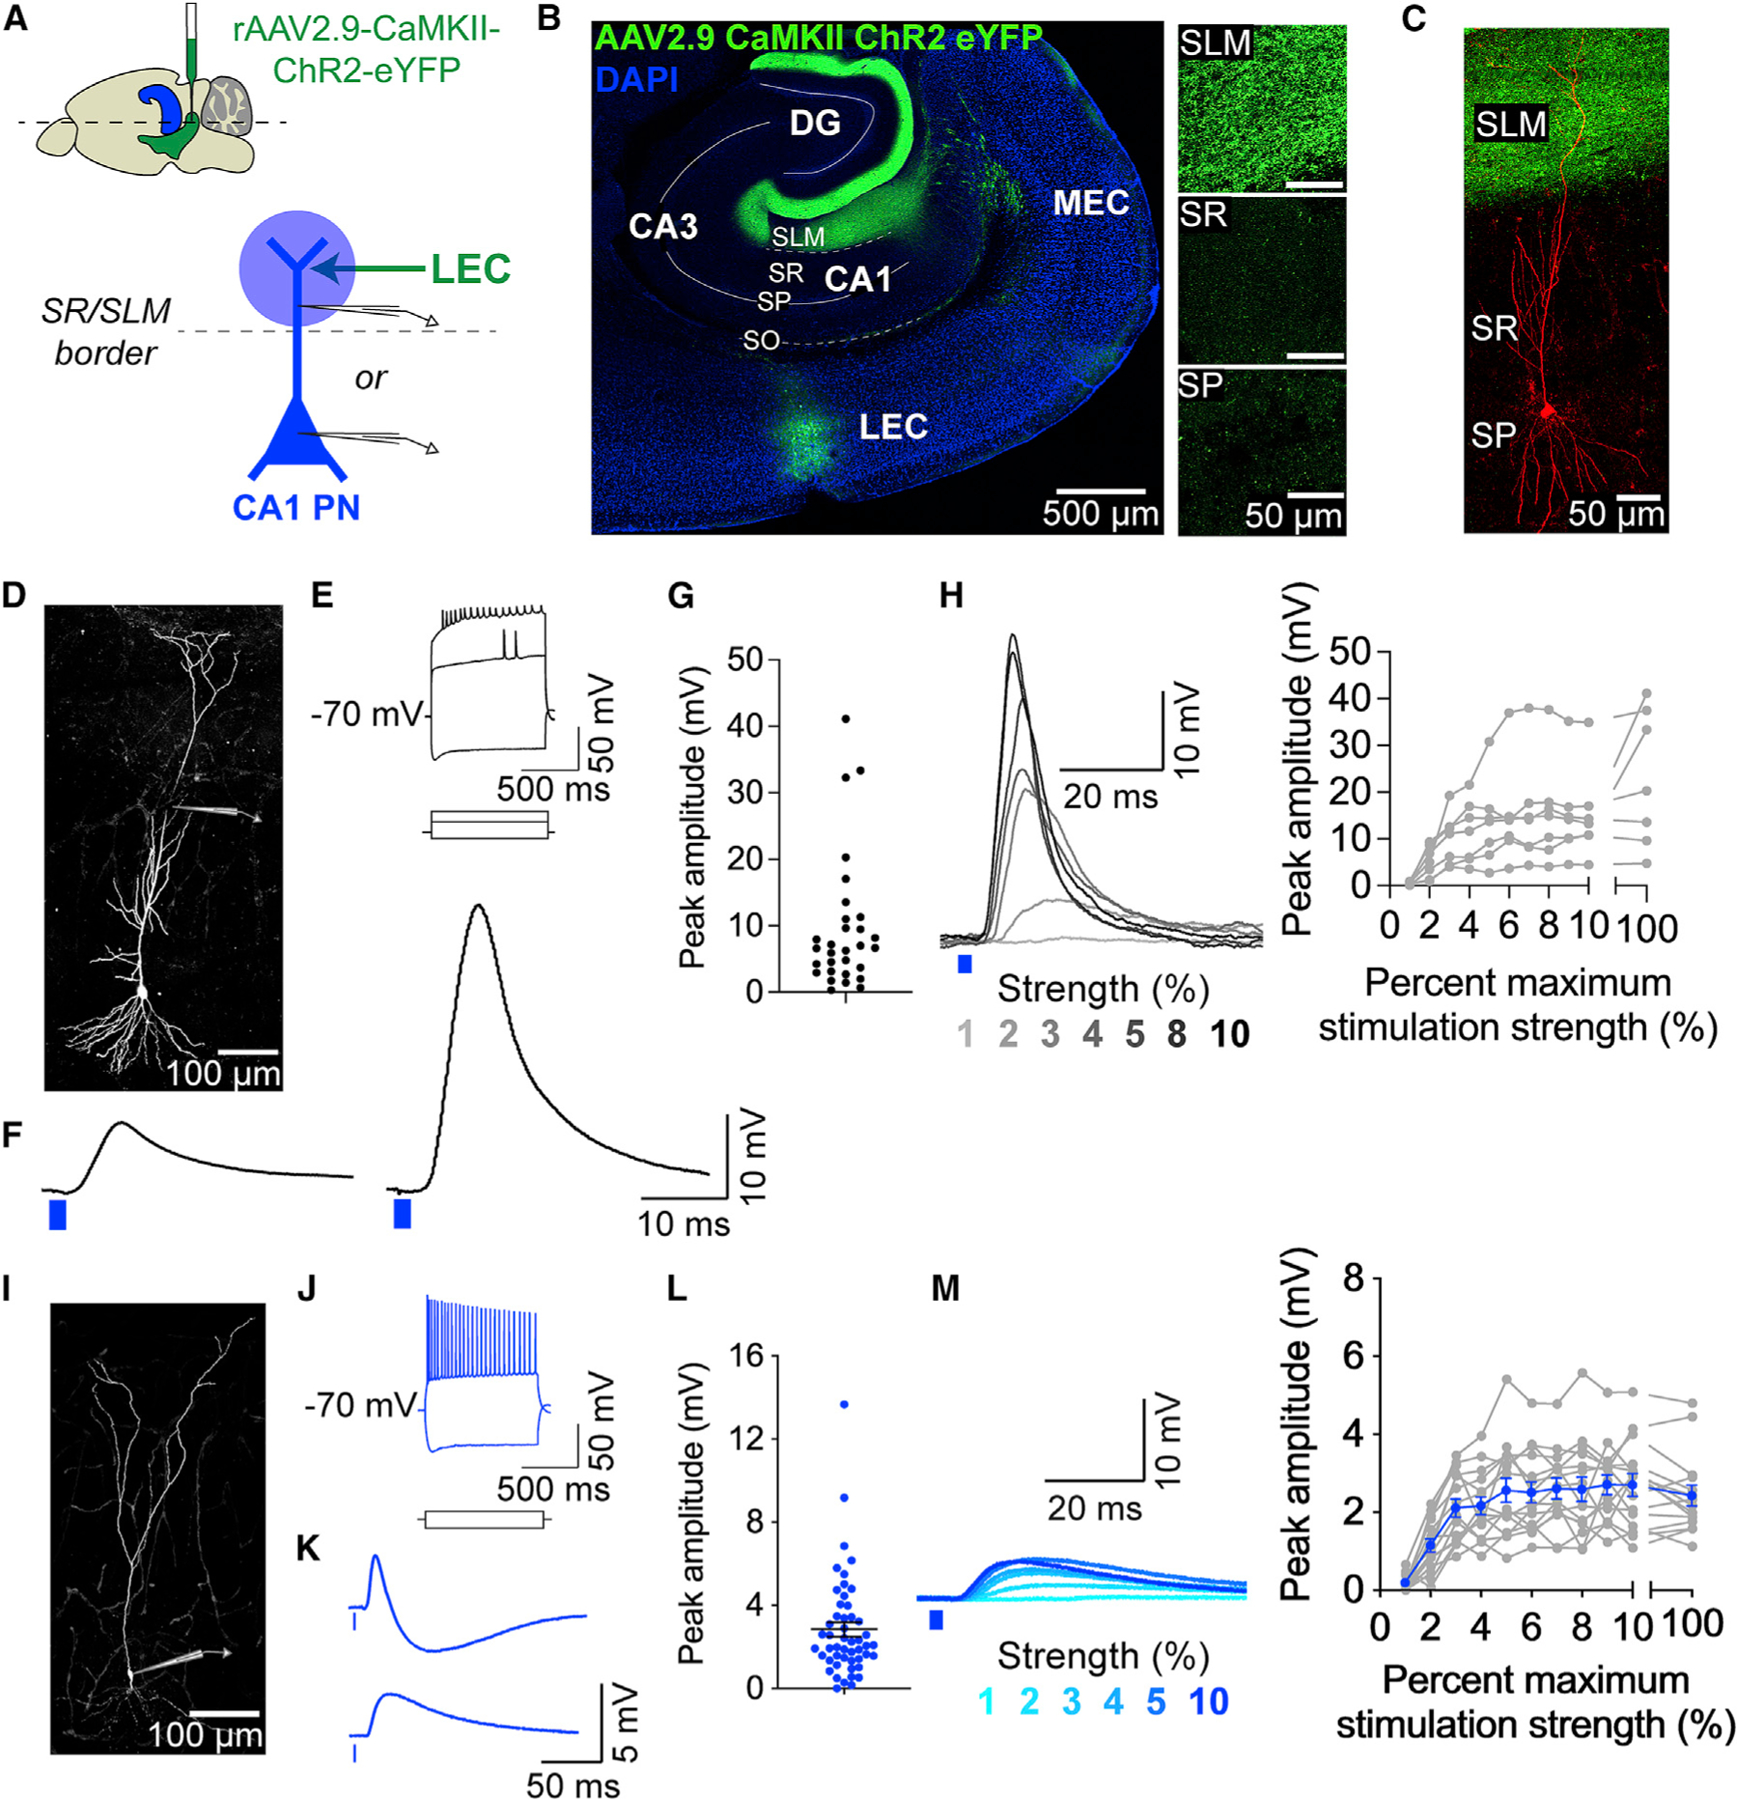
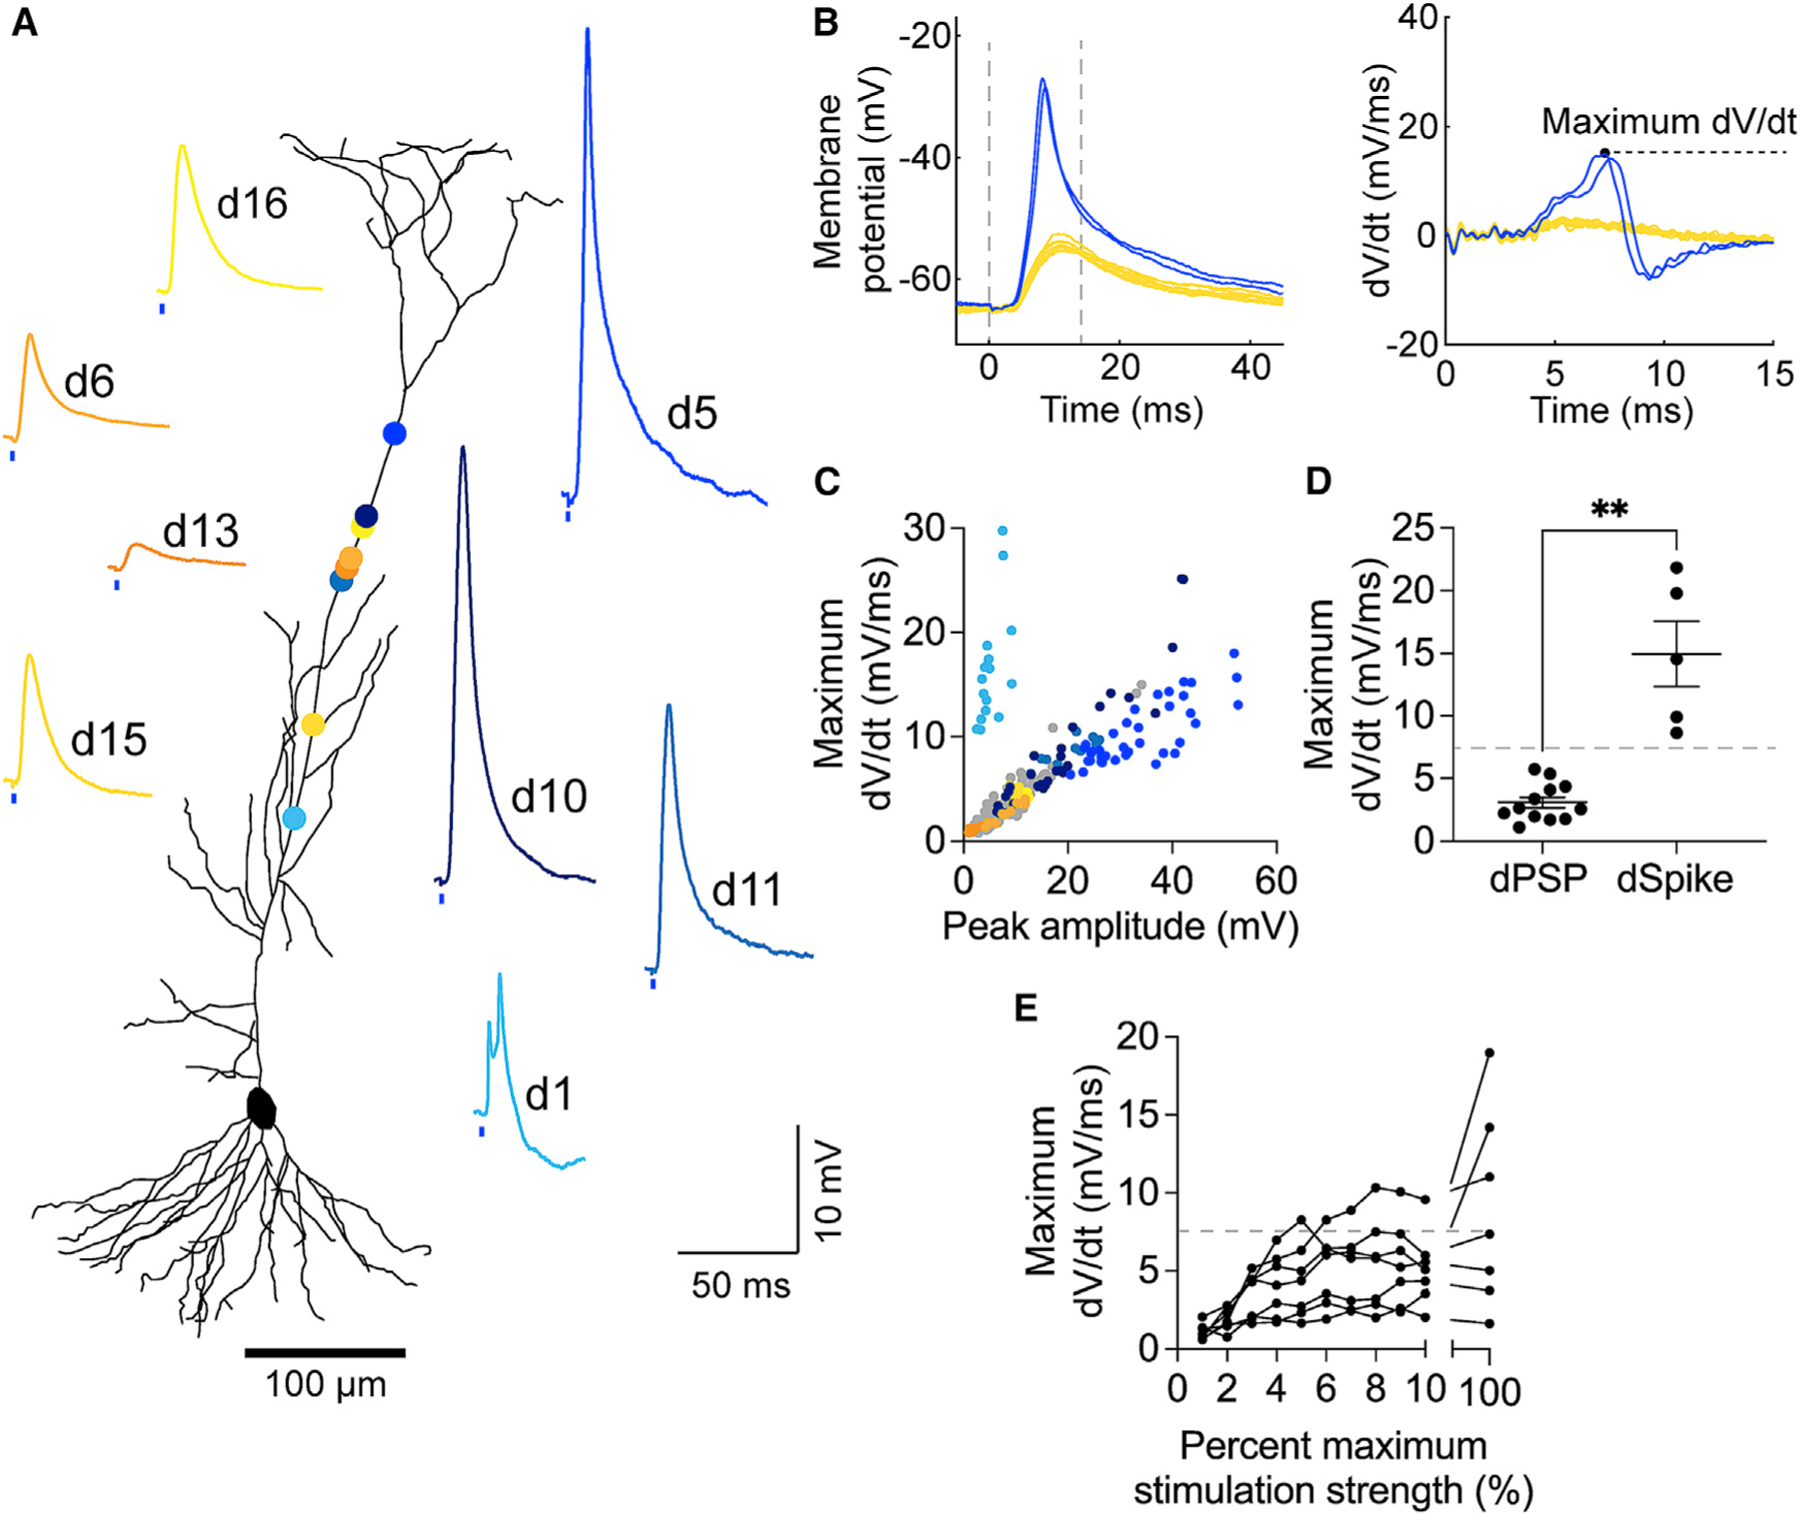
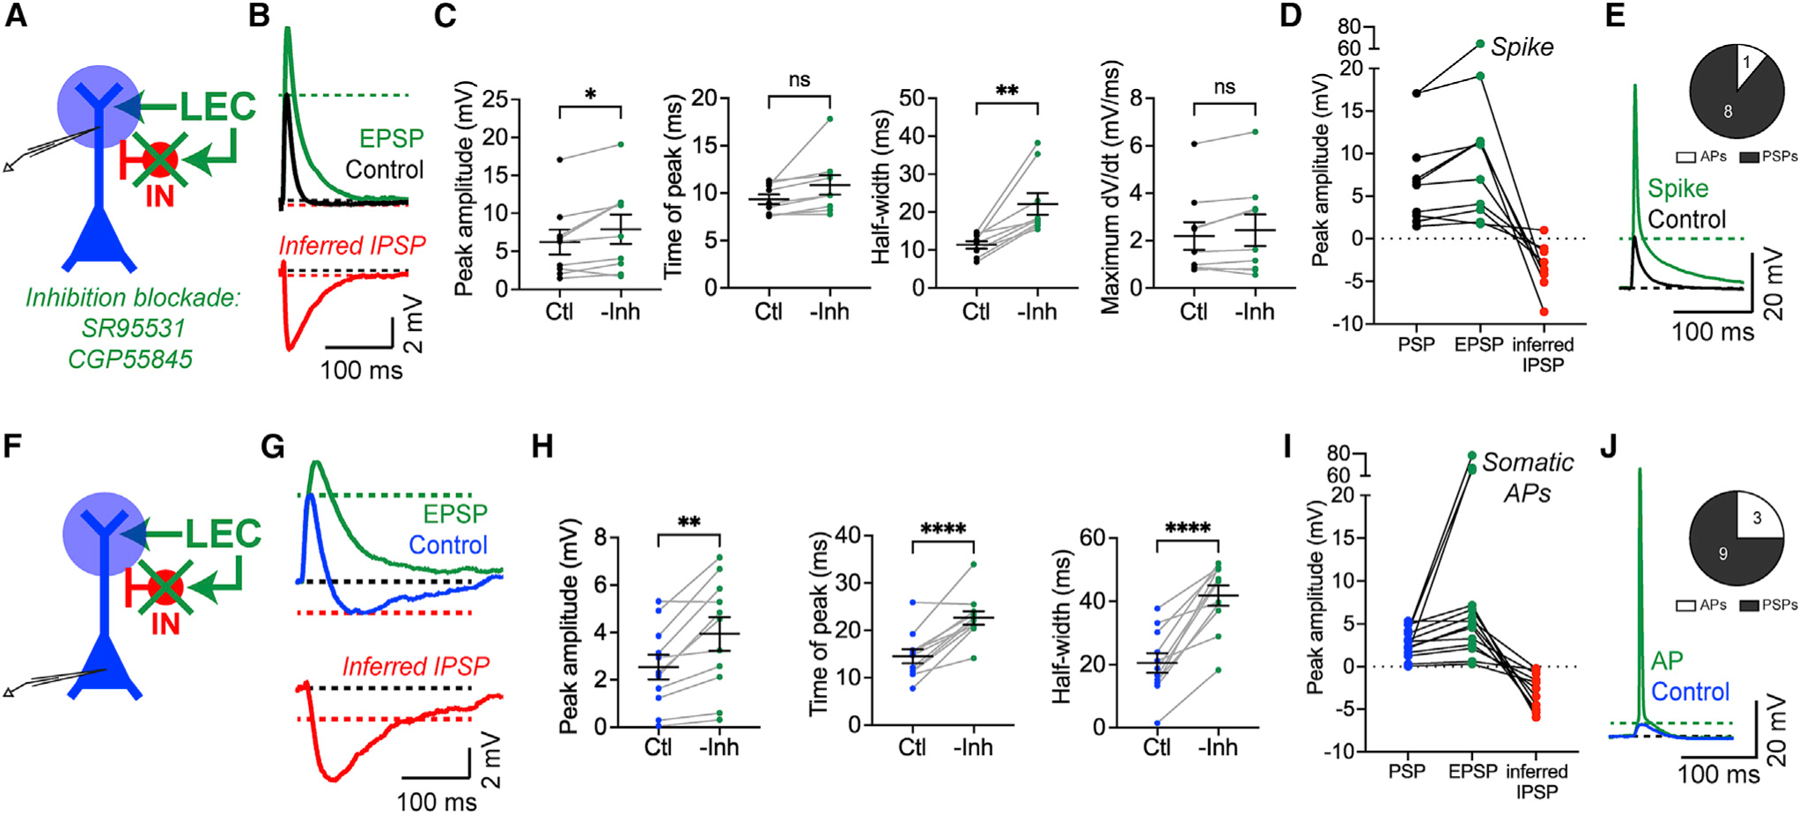
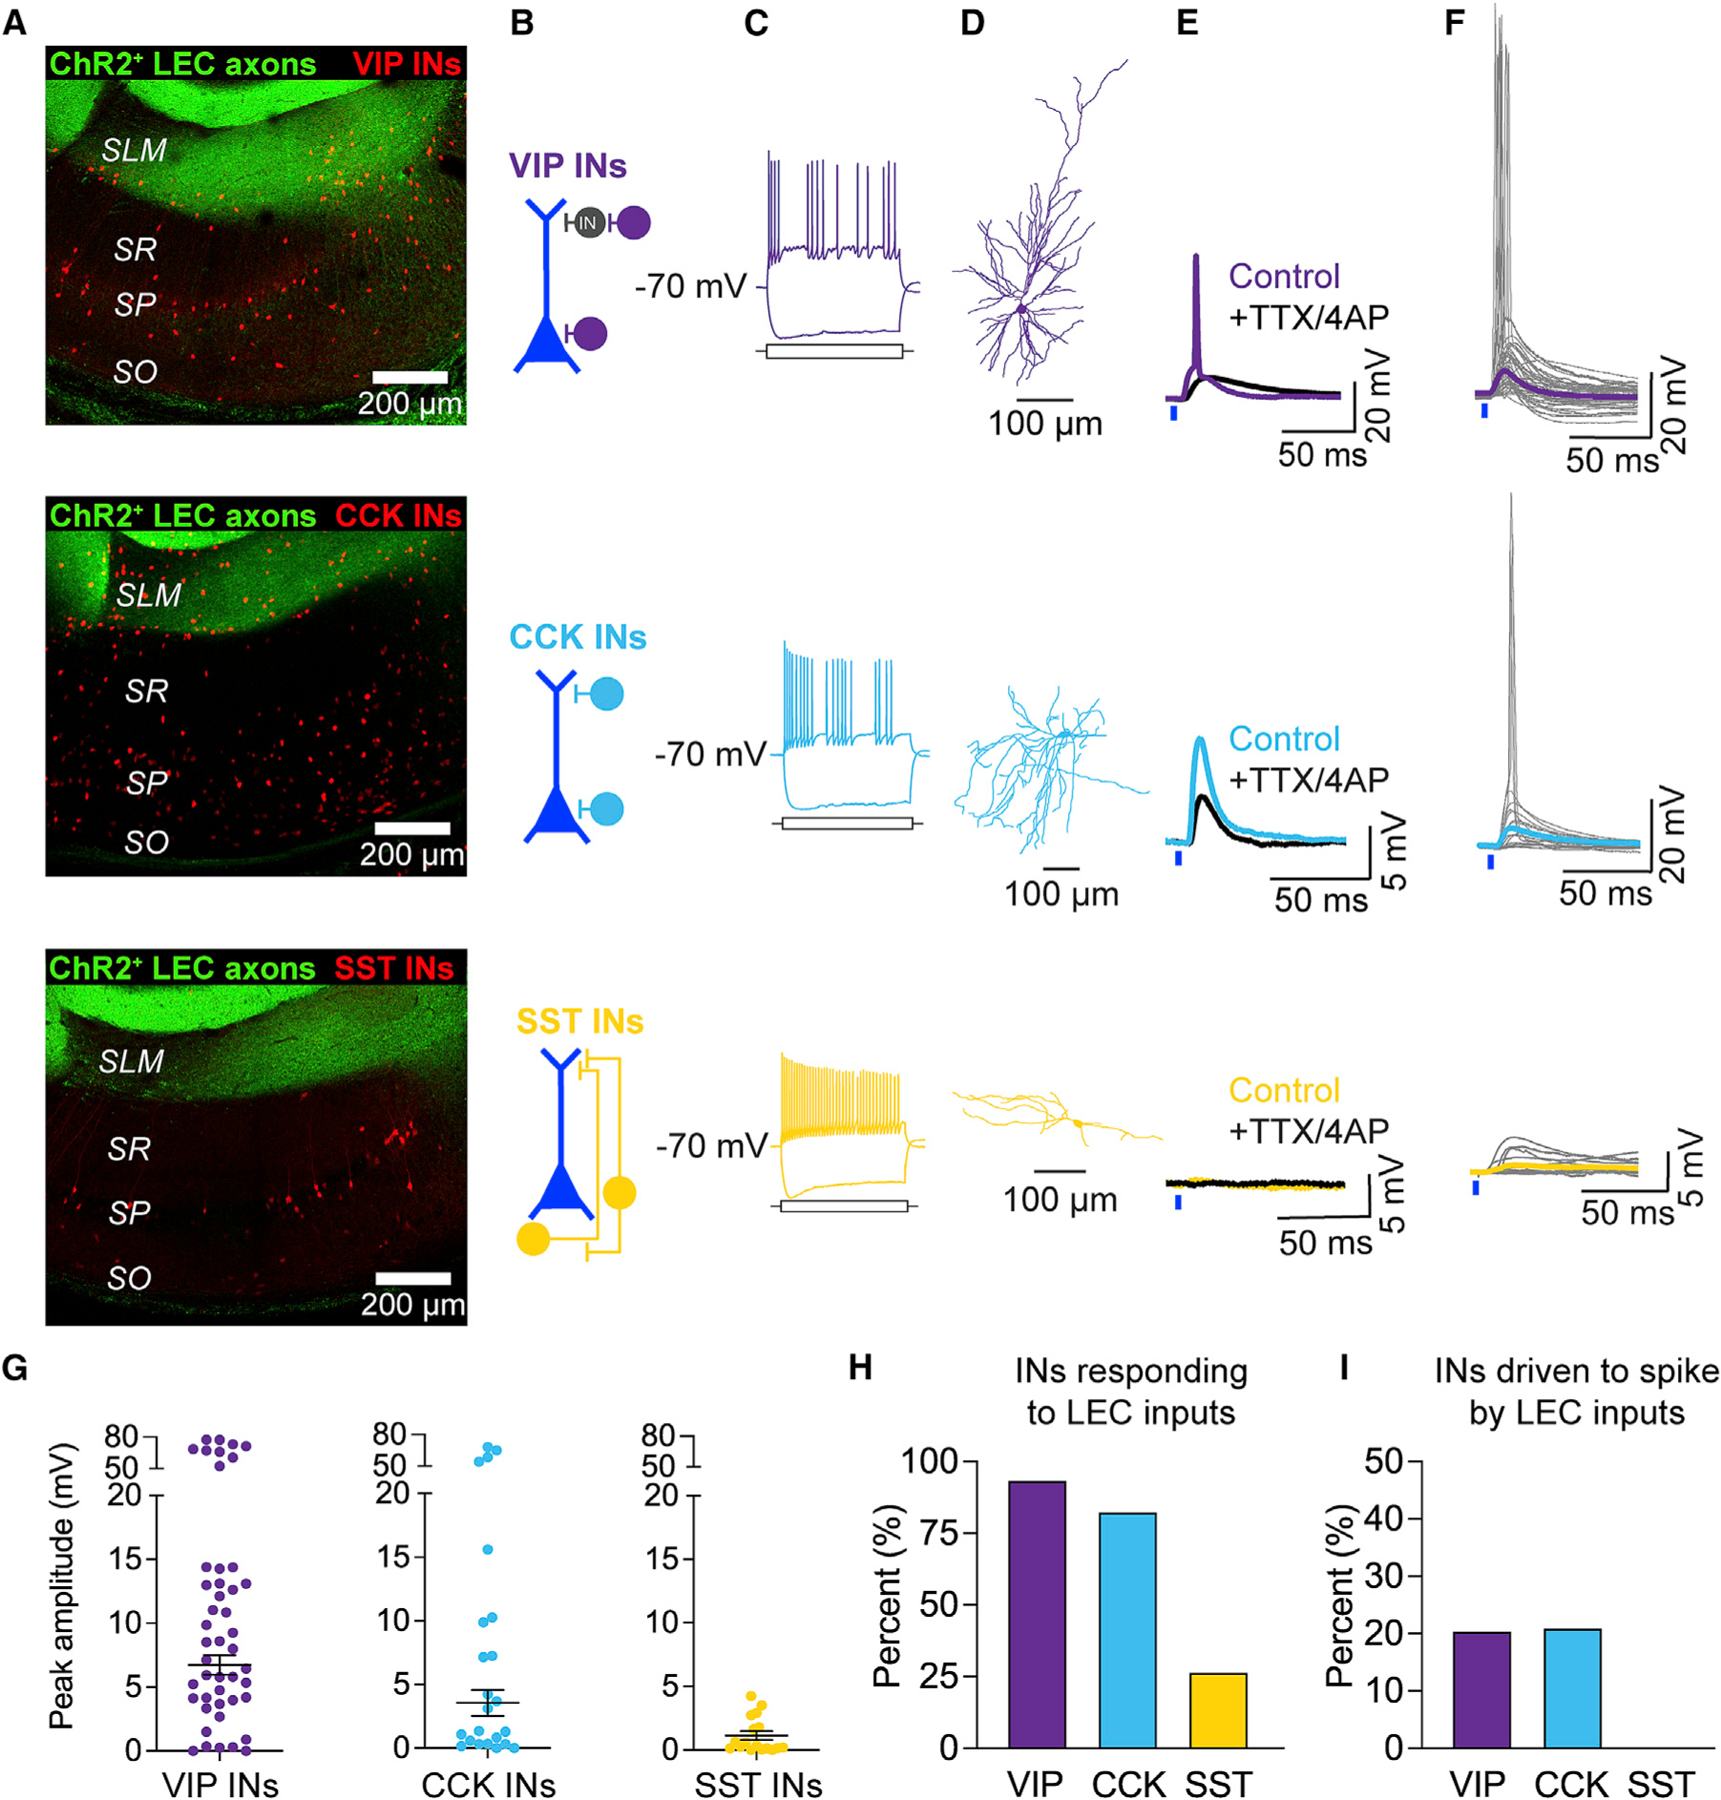
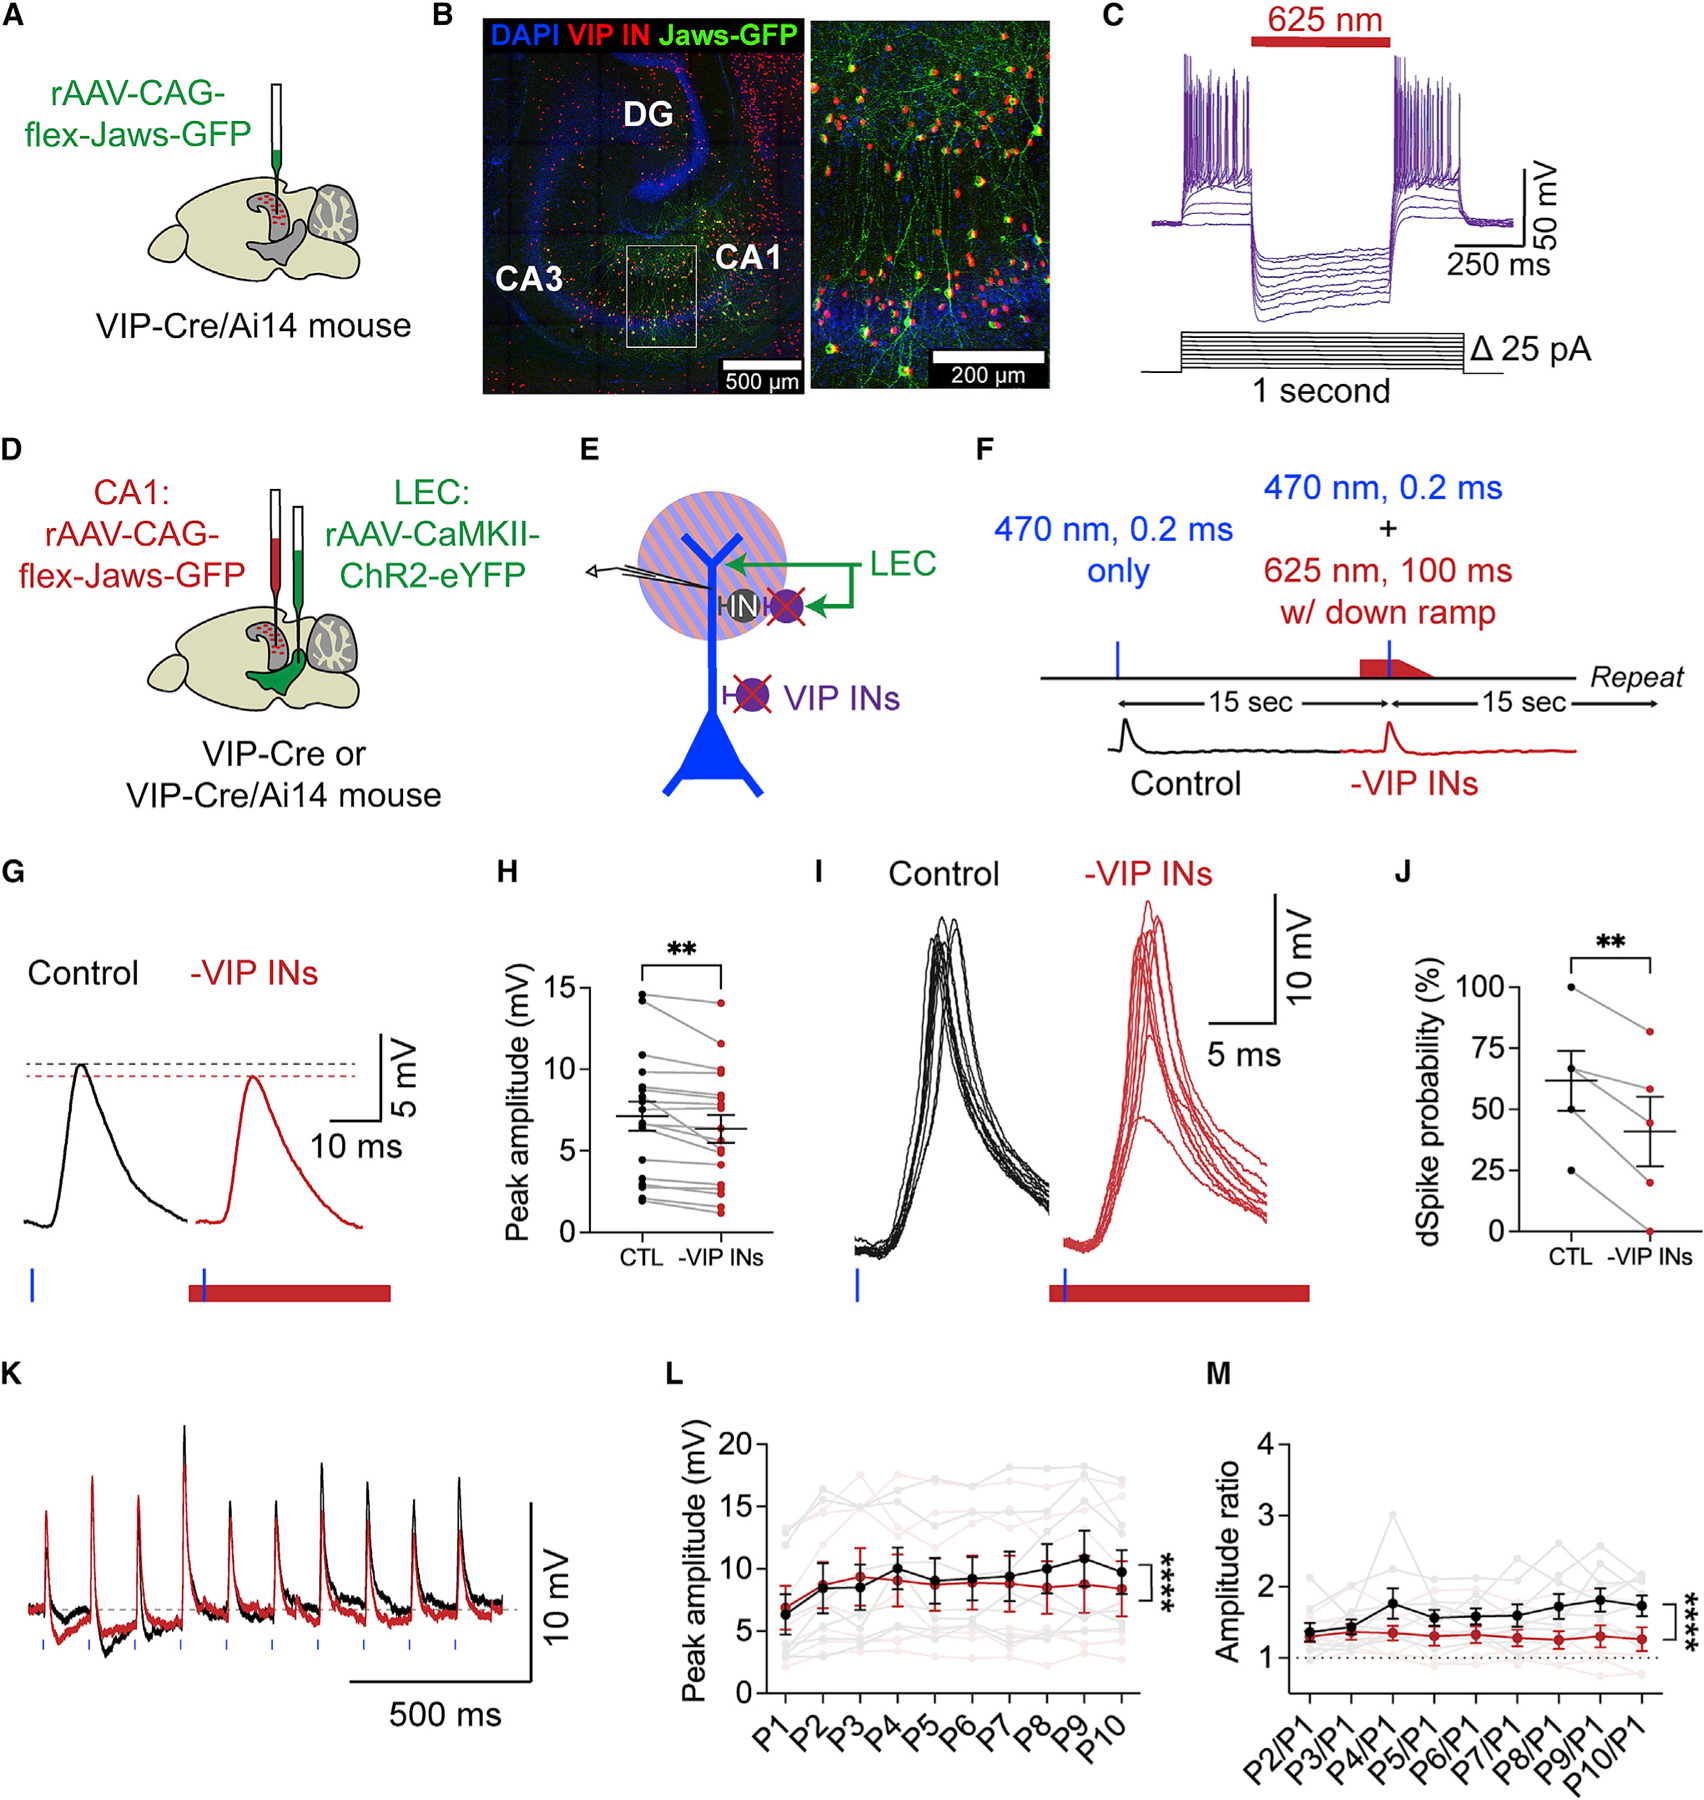
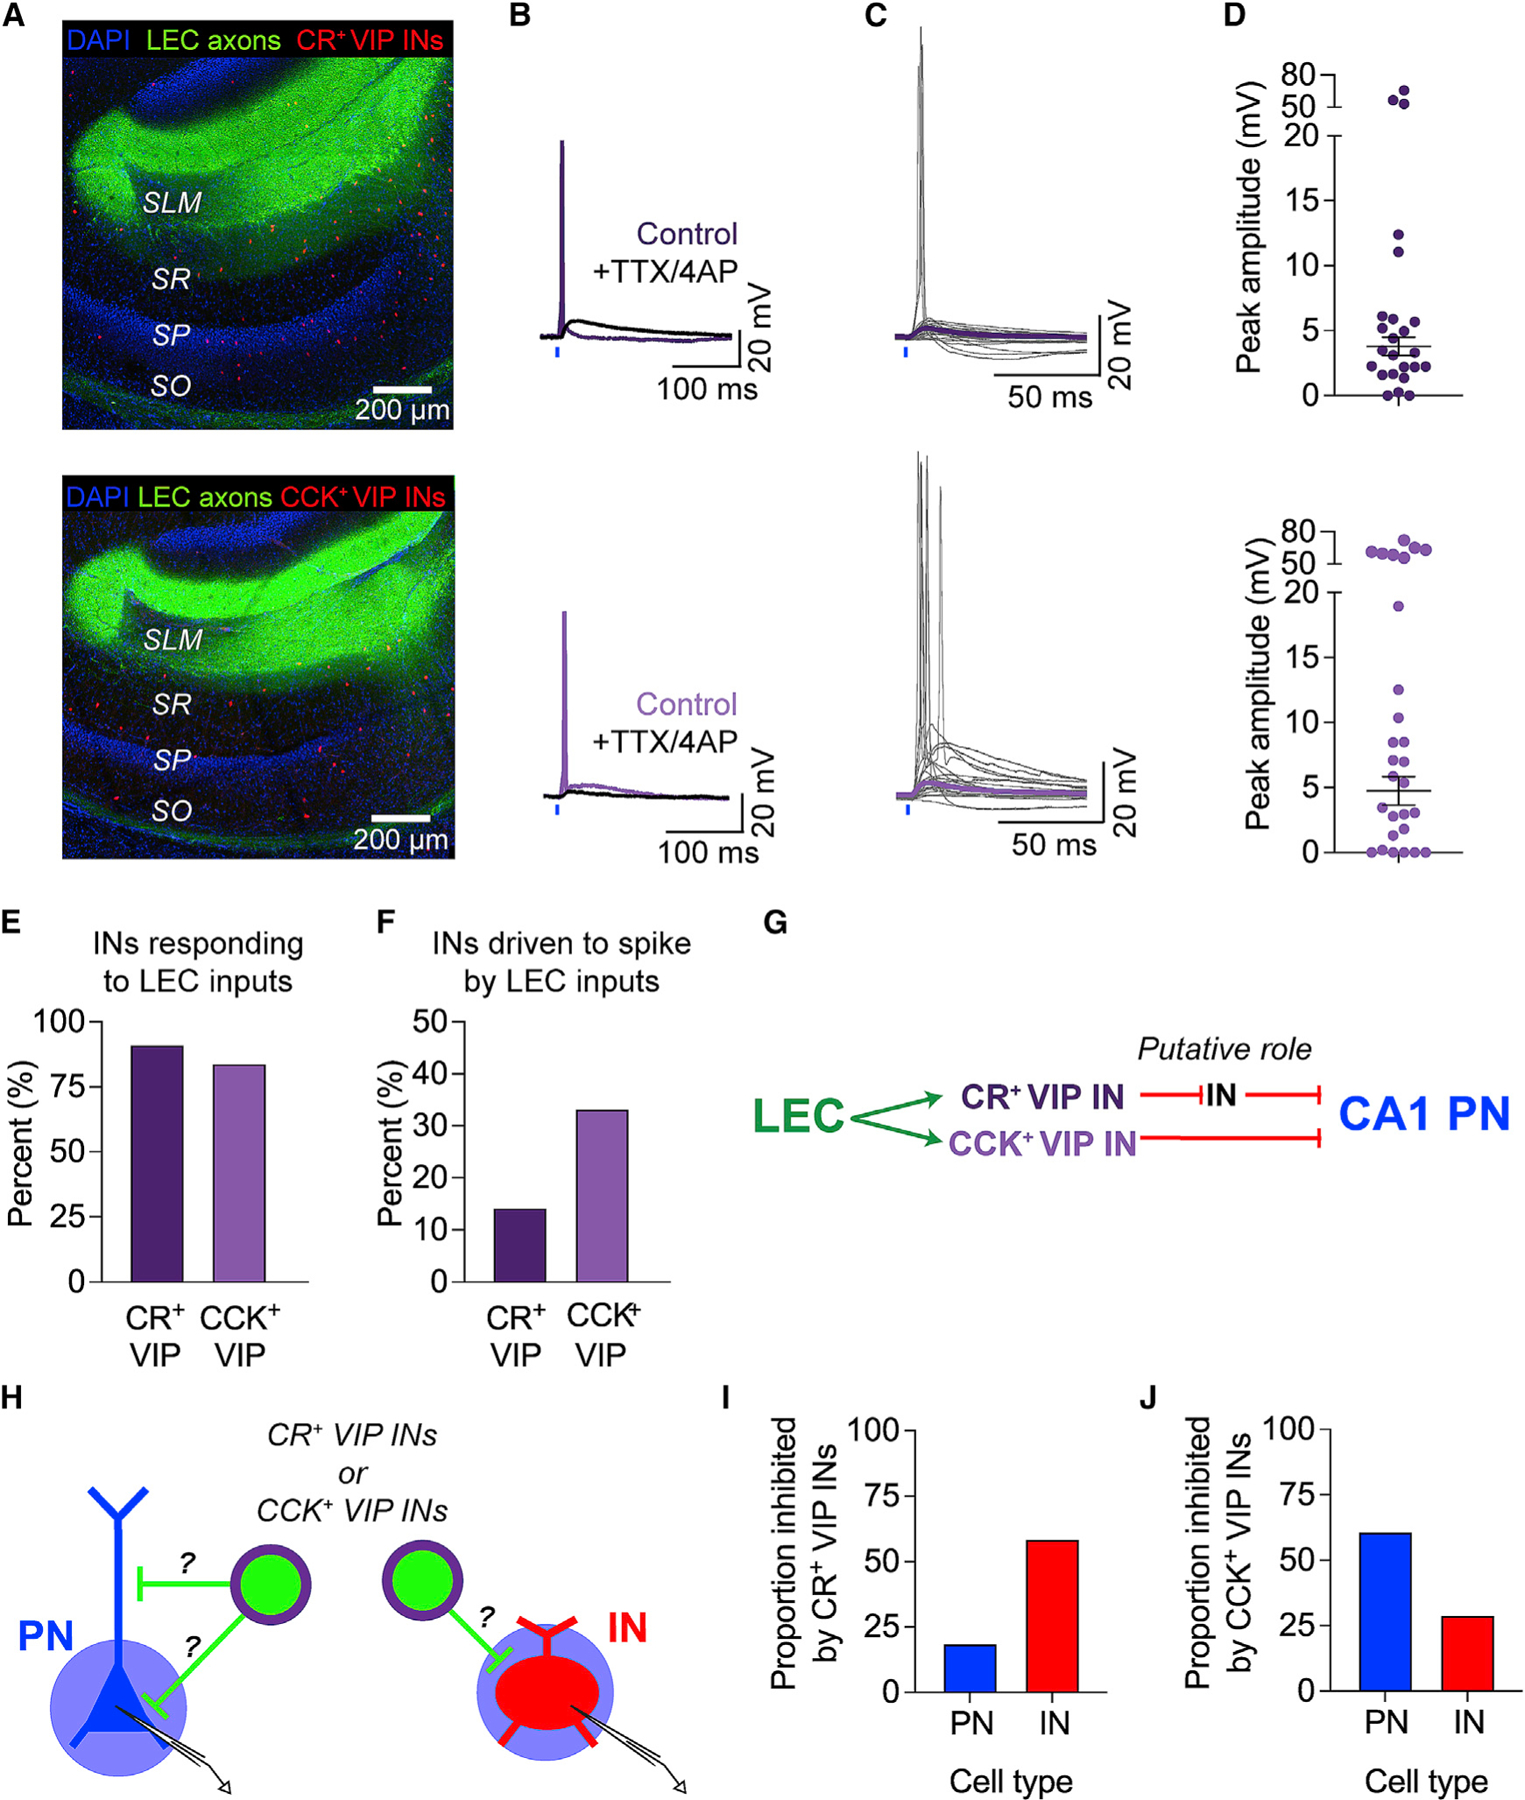
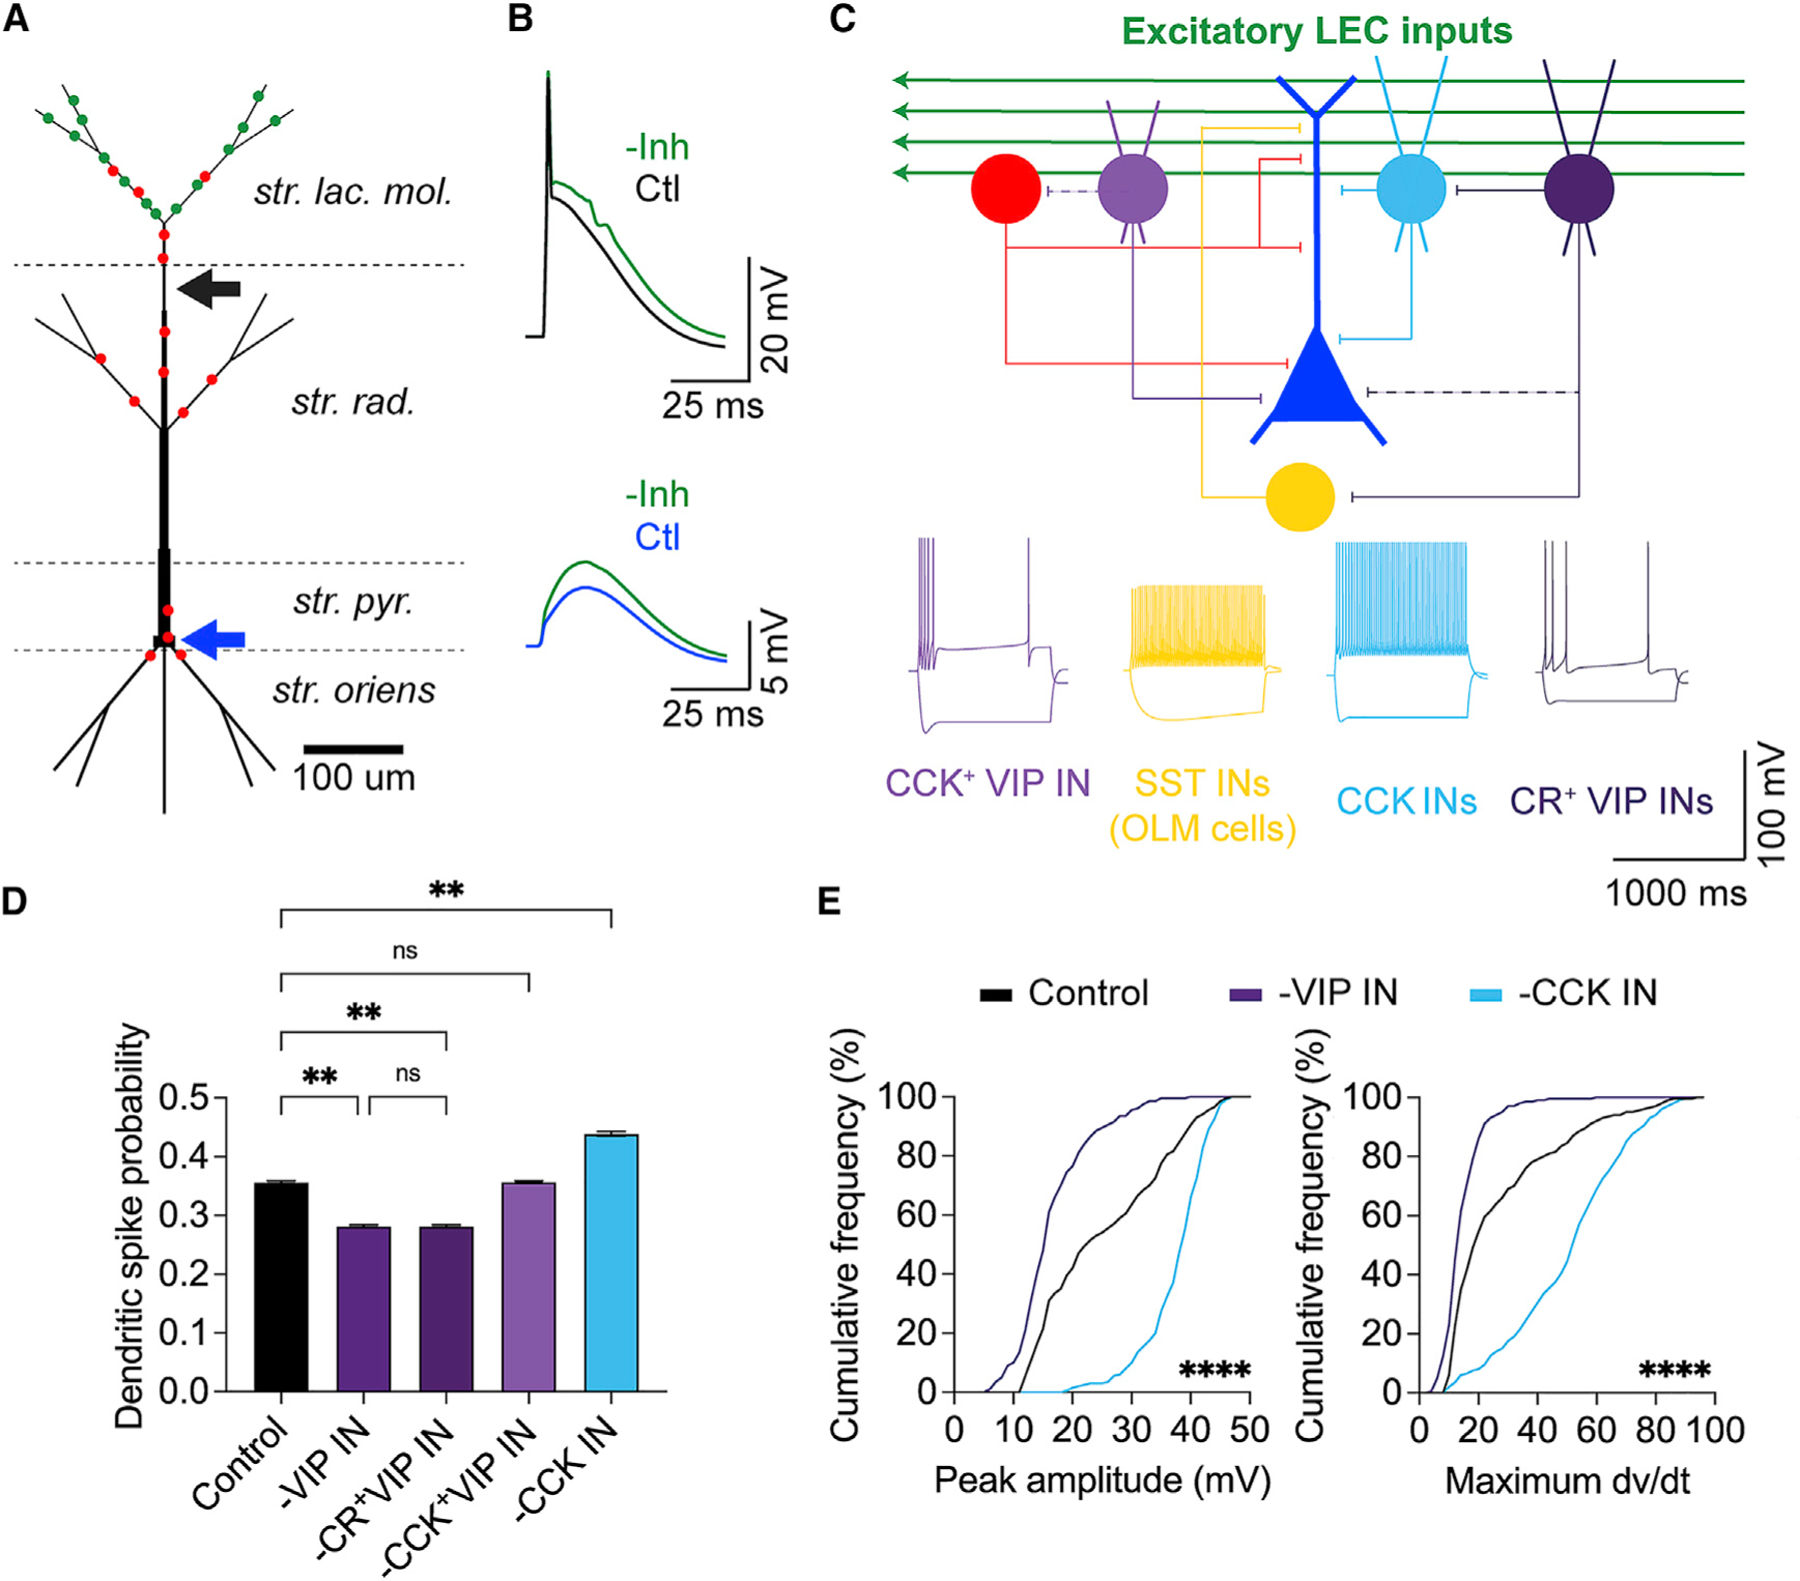
The lateral entorhinal cortex (LEC) provides multisensory information to the hippocampus, directly to the distal dendrites of CA1 pyramidal neurons. LEC neurons perform important functions for episodic memory processing, coding for contextually salient elements of an environment or experience. However, we know little about the functional circuit interactions between the LEC and the hippocampus. We combine functional circuit mapping and computational modeling to examine how long-range glutamatergic LEC projections modulate compartment-specific excitation-inhibition dynamics in hippocampal area CA1. We demonstrate that glutamatergic LEC inputs can drive local dendritic spikes in CA1 pyramidal neurons, aided by the recruitment of a disinhibitory VIP interneuron microcircuit. Our circuit mapping and modeling further reveal that LEC inputs also recruit CCK interneurons that may act as strong suppressors of dendritic spikes. These results highlight a cortically driven GABAergic microcircuit mechanism that gates nonlinear dendritic computations, which may support compartment-specific coding of multisensory contextual features within the hippocampus.

Keywords: CP: Neuroscience; GABAergic interneurons; circuit interactions; computational model; dendrites; entorhinal cortex; excitation-inhibition balance; functional circuit mapping; hippocampus; memory; optogenetics.


Conflict of interest statement

Declaration of interests The authors declare no competing interests.

Figures

Figure 1.
Figure 1.. LEC inputs provide direct excitation to CA1 pyramidal neuron compartments
(A) Experimental design. Top: LEC injection site (green) and hippocampus (blue) in a mouse brain (sagittal view). Bottom: Photostimulation (blue circle) of ChR2+ LEC axons (green arrow) during whole-cell recordings from a CA1 PN (blue) dendrite or soma. (B) Confocal image of a horizontal brain slice demonstrating the LEC injection site and LEC axons in the hippocampus (green) and in various CA1 layers (right). (C) Confocal image of a patched CA1 PN (red) surrounded by LEC axons. The PN was filled with biocytin and counterstained with streptavidin-AF647. (D–H) LEC-driven dendritic responses from CA1 PNs. (D) Example CA1 PN, patched at the dendrite (cartoon pipette). Counterstained as in (C). (E) Example electrophysiological properties of a CA1 PN distal dendrite, measured in response to dendritic current injections (700, 400, −325 pA). The membrane potential was maintained at −70 mV. (F) Example LEC-driven dendritic post-synaptic responses, showing putative subthreshold (left) and suprathreshold (right) dendritic responses. (G) Peak amplitudes of LEC-driven dendritic responses. Total n = 17 dendrites, 16 slices, 13 mice. (H) Input-output transformation. Left: example LEC-driven dendritic responses (1%–10% maximum strength photostimulation). Putative suprathreshold response seen at 8% maximum photostimulation strength. Right: response amplitudes, including both sub- and suprathreshold responses. n = 7 dendrites, 7 slices, 7 mice. (I–M) LEC-driven somatic responses from CA1 PNs. (I) Same as (D) but patched at the soma. (J) Same as (E) but measured in the soma; 400 and −375 pA somatic currents injected. (K) Same as (F) but showing somatic PSPs. Two example responses shown: with (top) or without (bottom) a visible IPSP component. (L) Same as (G), but from the soma. Total n = 50 somata, 48 slices, 33 mice. (M) Same as (H), but from the soma. Data from individual somata are shown in gray. Mean ± SEM data are shown in blue. n = 15 pyramidal neuron somata, 14 slices, 11 mice.
Figure 2.
Figure 2.. Optogenetic stimulation of LEC inputs can drive dendritic spikes in CA1 pyramidal neurons
(A) Example LEC-driven dendritic responses, numbered in the order they were recorded (same dataset as in Figures 1D–1H). Putative dPSPs shown in yellow. Putative dSpikes shown in blue. Circle colors correspond to the dendritic recording sites. Neuronal morphology was reconstructed from the neuron in Figure 1D. (B) Left: example LEC-driven dSpikes (blue) and dPSPs (yellow). Right: corresponding derivative traces and maximum dV/dt value (dashed black line), shown from t = 0–15 ms (left graph, dashed gray line). (C) Peak amplitude versus maximum dV/dt values of every recorded LEC-driven dendritic response sweep. Data from the example dendrites are color codedasin (A). (D) Average maximum dV/dt values of LEC-driven dPSPs versus dSpikes (**p = 0.0097). Unpaired t test with Welch’s correction; n = 14 dPSPs and 5 dSpikes. Dashed line denotes the threshold dV/dt value (7.5 mV/ms). (E) Input-output transformation of the maximum dV/dt values, corresponding to Figure 1H dendrites. Some responses become suprathreshold with increased photostimulation strength.
Figure 3.
Figure 3.. LEC inputs recruit strong feedforward inhibition onto both compartments of CA1 PNs
(A) Experimental strategy. Photostimulation of LEC axons during whole-cell recordings from a CA1 PN dendrite as SR95531 and CGP55845 are perfused onto the brain slice to block inhibition (green x). (B) Example LEC-driven dendritic PSPs before (black, control) and after pharmacological inhibition blockade (green, EPSP). The inferred IPSP (red) was calculated post hoc from the two traces. (C) LEC-driven dendritic response parameters before and after inhibition blockade. Left to right: peak amplitude (*p = 0.025), time of peak (p = 0.0612 [ns]), half-width (**p = 0.0022), maximum dV/dt (p = 0.0866 [ns]). Paired t test; n = 9 dendrites. (D) LEC-driven dendritic PSP, EPSP, and inferred IPSP amplitudes. Total n = 9 dendrites, 9 slices, 5 mice. One dendrite spiked after inhibition blockade. (E) Example LEC-driven spike in the dendrite after inhibition blockade. Inset: response type after inhibition blockade. (F) Same as (A) but patched at the soma. (G) Same as (B) but with somatic PSPs. (H) Same as (C) but from somatic responses. Left to right: peak amplitude (**p = 0.0023), time of peak (****p < 0.0001), half-width (****p < 0.0001). Paired t test; n = 11 somata. (I) Same as (D) but from somatic responses. Total n = 12 somata, 12 slices, 9 mice. Three somata spiked after inhibition blockade. (J) Same as (E) but showing a somatic AP after inhibition blockade.
Figure 4.
Figure 4.. LEC inputs recruit VIP INs and CCK INs in CA1
(A–F) Top to bottom: VIP INs (purple), CCK INs (blue), SST INs (yellow). (A) Confocal images of hippocampal area CA1 with LEC axons (green) and tdTomato-labeled INs (red). VIP-Cre/Ai14, CCK-Cre/Dlx-Flp/Ai65, and SST-Cre/Ai14 mice were used. (B) Predominant location of the IN somata in CA1. (C) Example electrophysiological properties, generated similar to Figure 1E. VIP IN, 175 and −150; CCK IN, 100 and −200; SST IN, 175 and −250 pA somatic current injected. (D) Example neuronal morphologies. (E) Example LEC-driven responses before (color) and after (black) application of TTX and 4-AP. (F) All LEC-driven post-synaptic responses recorded in the INs. Traces from individual neurons are shown in gray. Average PSP (color) was calculated from subthreshold PSPs only. Total n = 46 VIP INs, 23 CCK INs, 15 SST INs. (G) LEC-driven postsynaptic response amplitudes. Mean ± SEM PSP amplitude is shown in black. (H) Percentage of INs that responded to LEC axon photostimulation. Total n = 46 VIP INs, 23 CCK INs, 15 SST INs. (I) Percentage of LEC-driven INs that exhibited LEC-driven APs; n = 44 VIP INs, 19 CCK INs, 4 SST INs.
Figure 5.
Figure 5.. Local VIP INs disinhibit LEC-driven dendritic spikes in CA1 PNs
(A) Injection strategy. Cre-dependent Jaws virus (green) is injected into area CA1 of a VIP-Cre/Ai14 mouse. (B) Confocal image of the hippocampus, demonstrating the CA1 injection site (left) and expression of Jaws-GFP (green) in tdTomato+ VIP INs (red) (right inset). (C) Example trace illustrating that 625 nm light photostimulation silences Jaws+ VIP INs in CA1. (D) Injection strategy. Co-injection of the Jaws virus into CA1 (now red) and ChR2 virus into LEC (green) in a VIP-Cre or VIP-Cre/Ai14 mouse. (E) Dual-color optogenetics strategy. Simultaneous activation of ChR2+ LEC axons (green) and silencing of local Jaws+ VIP INs (purple) while recording from a CA1 PN distal dendrite. Blue and red stripes represent photostimulation with 470 and 625 nm light, respectively. (F) Experimental strategy. LEC axons were photostimulated alone or with simultaneous silencing of VIP INs: 470 nm light, 0.2 ms, 20%–90% maximum strength; 625 nm light, 100 ms, maximum strength, starting earlier, ending with a down ramp. Control and –VIP INs conditions alternated every 15 s. (G) Example LEC-driven dPSPs before (black) and during (red) VIP IN silencing. Dotted lines indicate the respective peak amplitudes. (H) LEC-driven dPSP peak amplitudes before and during VIP IN silencing (**p = 0.0016). Paired t test; n = 18 dendrites, 18 slices, 13 mice. (I) Example LEC-driven dSpikes before (black) and during (red) VIP IN silencing. Multiple sweeps are shown to illustrate the varying LEC-driven responses in a spiking dendrite. (J) Dendritic spike probability before and during VIP IN silencing (**p = 0.0047). Paired t test; n = 5 dendrites, 5 slices, 4 mice. (K) Example LEC-driven dendritic responses after maximum-strength 8 Hz photostimulation before (black) and during (red) VIP IN silencing. (L and M) Peak amplitudes (L) and amplitude ratios (M) of LEC-driven dendritic responses after repeated photostimulation of LEC inputs before (black) and during (red) VIP IN silencing. Individual data are shown in faded colors. Mean ± SEM is shown in full opacity. Peak amplitudes (****p = 0.0312) and amplitude ratios (****p < 0.0001). Two-way ANOVA; n = 7 dendrites.
Figure 6.
Figure 6.. LEC inputs recruit both VIP IN subpopulations in CA1
(A–D) Top to bottom: CR+ VIP INs (dark), CCK+ VIP INs (light). (A) Confocal images of hippocampal area CA1 with LEC axons (green) and tdTomato-labeled INs (red). VIP-Flp/CR-Cre/Ai65 and VIP-Flp/CCK-Cre/Ai65 mice were used. (B) Example LEC-driven responses before (purple) and after (black) application of TTX and 4-AP. (C) All LEC-driven postsynaptic responses recorded in the INs. Traces from individual neurons are shown in gray. Average PSP (purple) was calculated from subthreshold PSPs only. Total n = 23 CR+ VIP INs, 25 CCK+ VIP INs. (D) All LEC-driven postsynaptic response amplitudes. Mean ± SEM PSP amplitude is shown in black. (E) Percentage of INs that responded to LEC axon photostimulation. Total n = 23 CR+ VIP INs, 25 CCK+ VIP INs. (F) Percentage of LEC-driven INs that exhibited LEC-driven APs. n = 21 CR+ VIP INs, 21 CCK+ VIP INs. (G) Proposed circuit diagram, based on our findings and the literature. (H) Experimental strategy. Photostimulation (blue circle) of CatCh+ VIP IN subtypes (green) during somatic voltage-clamp recordings from putative CA1 PNs (blue) and INs (red). Neurons were held at +10 mV to record IPSCs. (I) Proportion of neurons that were inhibited by CR+ VIP INs. Total n = 16 PNs and 29 INs tested. (J) Proportion of neurons that were inhibited by CCK+ VIP INs. Total n = 23 PNs and 31 INs tested.
Figure 7.
Figure 7.. Computational modeling suggests that CR+ VIP INs disinhibit and CCK INs inhibit dendritic activity
(A) Multicompartment CA1 PN model, receiving excitatory LEC inputs (green) and general inhibitory inputs (red). The dendritic recording site is indicated by a black arrow (300 μm from soma). The somatic recording site is indicated by a blue arrow. (B) Simulated LEC-driven dendritic (top) and somatic (bottom) responses in the CA1 PN before (black and blue, respectively) and after inhibition removal (green). (C) Model circuit schematic. LEC-driven CA1 PN (blue) surrounded by local GABAergic microcircuitry: general feedforward inhibition (red), CCK+ VIP IN (light purple), SST OLM IN (yellow), SR/SLM CCK IN (light blue), and CR+ VIP IN (dark purple). Weaker and/or less common connections are shown as dotted lines. Bottom: example electrophysiological properties of the model INs (see Figure S13 for details). (D) Dendritic spike probability after silencing LEC-driven INs. Dunn’s multiple comparisons test; n = 20 × 1,000 trials. (E) Cumulative frequency distributions of all simulated LEC-driven dendritic spike amplitudes (left) and maximum dV/dt values (right). Friedman test; n = 200 trials. **p < 0.01, ****p < 0.0001.

References

    1. Basu J, and Siegelbaum SA (2015). The corticohippocampal circuit, synaptic plasticity, and memory. Cold Spring Harb. Perspect. Biol 7, a021733. 10.1101/cshperspect.a021733. - DOI - PMC - PubMed
    1. Brun VH, Otnass MK, Molden S, Steffenach HA, Witter MP, Moser MB, and Moser EI (2002). Place cells and place recognition maintained by direct entorhinal-hippocampal circuitry. Science 296, 2243–2246. 10.1126/science.1071089. - DOI - PubMed
    1. Igarashi KM, Lu L, Colgin LL, Moser MB, and Moser EI (2014). Co-ordination of entorhinal-hippocampal ensemble activity during associative learning. Nature 510, 143–147. 10.1038/nature13162. - DOI - PubMed
    1. Kitamura T, Pignatelli M, Suh J, Kohara K, Yoshiki A, Abe K, and Tonegawa S (2014). Island cells control temporal association memory. Science 343, 896–901. 10.1126/science.1244634. - DOI - PMC - PubMed
    1. Remondes M, and Schuman EM (2004). Role for a cortical input to hippocampal area CA1 in the consolidation of a long-term memory. Nature 431, 699–703. 10.1038/nature02965. - DOI - PubMed

Publication types

MeSH terms

LinkOut - more resources