. 2023 Jun:256:56-72.
doi: 10.1016/j.trsl.2023.01.002. Epub 2023 Jan 12.

Genetically engineered human pituitary corticotroph tumor organoids exhibit divergent responses to glucocorticoid receptor modulators

Affiliations

Genetically engineered human pituitary corticotroph tumor organoids exhibit divergent responses to glucocorticoid receptor modulators

Saptarshi Mallick et al. Transl Res. 2023 Jun.

Abstract

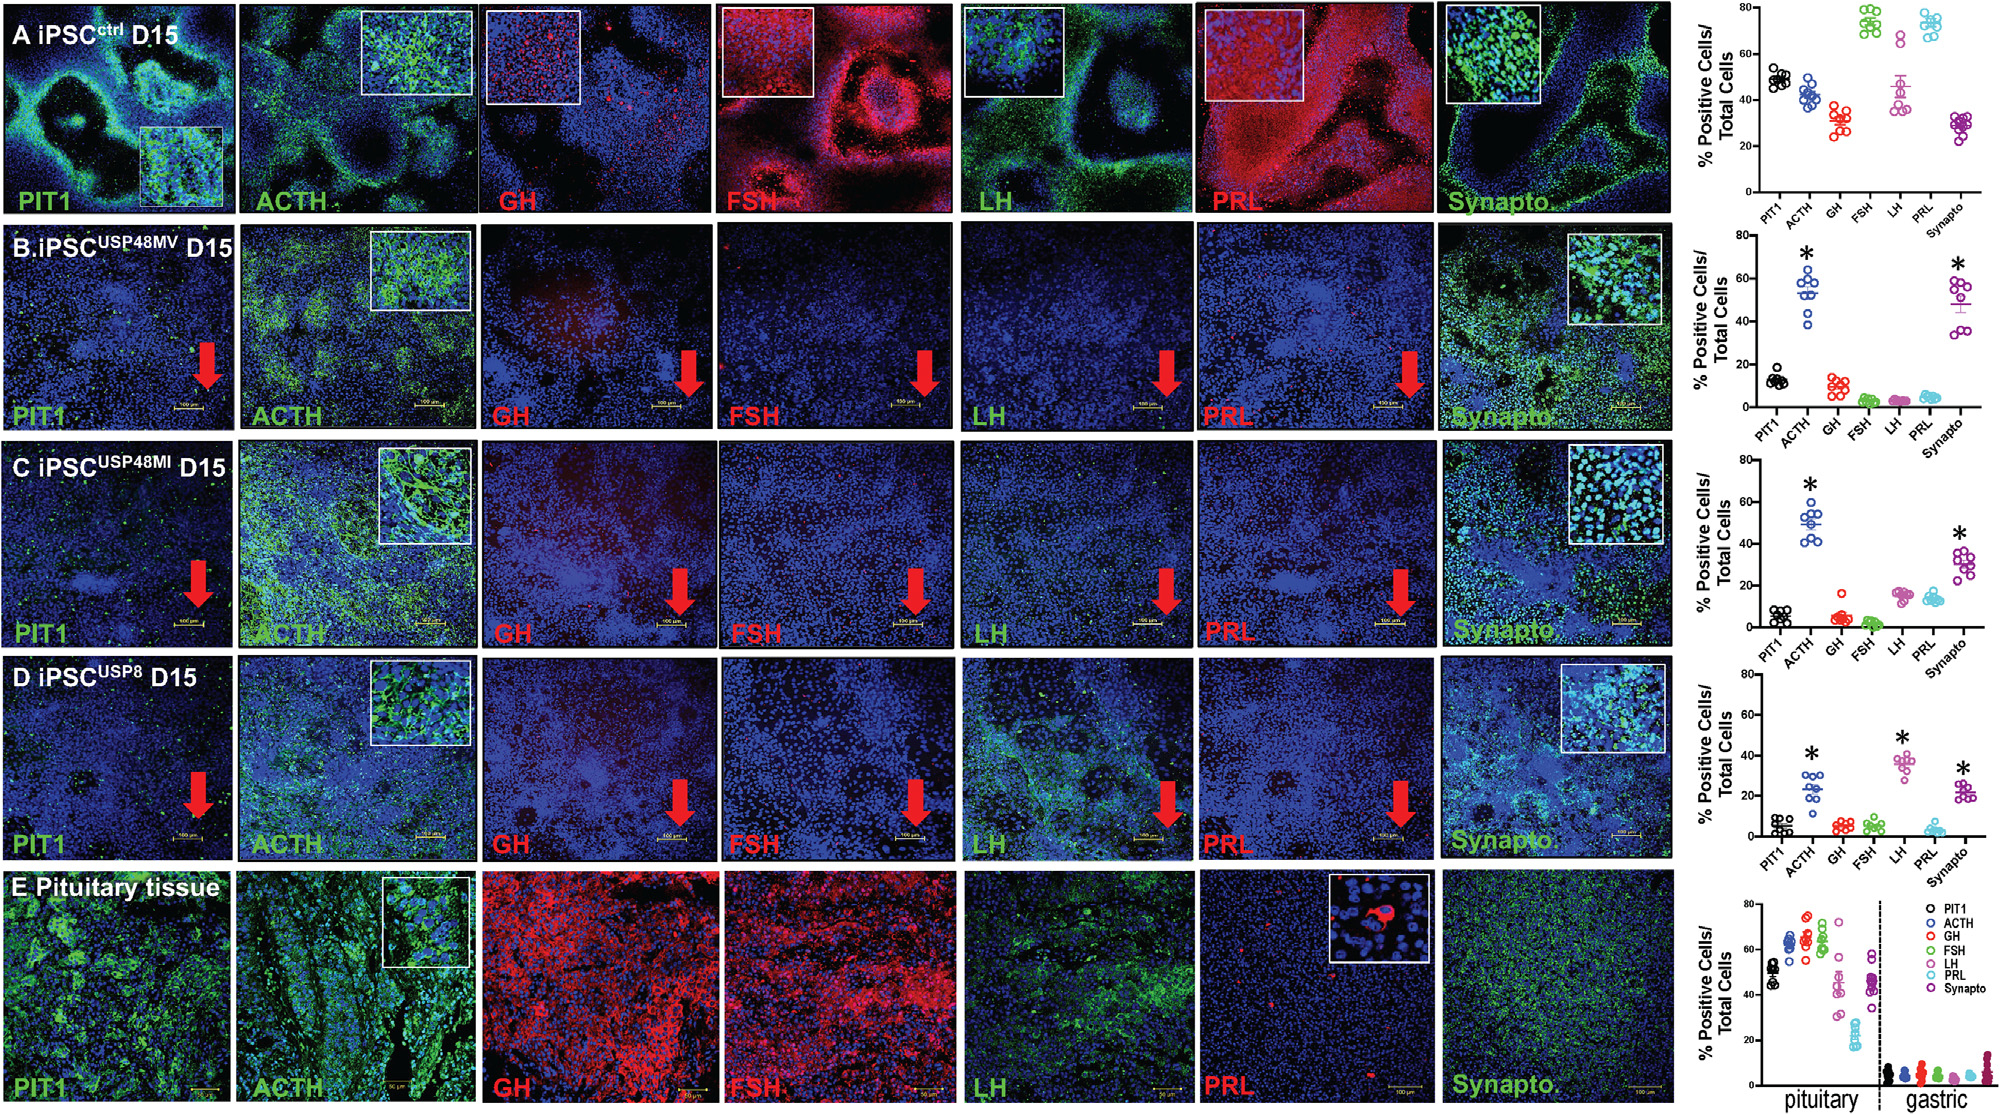
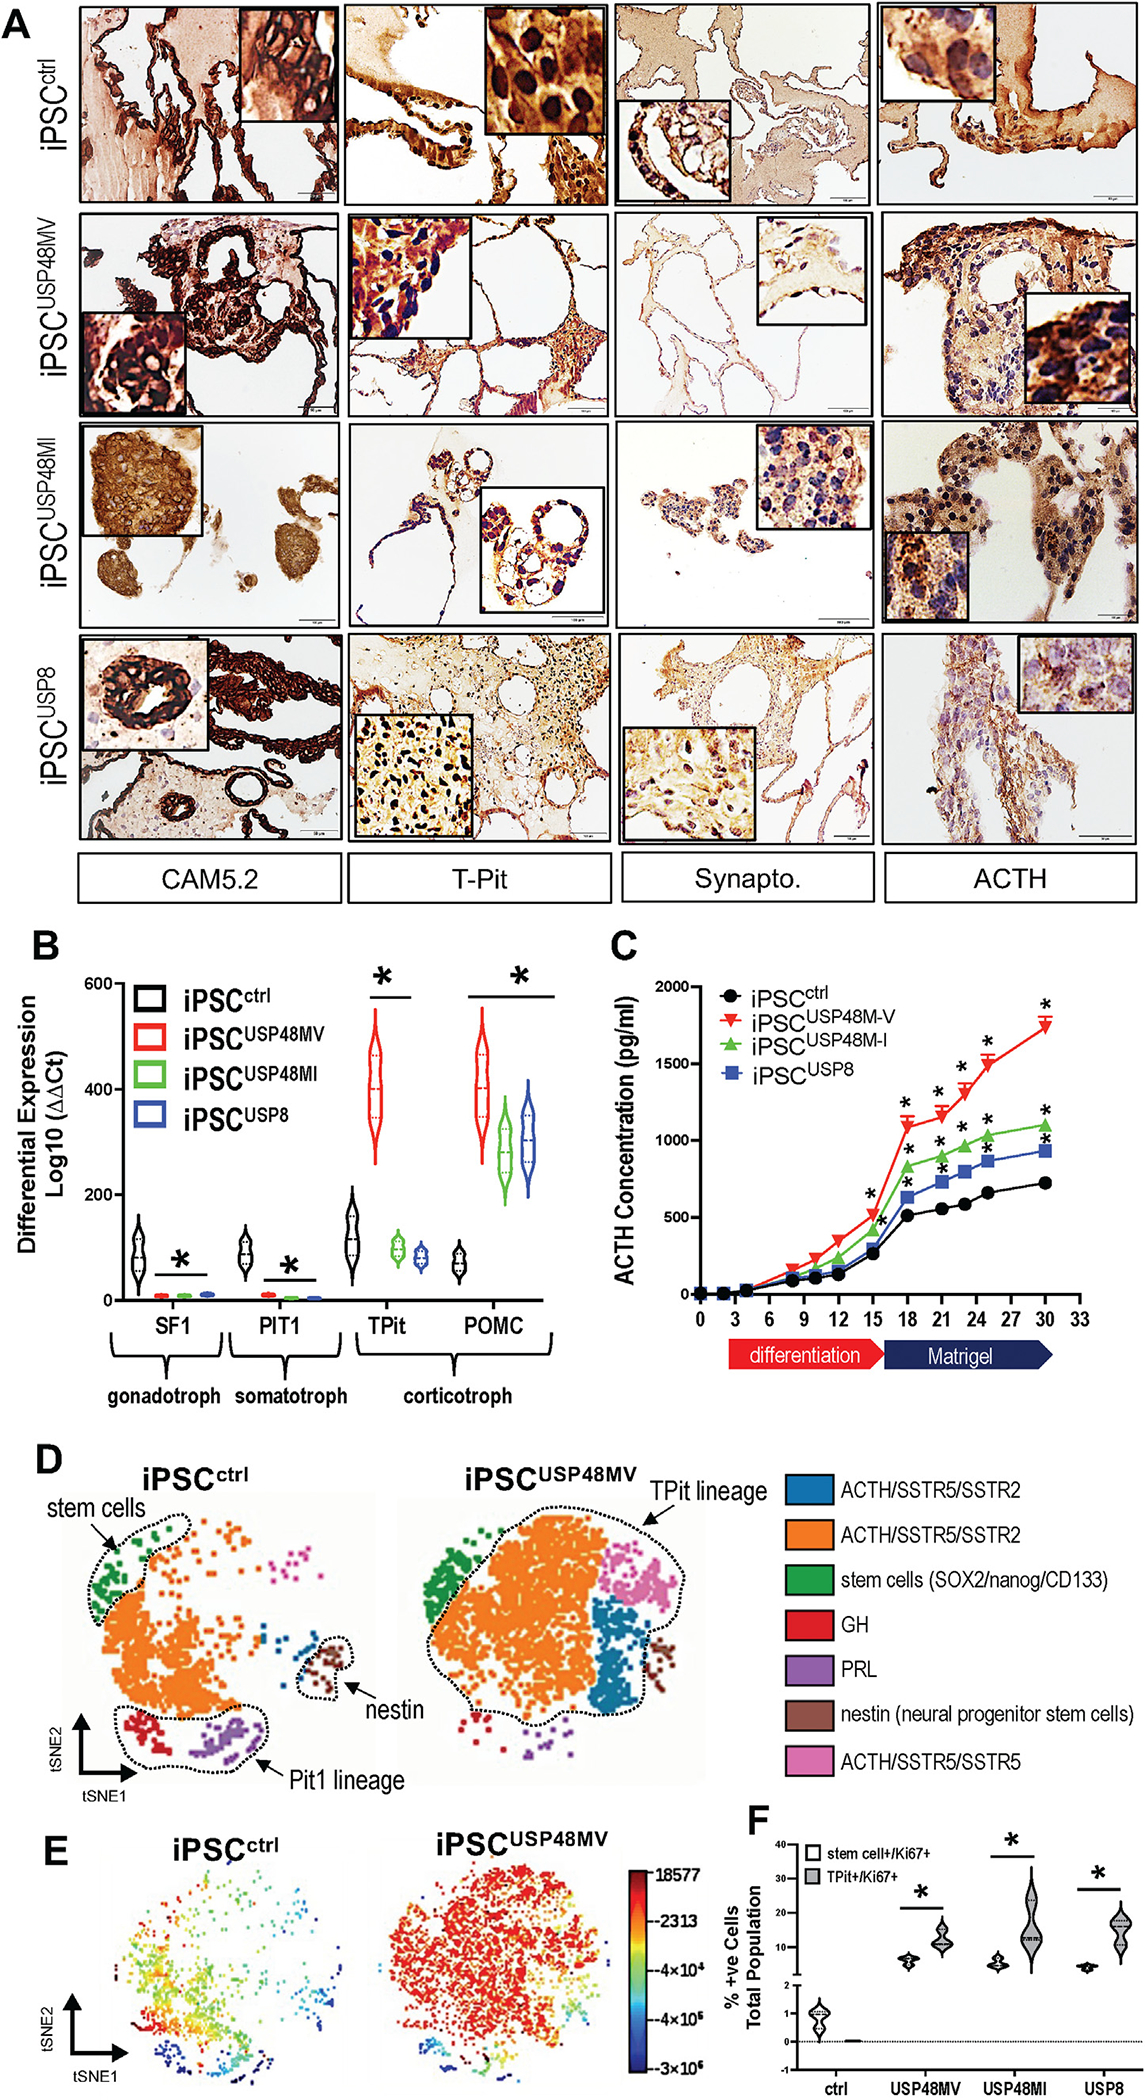
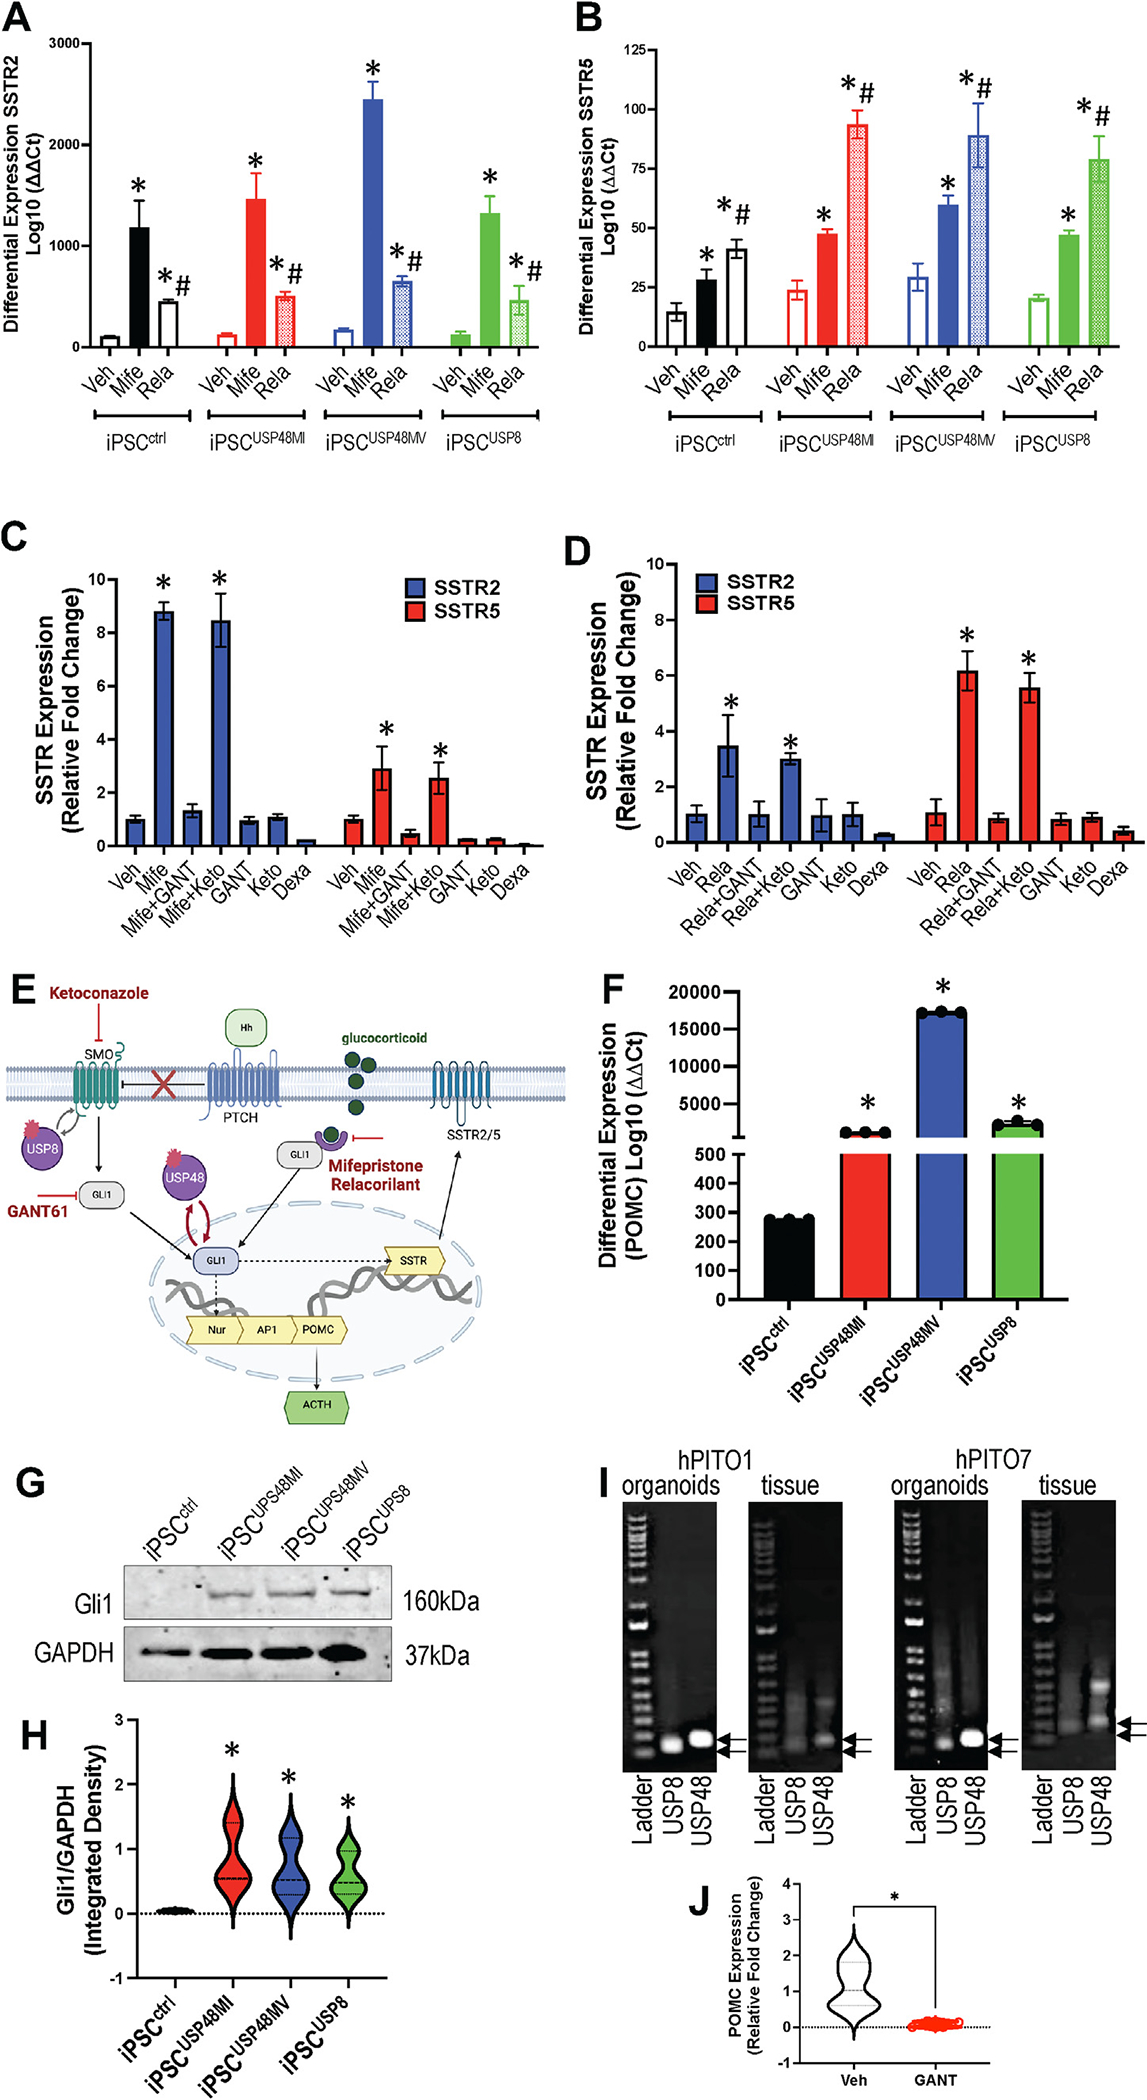
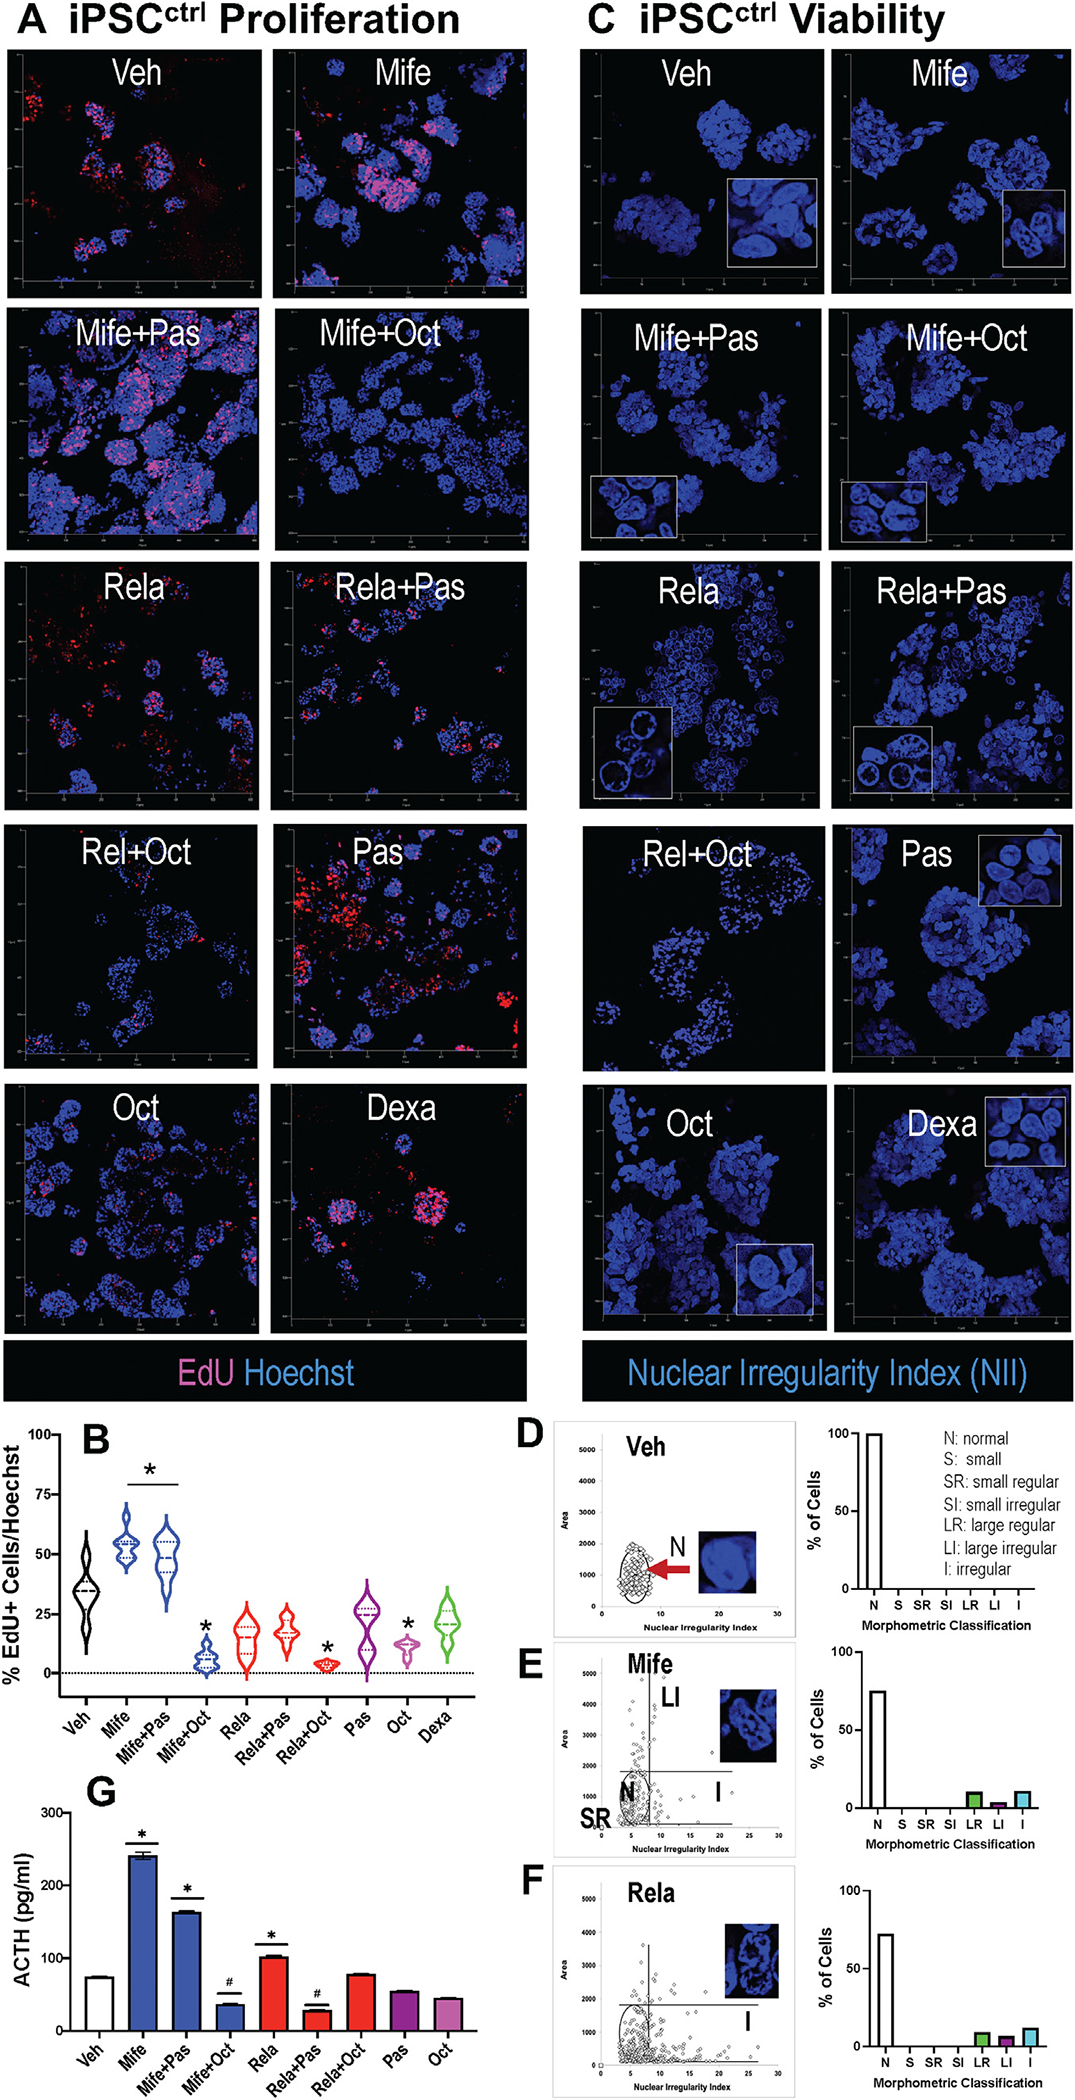
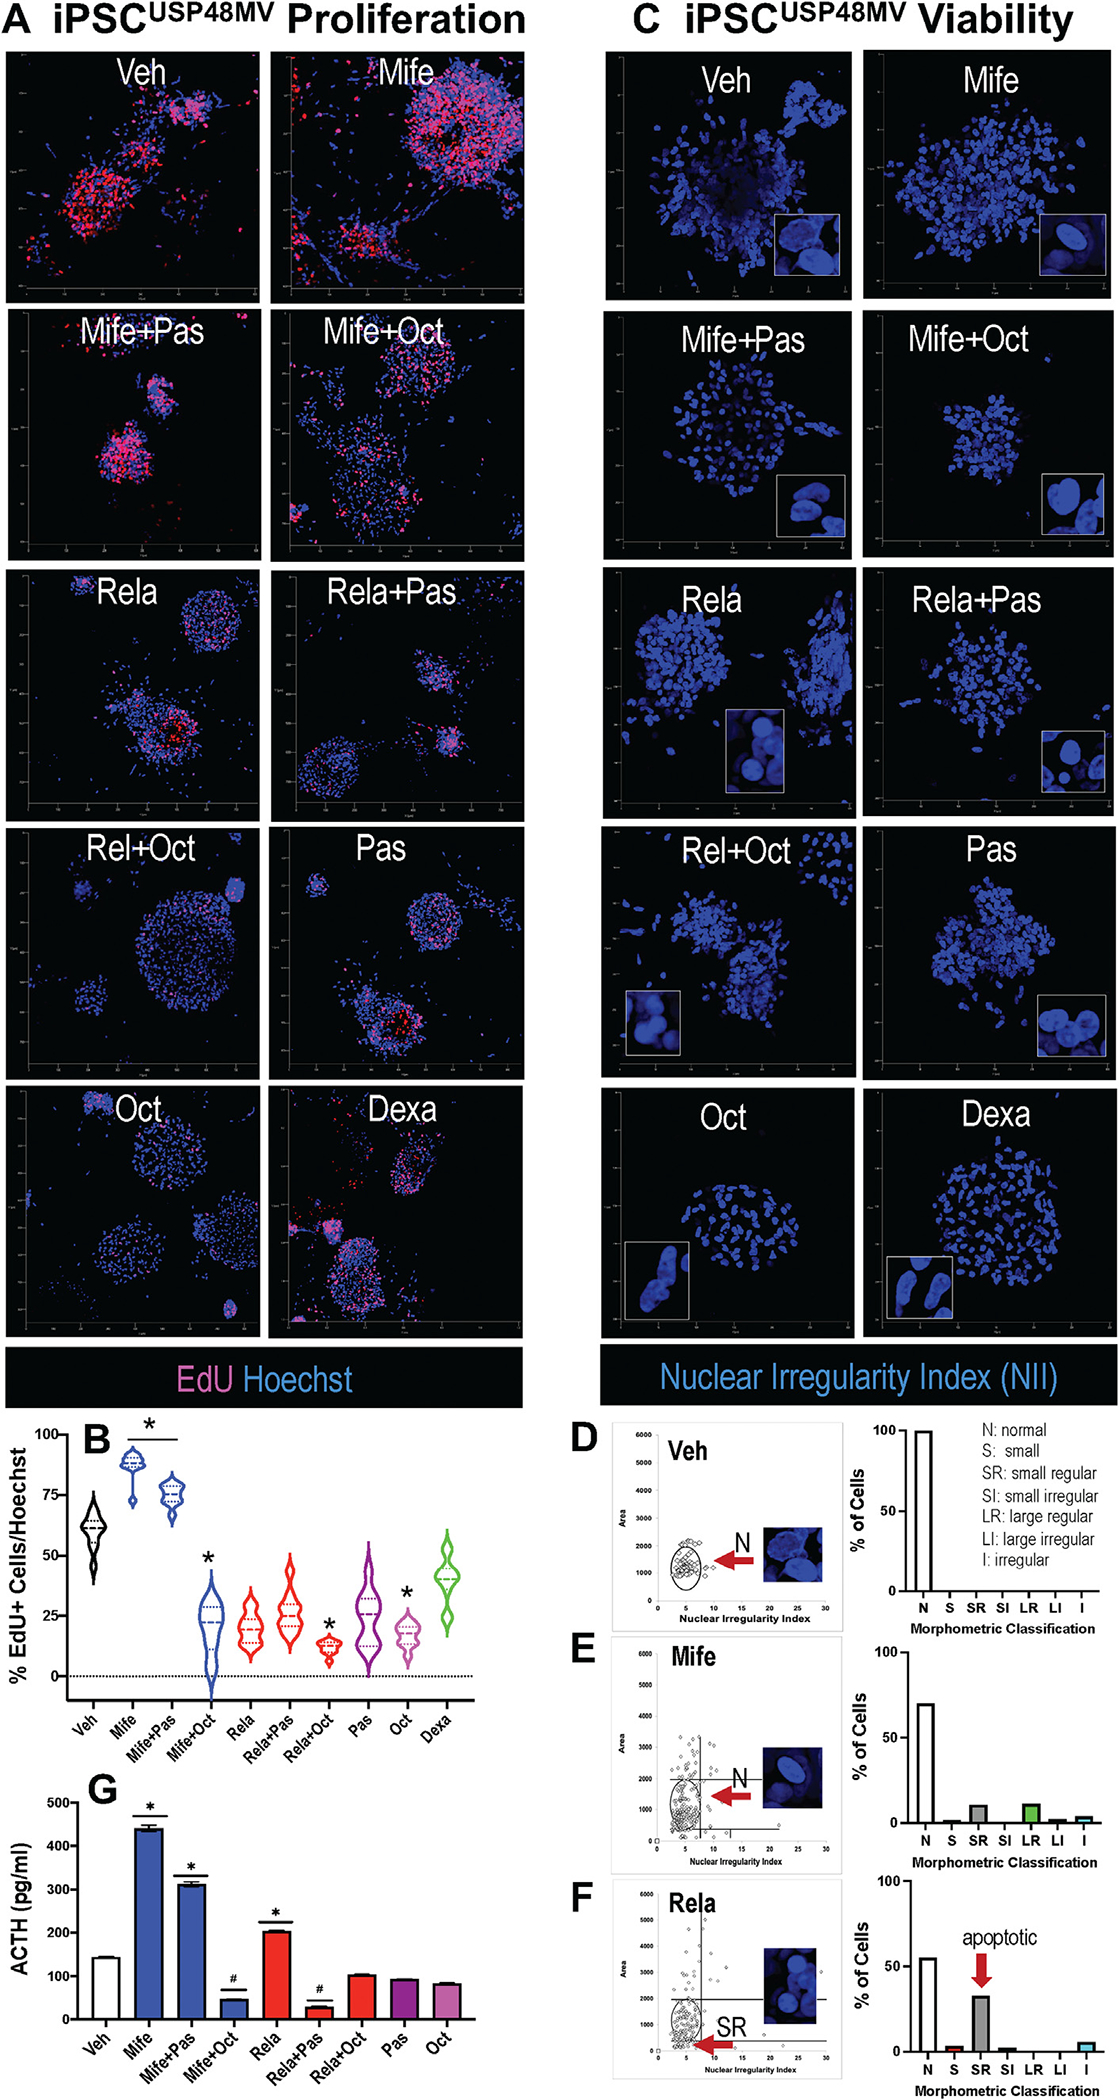
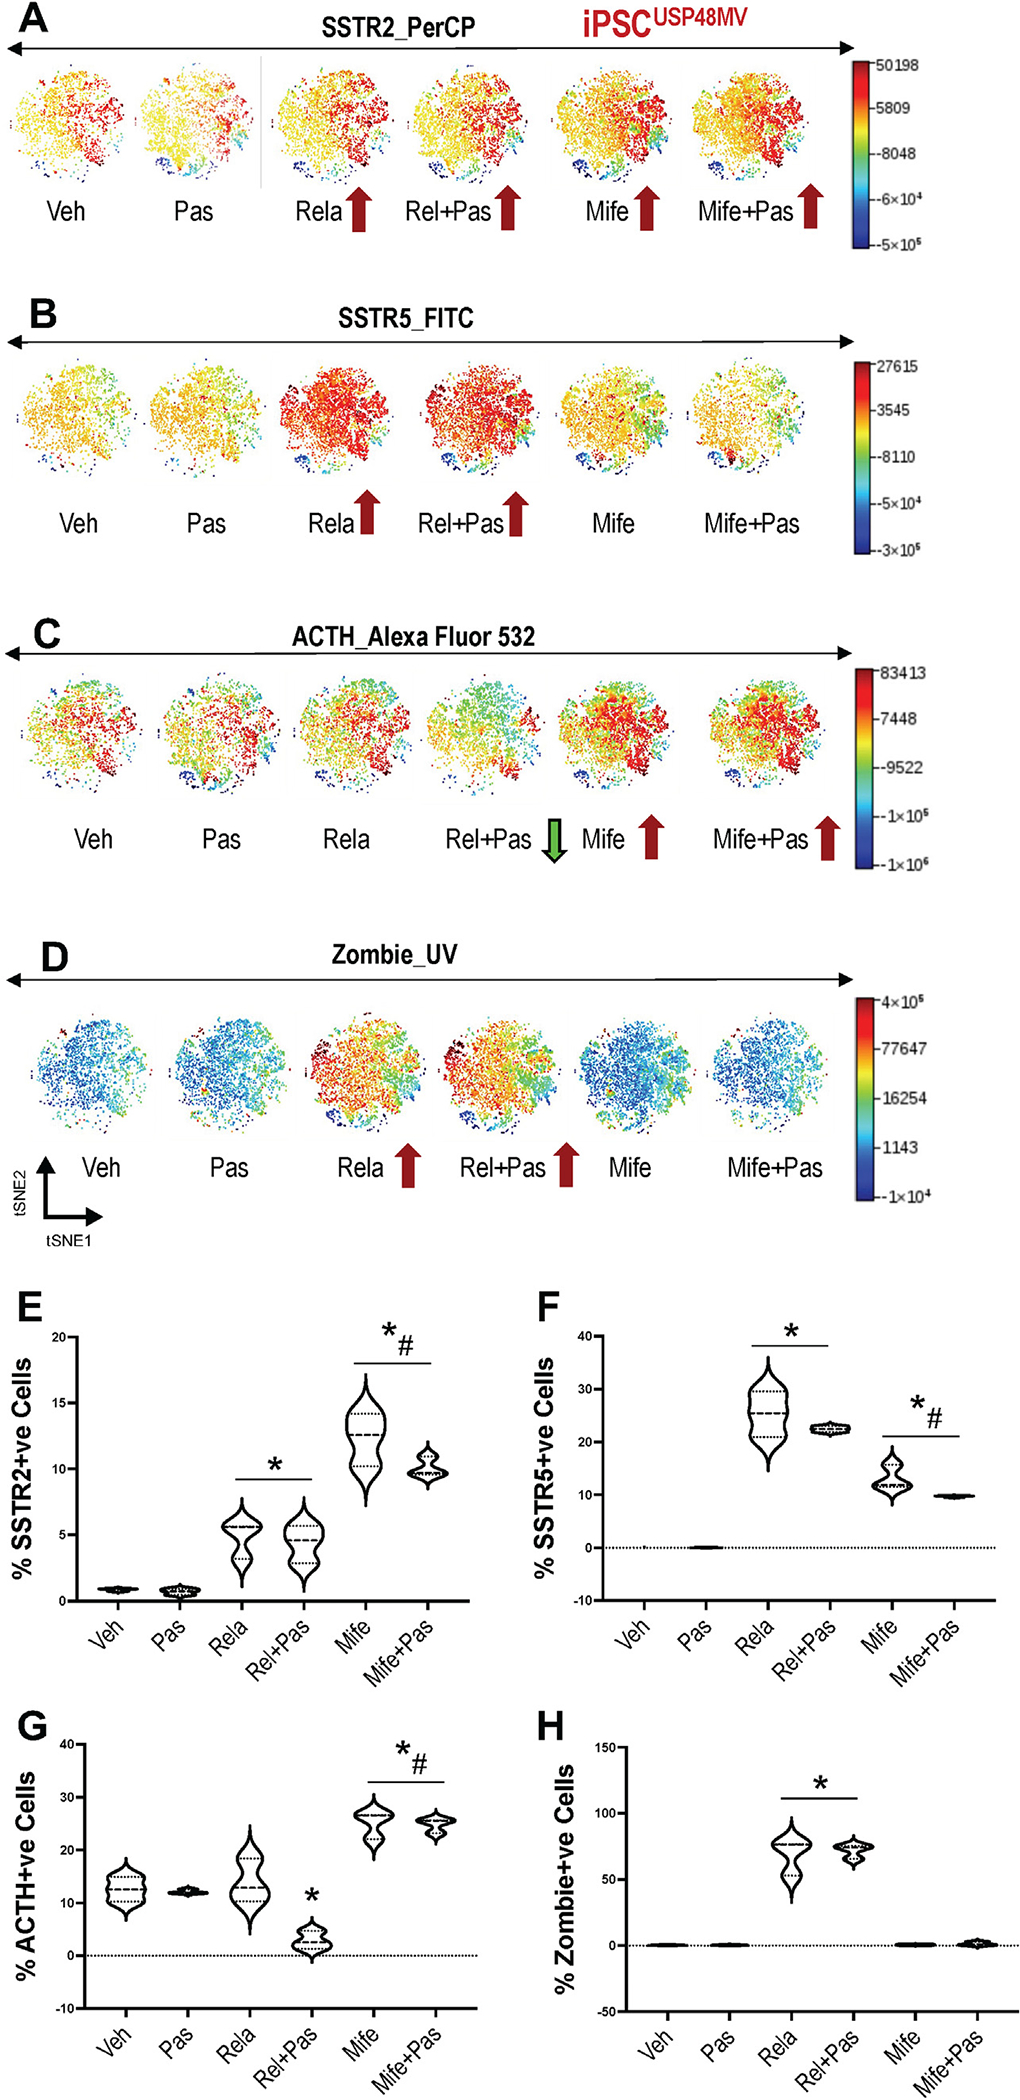
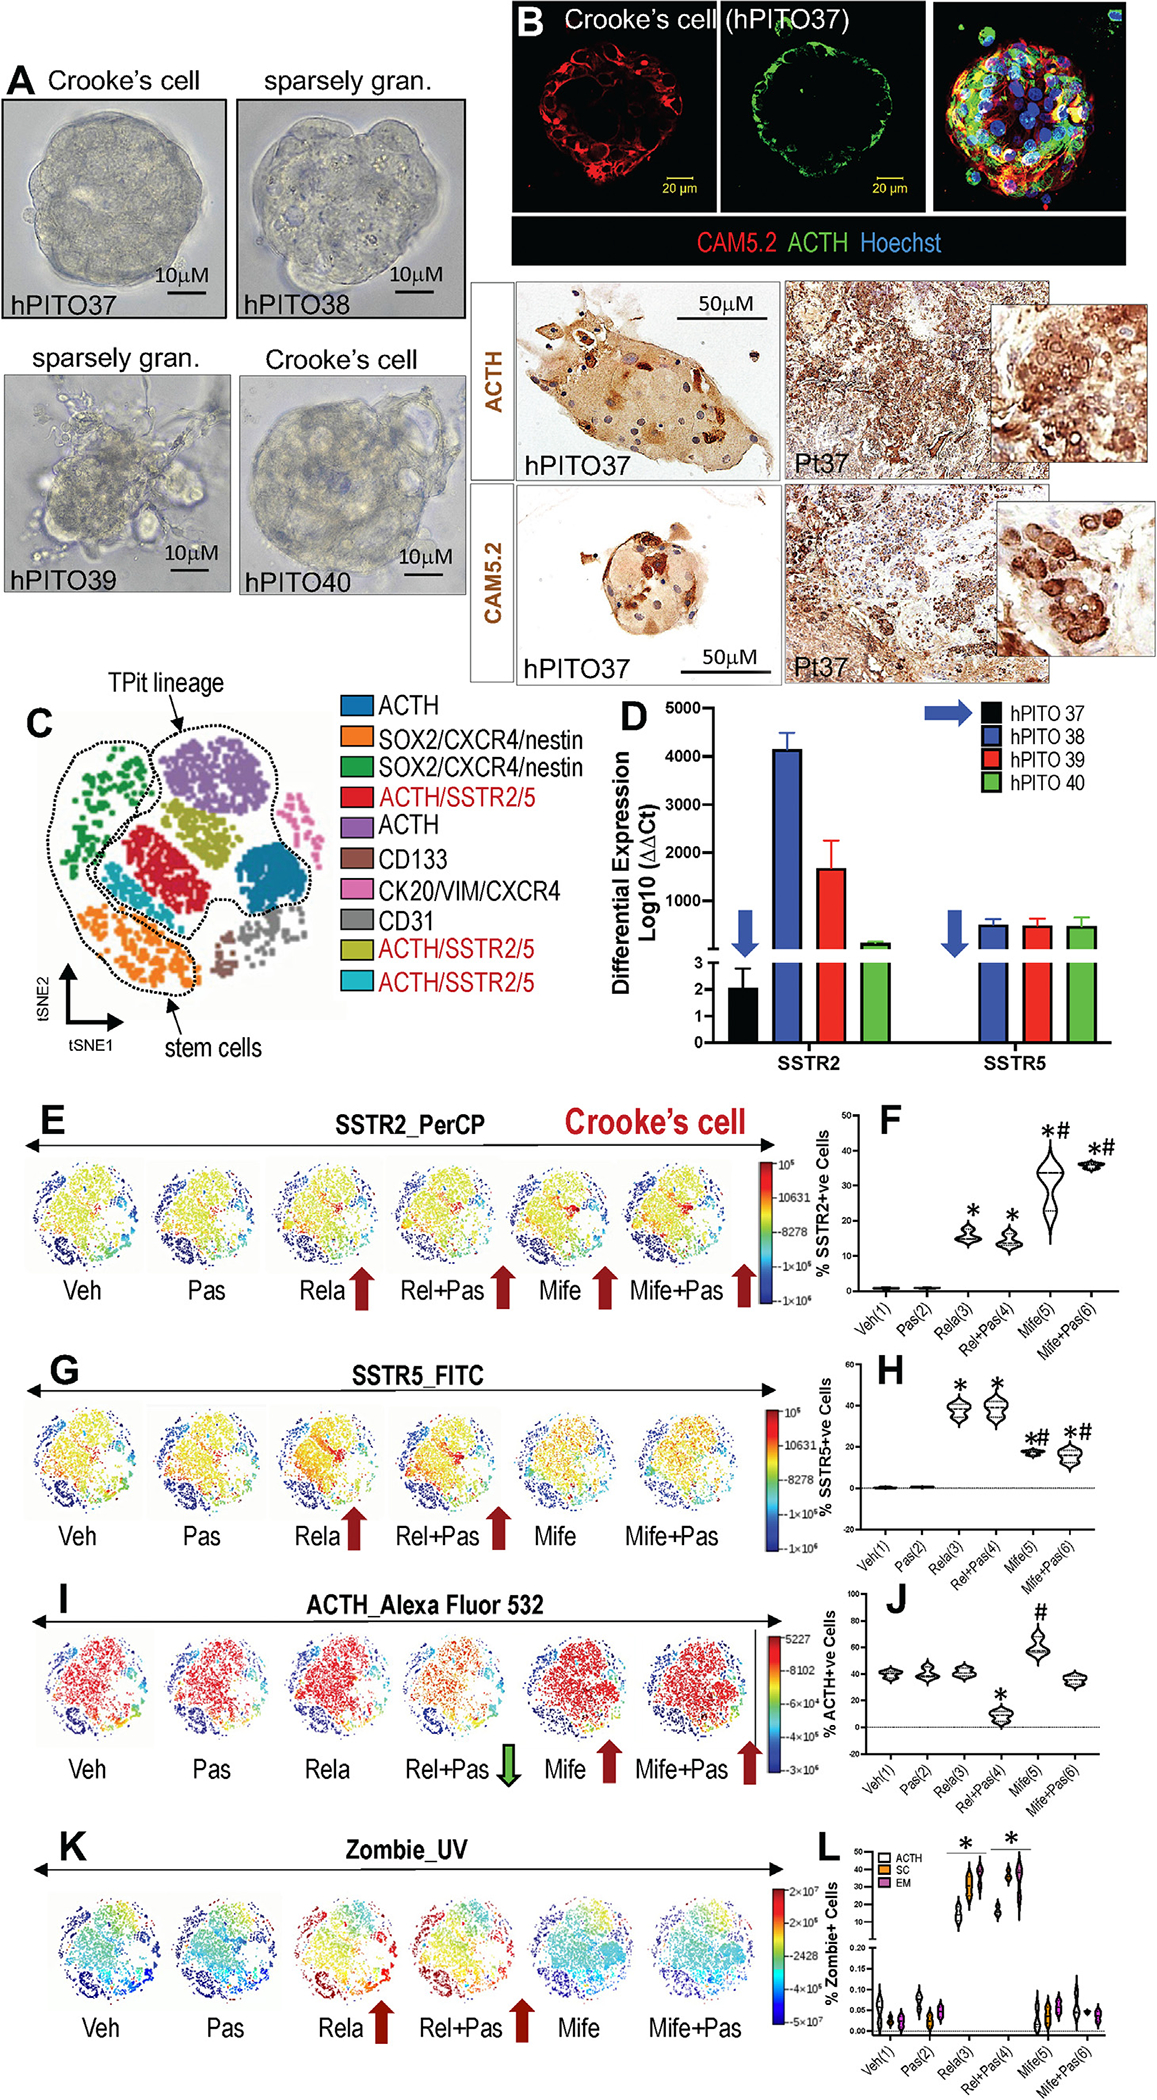
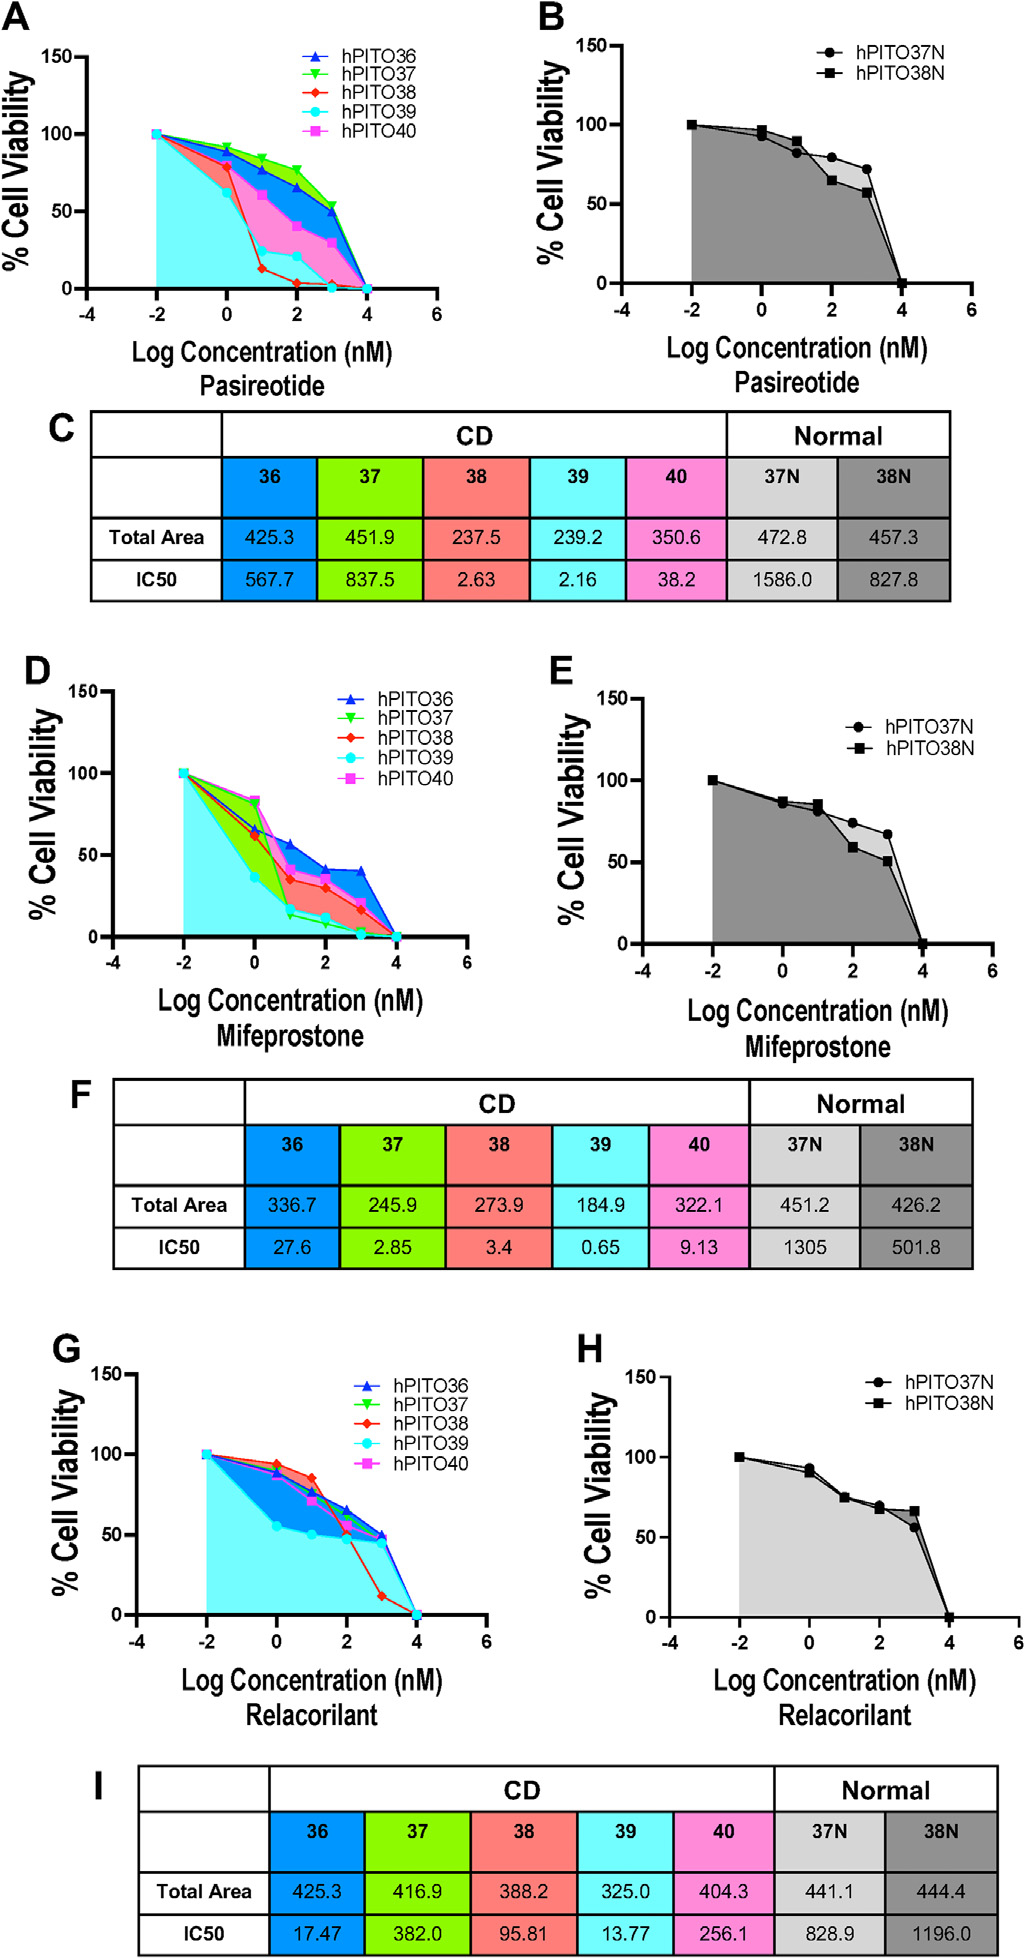
Cushing's disease (CD) is a serious endocrine disorder attributed to an adrenocorticotropic hormone (ACTH)-secreting pituitary neuroendocrine tumor (PitNET) that that subsequently leads to chronic hypercortisolemia. PitNET regression has been reported following treatment with the investigational selective glucocorticoid receptor (GR) modulator relacorilant, but the mechanisms behind that effect remain unknown. Human PitNET organoid models were generated from induced human pluripotent stem cells (iPSCs) or fresh tissue obtained from CD patient PitNETs (hPITOs). Genetically engineered iPSC derived organoids were used to model the development of corticotroph PitNETs expressing USP48 (iPSCUSP48) or USP8 (iPSCUSP8) somatic mutations. Organoids were treated with the GR antagonist mifepristone or the GR modulator relacorilant with or without somatostatin receptor (SSTR) agonists pasireotide or octreotide. In iPSCUSP48 and iPSCUSP8 cultures, mifepristone induced a predominant expression of SSTR2 with a concomitant increase in ACTH secretion and tumor cell proliferation. Relacorilant predominantly induced SSTR5 expression and tumor cell apoptosis with minimal ACTH induction. Hedgehog signaling mediated the induction of SSTR2 and SSTR5 in response to mifepristone and relacorilant. Relacorilant sensitized PitNET organoid responsiveness to pasireotide. Therefore, our study identified the potential therapeutic use of relacorilant in combination with somatostatin analogs and demonstrated the advantages of relacorilant over mifepristone, supporting its further development for use in the treatment of Cushing's disease patients.


Conflict of interest statement

Conflicts of Interest All authors have read the journal's policy on disclosure of potential conflicts of interest.. Dr. Andreas G. Moraitis and Dr. Andrew E.Greenstein are employees and stock holders of Corcept. Dr. Kevin CJ Yuen has received research grants to the Barrow Neurological Institute from Crinetics, Ascendis, Corcept, and Amryt. Dr. Yuen has served as an advisory board member for Novo Nordisk, Ipsen, Amryt, Crinetics, Recordati and Xeris, and served as a speaker for Recordati, Novo Nordisk and Corcept. All other authors have no potential conflicts of interest to declare.

Figures

Fig 1.
Fig 1.
Expression pattern of pituitary hormone-producing cell lineages in iPSCs differentiated to pituitary organoids. Expression of PIT-1 (green), ACTH (green), GH (red), FSH (red), LH (green), PRL (red) and synaptophysin (synapto, green) with co-stain Hoechst (nuclei, blue) was measured by immunofluorescence using chamber slides collected at day 15 (D15) of the differentiation schedule of (A), control iPSCs (iPSCctrl) and iPSCs expressing (B), USP48M415V (iPSCUSP48MV), (C), USP48M415I (iPSCUSP48MI) and (D), USP8 (iPSCUSP8) mutations. Red arrows highlight the increased expression of ACTH and synaptophysin with the concomitant loss of PIT1, GH, FSH, LH and PRL in iPCSs expressing somatic mutations USP48 and USP8. Quantification of the percentage of positive cells is shown in the dot plots for each iPSC line. *P < 0.05 compared to the PIT1, GH, FSH, LH and PRL cell lineages for each line. (E), Expression of PIT-1 (green), ACTH (green), GH (red), FSH (red), LH (green), PRL (red) and synaptophysin (synapto, green) with co-stain Hoechst (nuclei, blue) was measured by immunofluorescence using positive (pituitary tissue) and negative (gastric tissue) controls. Quantification for positive and negative controls is shown to the right.
Fig 2.
Fig 2.
Expression of cell linages and transcription factors in iPSC generated pituitary tumor organoids. (A), Immunohistochemistry using FFPE sections prepared from iPSCctrl, iPSCUSP48MV, iPSCUSP48MI, and iPSCUSP8 organoids stained with antibodies specific for CAM5.2, T-Pit, Synaptophysin and ACTH. High magnification images are shown in insets. (B), Differential expression of transcription factors TPit, PIT1 and SF1 and POMC were measured by qRT-PCR. (C), Plot comparing the ACTH secretion (pg/mL), measured by an ELISA using conditioned media of iPSCctrl, iPSCUSP48MV, iPSCUSP48MI, and iPSCUSP8 throughout the directed differentiation schedule. (D), viSNE maps showing concatenated flow cytometry standard files for iPSCctrl, iPSCUSP48MV, iPSCUSP48MI, and iPSCUSP8 organoids 30 days post-directed differentiation. Maps define spatially distinct cell populations using pituitary specific cell lineage, stem cell and transcription factor markers between iPSCctrl organoids and mutant lines. (E), viSNE heatmaps showing the number of cells positive for proliferation marker Ki67. (F), Violin plots comparing the TPit lineage expression, through proliferation marker Ki67 between control and mutated iPSC lines. *P < 0.05 compared to iPSCctrl organoids, n = 3 individual experimental replicates.
Fig 3.
Fig 3.
Differential expression of SSTR2 and SSTR5 in iPSC generated pituitary tumor organoids in response to mifepristone and relacorilant. Differential expression of (A), SSTR2 and (B), SSTR5 in iPSCctrl, iPSCUSP48MI, iPSCUSP48MV and iPSCUSP8 organoids in response to vehicle (Veh), mifepristone (Mife, 500nM) or relacorilant (Rela, 500nM). *P < 0.05 compared to vehicle-treated organoids, #P < 0.05 compared to mifepristone treated organoids, n = 3 experimental replicates/organoid line. (C), Differential expression of SSTR2 and SSTR5 in iPSCctrl organoids treated with vehicle (Veh), mifepristone (Mife), GANT61 (GANT, 5μM), Mife+GANT, ketoconazole (Keto, 10μM), Mife+Keto, or dexamethasone (Dexa, 100nM). *P < 0.05 compared to iPSCctrl organoids treated with Veh, n = 3 experimental replicates/organoid line. (D), Differential expression of SSTR2 and SSTR5 in iPSCctrl organoids treated with vehicle (Veh), relacorilant (Rela), GANT61 (GANT), Rela+GANT, ketoconazole (Keto), Rela+Keto, or dexamethasone (Dexa). *P < 0.05 compared to iPSCctrl organoids treated with Veh, n = 3 experimental replicates/organoid line. (E), Mutations in USP48 and USP8 in PitNETs are believed to enhance corticotropin releasing hormone (CRH)-induced production coherent with the Hh signaling pathway. Hh ligand, Sonic Hedgehog (Shh), binds to Patched (Ptch1) that relieves suppression of Smoothened (SMO) and subsequently Gli1 activation. Crosstalk between Shh and CRH at the Gli1 level stimulates POMC transcription and ACTH secretion. (F), Differential expression of POMC in iPSCctrl, iPSCUSP48MI, iPSCUSP48MV and iPSCUSP8 organoids. *P < 0.05 compared to iPSCctrl organoids, n = 3 experimental replicates/organoid line. (G), Representative western blots of the expression of Gli1 relative to GAPDH in iPSCctrl, iPSCUSP48MI, iPSCUSP48MV and iPSCUSP8 organoids. (H), Quantification of western blots shown in G. *P < 0.05 compared to iPSCctrl organoids, n = 3 experimental replicates/organoid line. (I), Mutations in USP8 and USP48 detected in hPITO cultures (hPITO1 and 7) were also expressed in the patient’s matched PitNET tissue. (J), Human PITO cultures expressing USP8 and USP48 mutations were used for gene ChIP analysis after treatment with vehicle or GANT61. *P < 0.05 compared to iPSCctrl organoids, n = 4 experimental replicates/organoid line.
Fig 4.
Fig 4.
Changes in pituitary tumor cell proliferation, viability and ACTH secretion in iPSCctrl organoids in response to mifepristone and relacorilant. (A), Immunofluorescence images of EdU expression in iPSCctrl organoids in response to vehicle (Veh), mifepristone (Mife, 500nM), pasireotide (Pas, 100nM), octreotide (Oct, 100nM), relacorilant (Rela, 500nM), Mife+Pas, Mife+Oct, Rela+Pas, Rela+Oct, dexamethasone (Dexa, 100nM). (B), Quantification of EdU positive cells of iPSCctrl and mutant organoids. *P < 0.05 compared to iPSCctrl organoids, n = 4 individual organoids quantified per culture. (C), Representative Hoechst staining of iPSCctrl organoids in response to experimental treatments for the calculation of nuclear irregularity index (NII). Nuclear morphometric analysis of iPSCctrl organoids in response to experimental treatments with quantification shown for (D), Veh, (E), Mife, or (F), Rela treatments. Morphometric classification of NII was based on the normal (N), small (S), small regular (SR), short irregular (SI), large regular (LR), large irregular (LI) and irregular (I) nuclear morphology. (G), An ELISA was performed using conditioned media collected from iPSCctrl cultures in response to treatments for the measurement of ACTH secretion (pg/mL). *P < 0.05 compared to Veh treatment, #P < 0.05 compared to Mife or Rela alone, n = 4 individual organoids quantified per culture.
Fig 5.
Fig 5.
Changes in pituitary tumor cell proliferation, viability and ACTH secretion in iPSCUSP48MV organoids in response to mifepristone and relacorilant. (A), Immunofluorescence images of EdU expression in iPS-CUSP48MV organoids in response to vehicle (Veh), mifepristone (Mife, 500nM), pasireotide (Pas, 100nM), octreotide (Oct, 100nM), relacorilant (Rela, 500nM), Mife+Pas, Mife+Oct, Rela+Pas, Rela+Oct, dexamethasone (Dexa, 100nM). (B), Quantification of EdU positive cells of iPSCUSP48MV and mutant organoids. *P < 0.05 compared to iPSCUSP48MV organoids, n = 4 individual organoids quantified per culture. (C), Representative Hoechst staining of iPSCctrl organoids in response to experimental treatments for the calculation of nuclear irregularity index (NII). Nuclear morphometric analysis of iPSCUSP48MV organoids in response to experimental treatments with quantification shown for (D), Veh, (E), Mife, or (F), Rela treatments. Morphometric classification of NII was based on the normal (N), small (S), small regular (SR), small irregular (SI), large regular (LR), large irregular (LI) and irregular (I) nuclear morphology. (G), An ELISA was performed using conditioned media collected from iPSCUSP48MV cultures in response to treatments for the measurement of ACTH secretion (pg/mL). *P < 0.05 compared to Veh treatment, #P < 0.05 compared to Mife or Rela alone, n = 4 individual organoids quantified per culture.
Fig 6.
Fig 6.
Changes in SSTR2, SSTR5 and ACTH expression, and pituitary tumor cell death in iPSCUSP48MV organoids in response to mifepristone and relacorilant. Fluorescent intensity of (A), SSTR2, (B), SSTR5, (C), ACTH, and (D), zombie of viSNE heatmaps for iPSCUSP48MV organoids in response to vehicle (Veh), pasireotide (Pas, 100nM), relacorilant (Rela, 500nM), Rela +Pas, mifepristone (Mife, 500nM), and Mife+Pas. iPS-CUSP48 = 15000 events. Quantification of percentage of SSTR2 (E), SSTR5 (F), ACTH (G), or Zombie (H), positive cells within iPSCUSP48MV organoid cultures in response to experimental treatments. *P < 0.05 compared to Veh.
Fig 7.
Fig 7.
Changes in SSTR2, SSTR5 and ACTH expression, and pituitary tumor cell death in hPITOs in response to mifepristone and relacorilant. (A), Brightfield images of organoid cultures generated from patients with CD (hPITOs 37, 38, 39, 40). (B), Immunofluorescence staining using antibodies specific for CAM5.2 (red) and ACTH (green) of hPITO37. Immunohistochemical staining using antibodies specific for ACTH and CAM5.2 of FFPE sections prepared from embedded organoid line (left panels, hPITO37), and patient’s matched PitNET tissue (Pt37, right panels). (C), viSNE maps showing concatenated flow cytometry standard files for hPITO37 line defining the spatially distinct cell populations using pituitary specific cell lineages, stem cell and transcription factor markers. (D) Differential expression of SSTR2 and SSTR5 measured in hPITO36, 37, 38, 39 and 40 lines. Fluorescent intensity of (E, F), SSTR2, (G, H), SSTR5, (I, J), ACTH, and (K, L), zombie of viSNE heatmaps for hPITO37 organoids in response to vehicle (Veh), pasireotide (Pas, 837.5nM), relacorilant (Rela, 382nM), Rela+Pas, mifepristone (Mife, 2.85nM), and Mife+Pas. hPITO = 5000 events. Quantification of percentage of SSTR2, SSTR5, ACTH, or Zombie positive cells within hPITO cultures in response to experimental treatments is shown in F, H, J and L. *P < 0.05 compared to Veh.
Fig 8.
Fig 8.
Analysis of Area-Under-Curve (AUC) for PitNET organoids treated with pasireotide, mifepristone or relacorilant. Dose response curves using PitNET organoid lines (hPITO36, 37, 38, 39 and 40) treated with (A), pasireotide, (D), mifepristone or (G), relacorilant. Dose response curves using PitNET organoid lines generated from adjacent normal tissue (hPITO37N, 38N) treated with (B), pasireotide, (E), mifepristone or (H), relacorilant. (C, F, I), Calculated AUC and IC50 values. n = 3 experimental replicates performed per organoid line.

Similar articles

Cited by

References

    1. Cushing H Posterior pituitary activity from an anatomical standpoint. Am J Pathol 1933;9:539–48. - PMC - PubMed
    1. Cushing H. The basophil adenomas of the pituitary body and their clinical manifestations (pituitary basophilism). Obes Res 1932;2:486–508. - PubMed
    1. Ironside N, Chen CJ, Lee CC, Trifiletti DM, Vance ML, Sheehan JP. Outcomes of Pituitary Radiation for Cushing’s Disease. Endocrinol Metab Clin North Am 2018;47:349–65. - PubMed
    1. Loriaux DL. Diagnosis and differential diagnosis of Cushing’s Syndrome. N Engl J Med 2017;377:e3. - PubMed
    1. Asa SL, Mete O, Perry A, Osamura RY. Overview of the 2022 WHO Classification of Pituitary Tumors. Endocr Pathol 2022;33:6–26. - PubMed

Publication types

MeSH terms