. 2023 Jun:99:48-57.
doi: 10.1016/j.mri.2023.01.006. Epub 2023 Jan 11.

Prostate cancer lesion detection, volume quantification and high-grade cancer differentiation using cancer risk maps derived from multiparametric MRI with histopathology as the reference standard

Affiliations

Prostate cancer lesion detection, volume quantification and high-grade cancer differentiation using cancer risk maps derived from multiparametric MRI with histopathology as the reference standard

Matthew Gibbons et al. Magn Reson Imaging. 2023 Jun.

Abstract

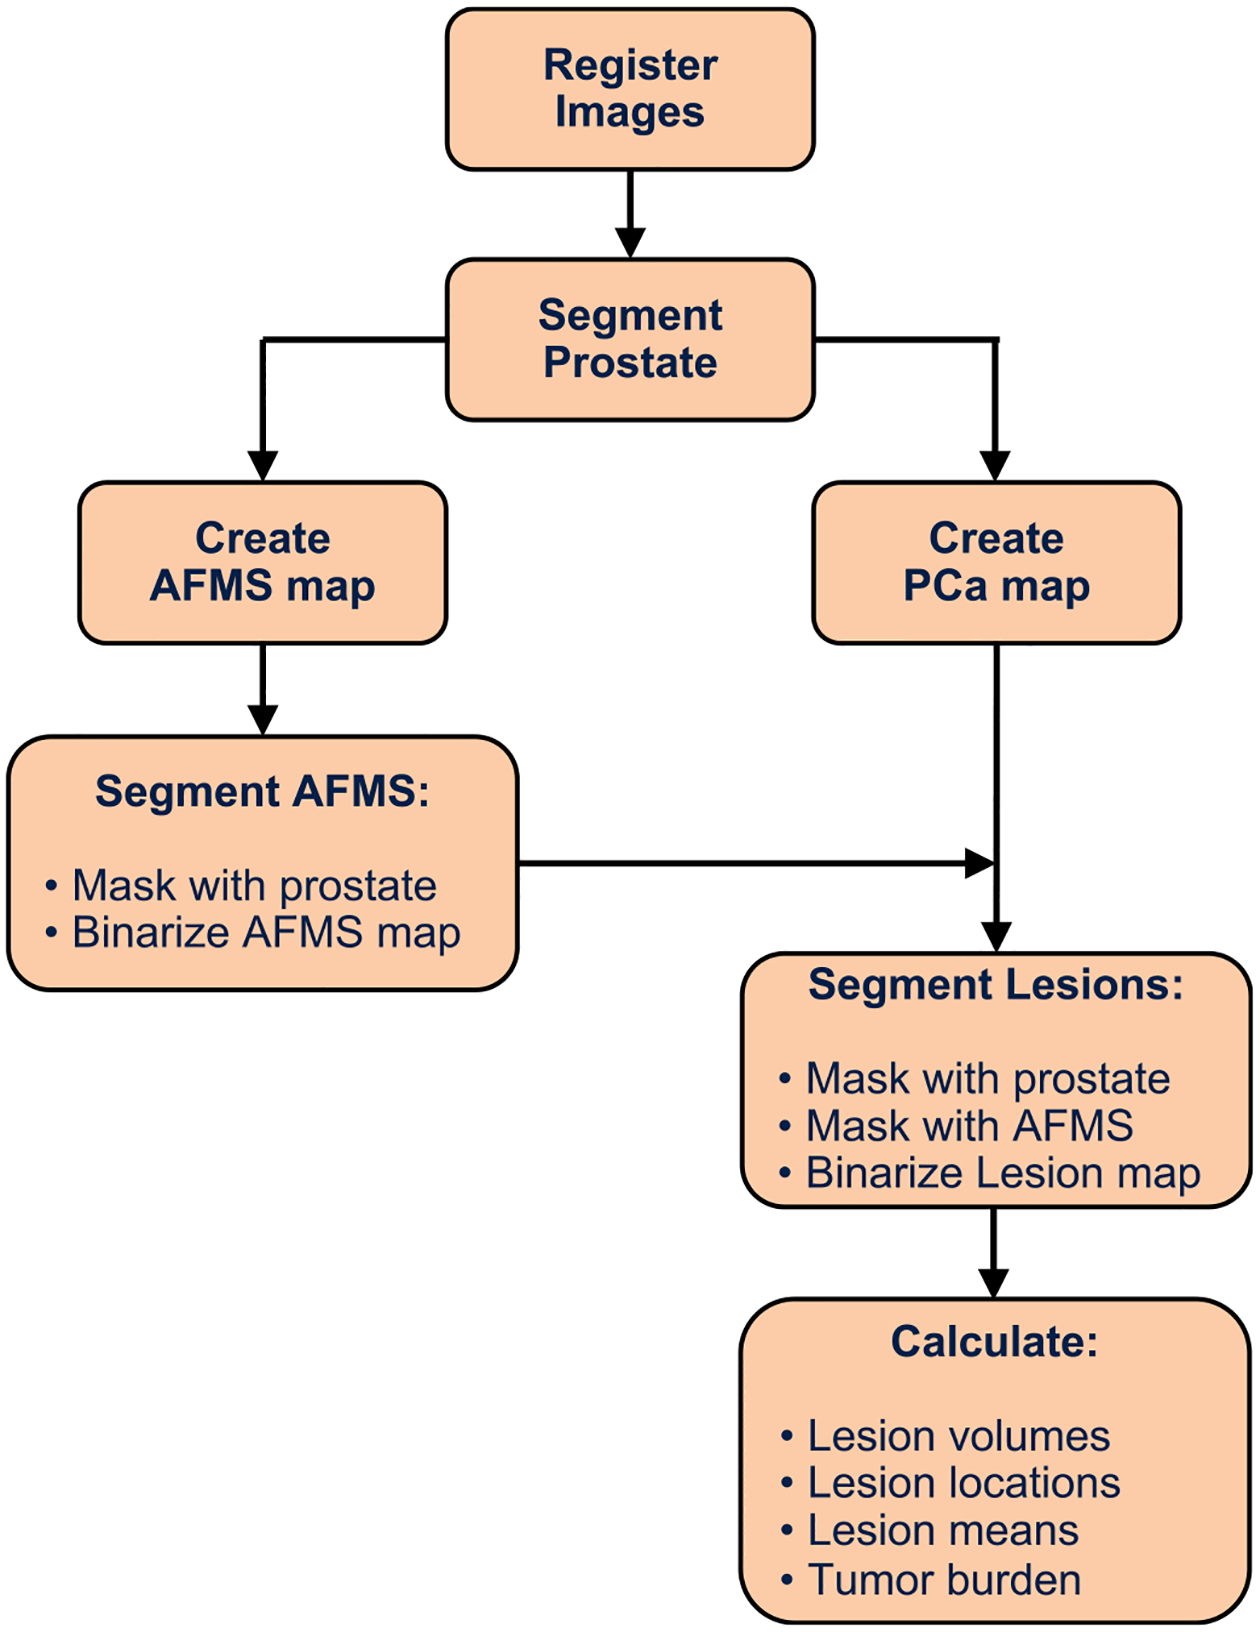
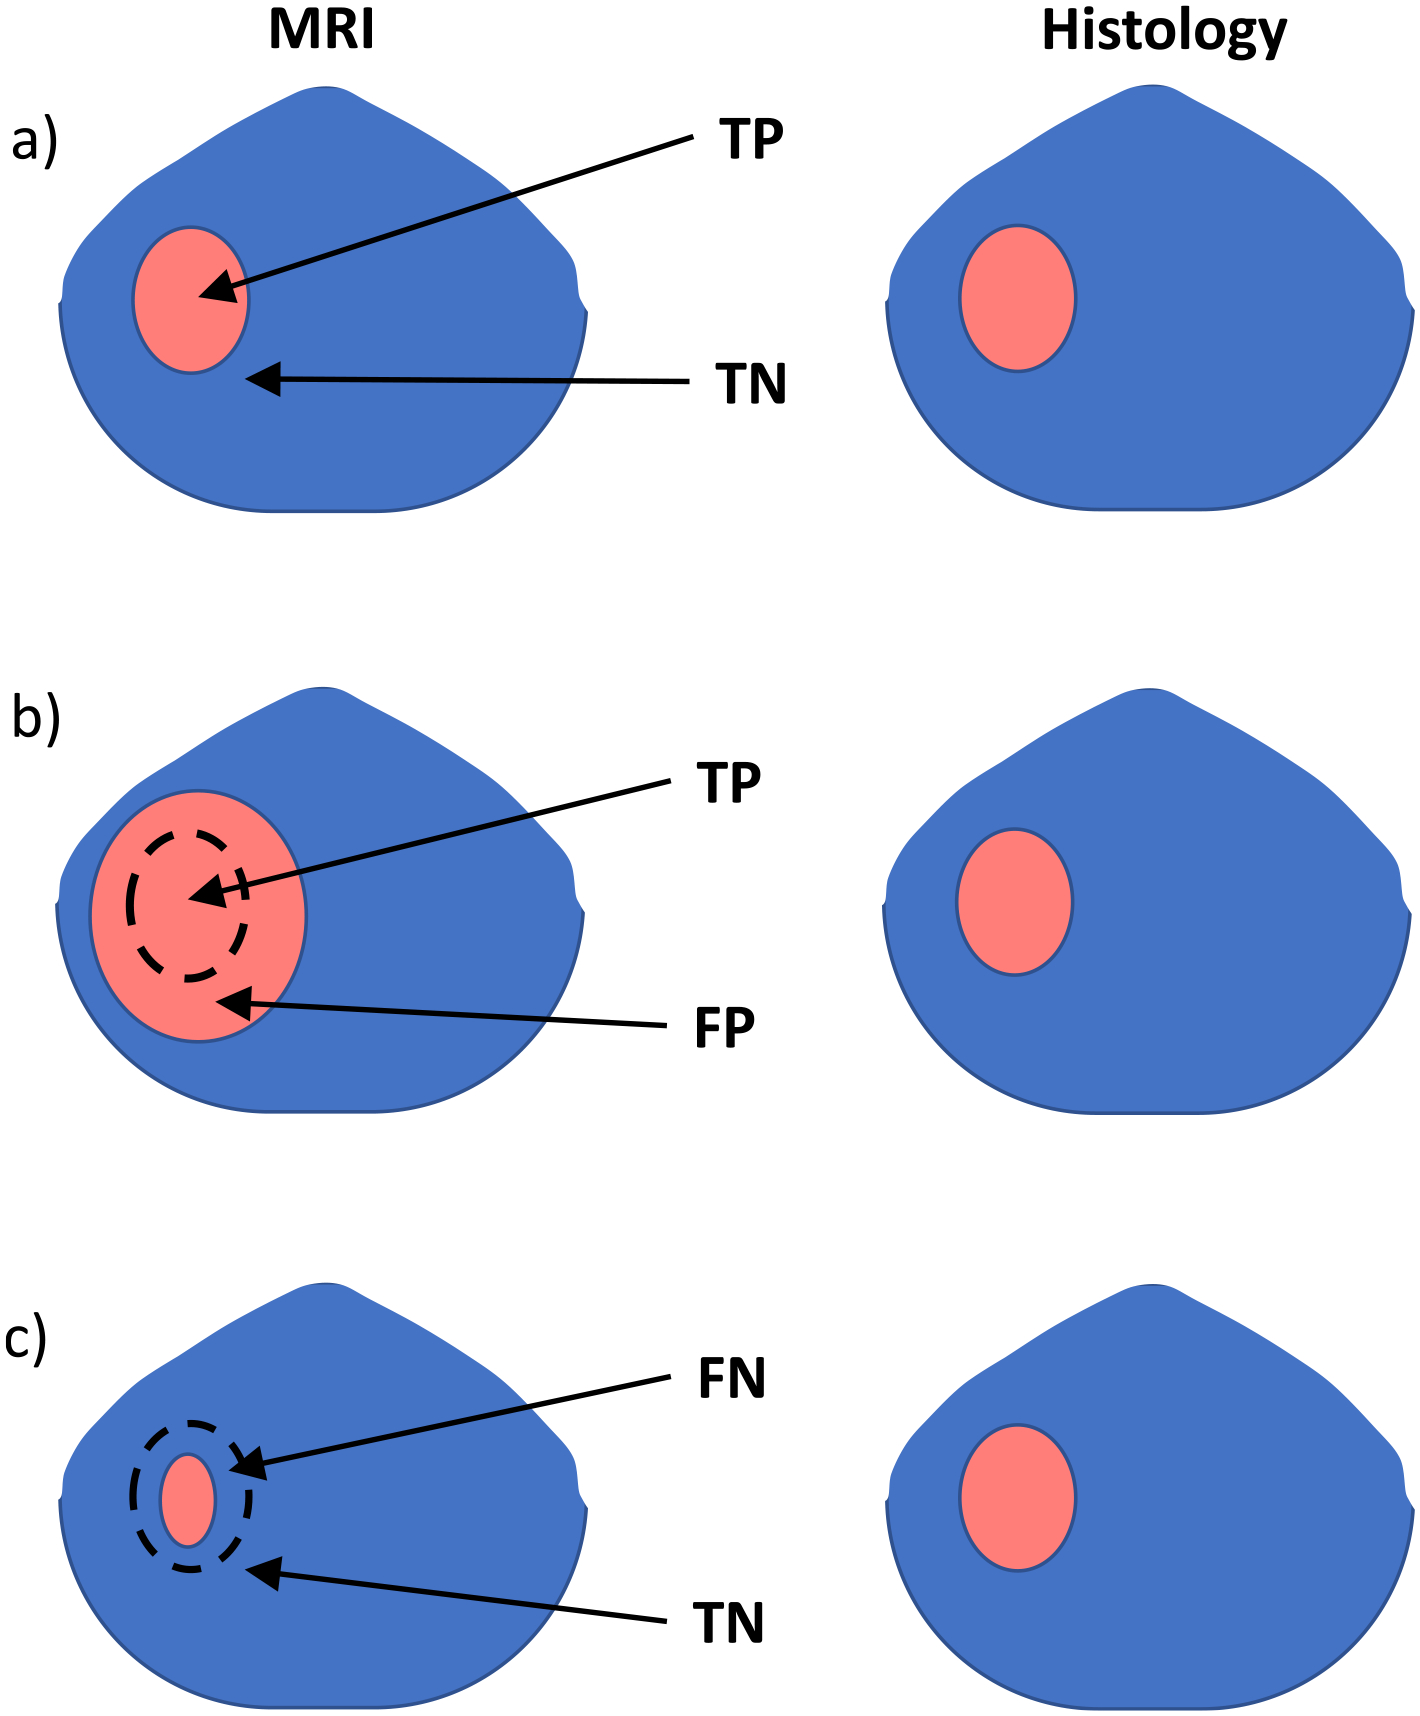
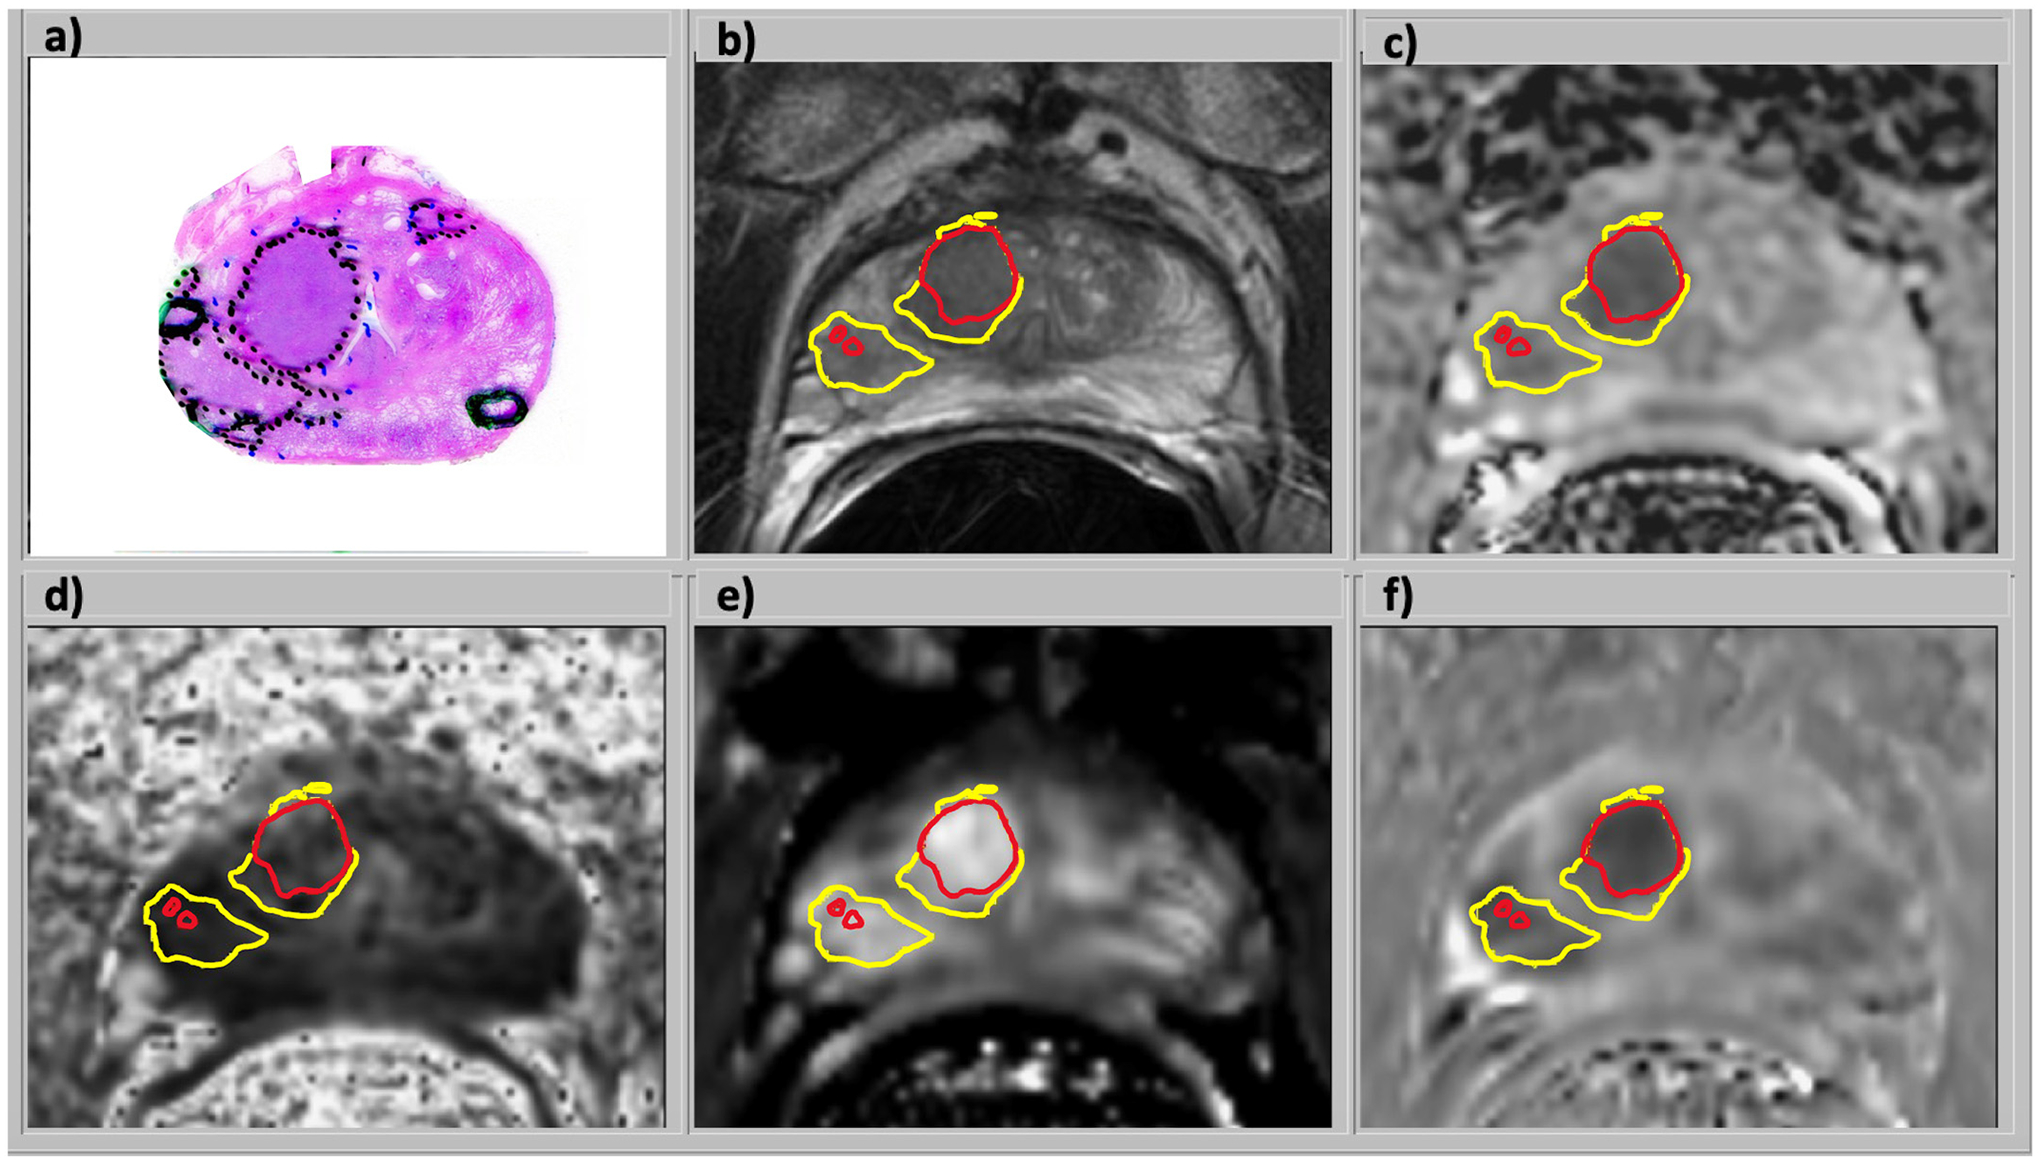
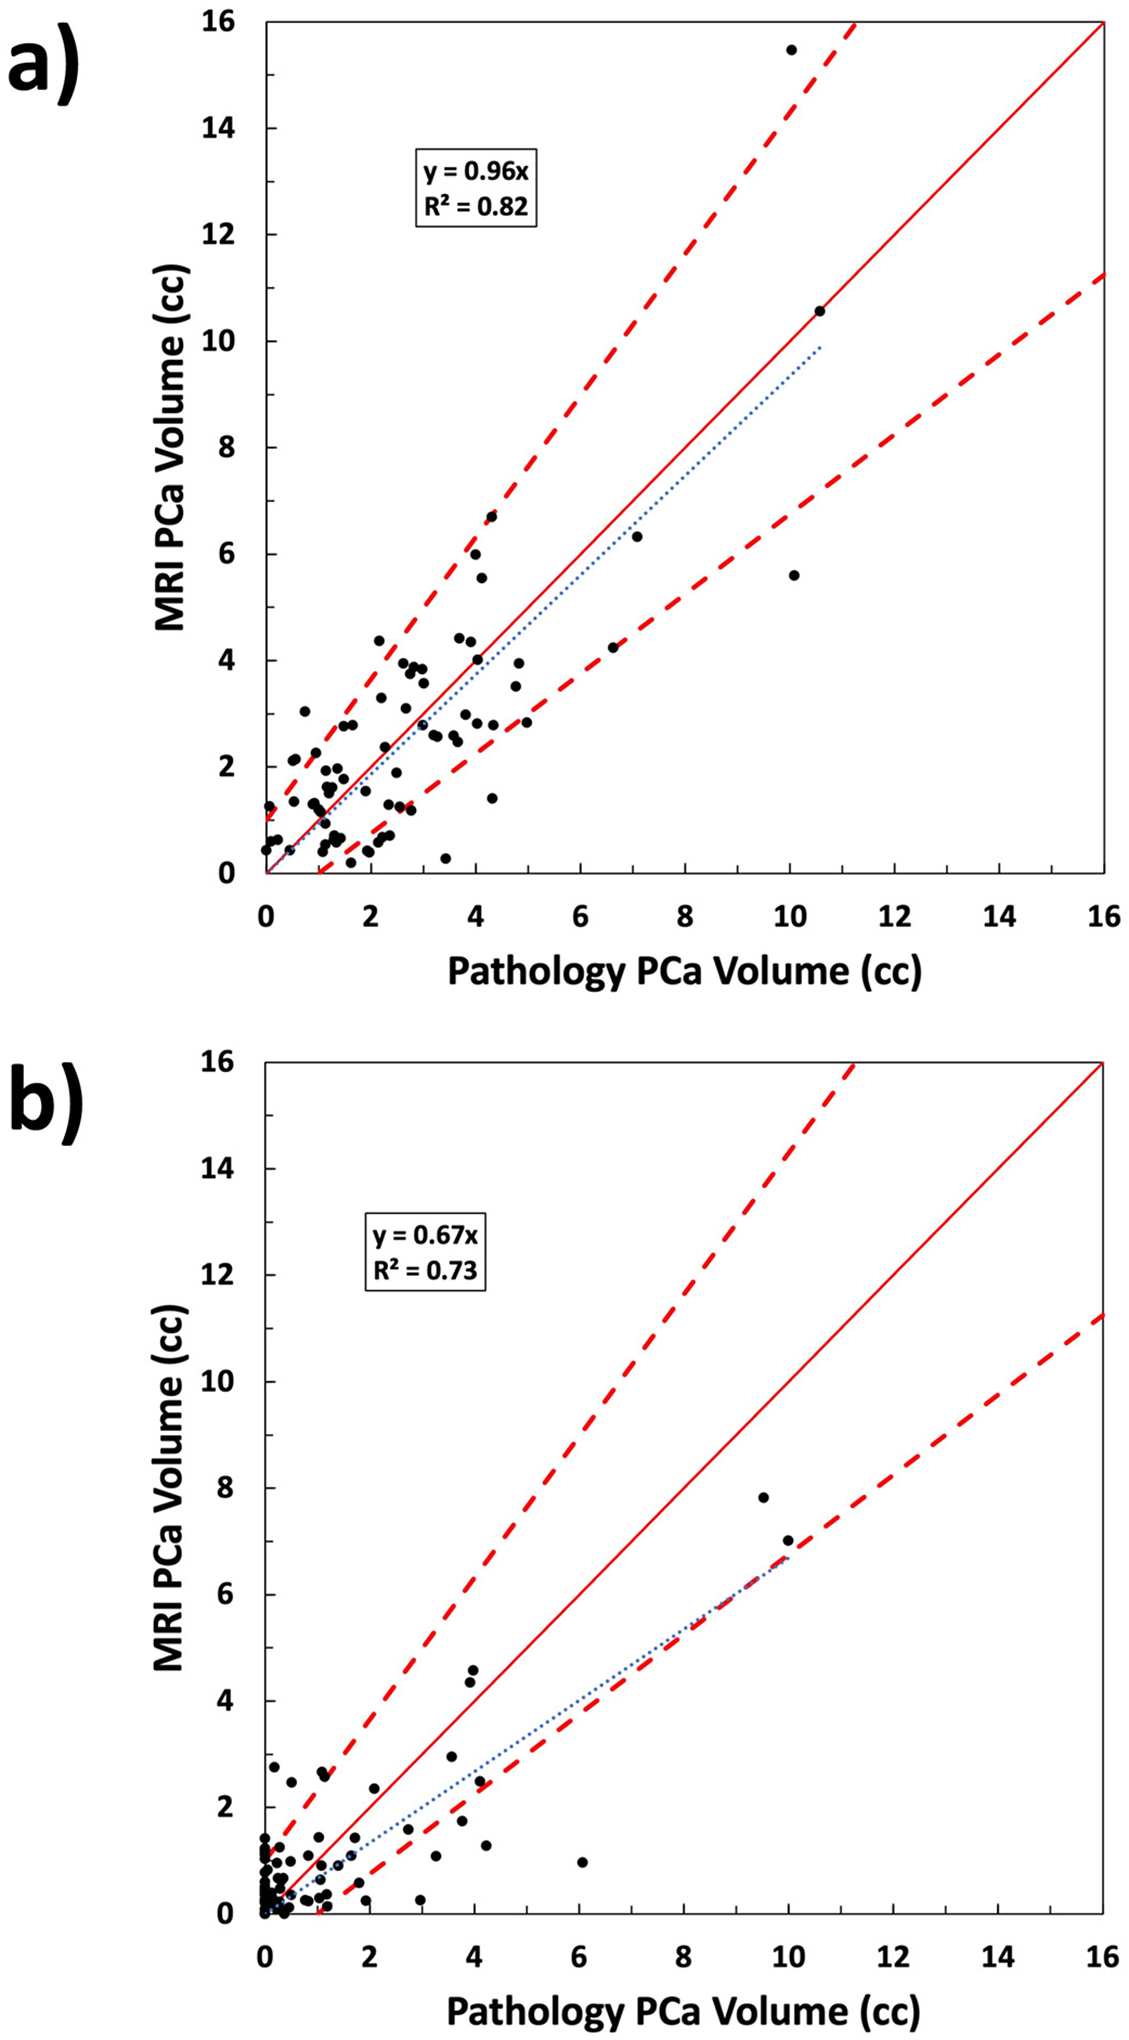
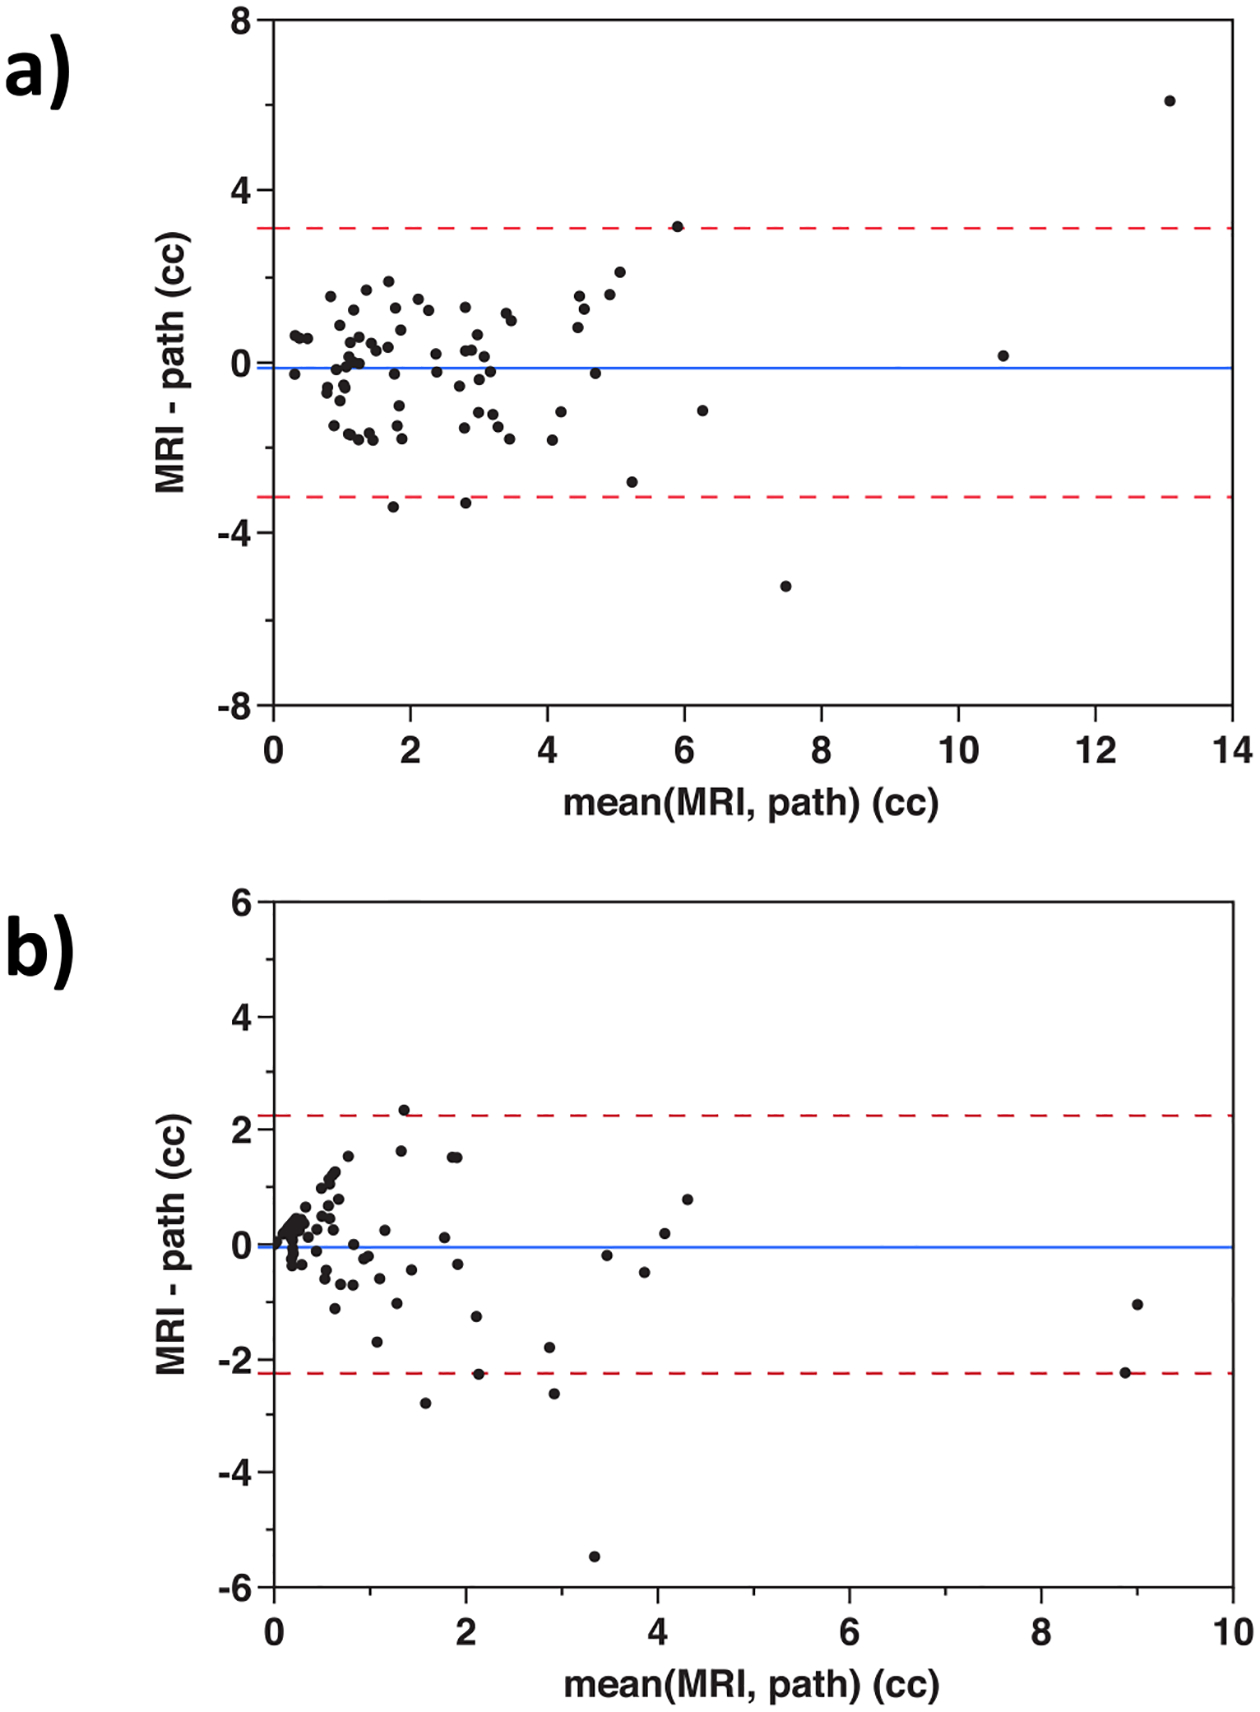
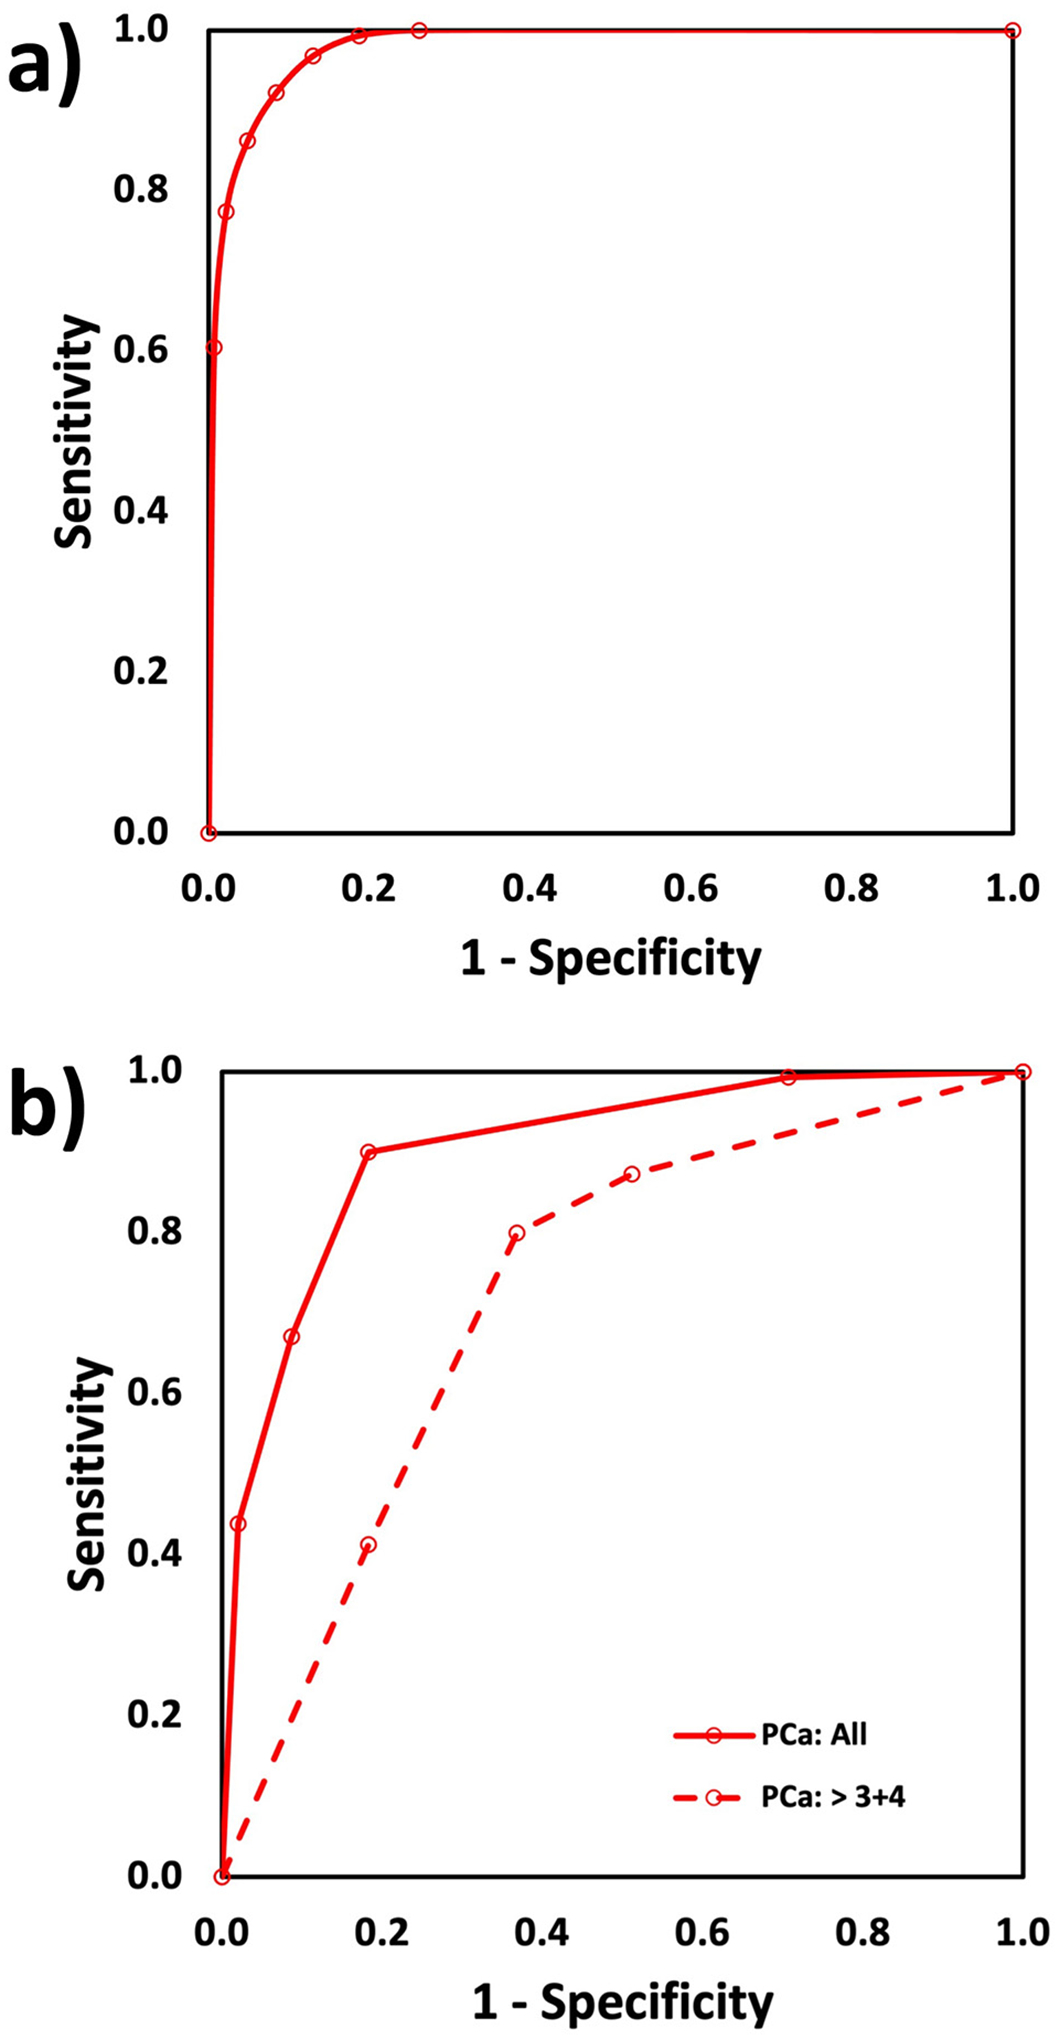
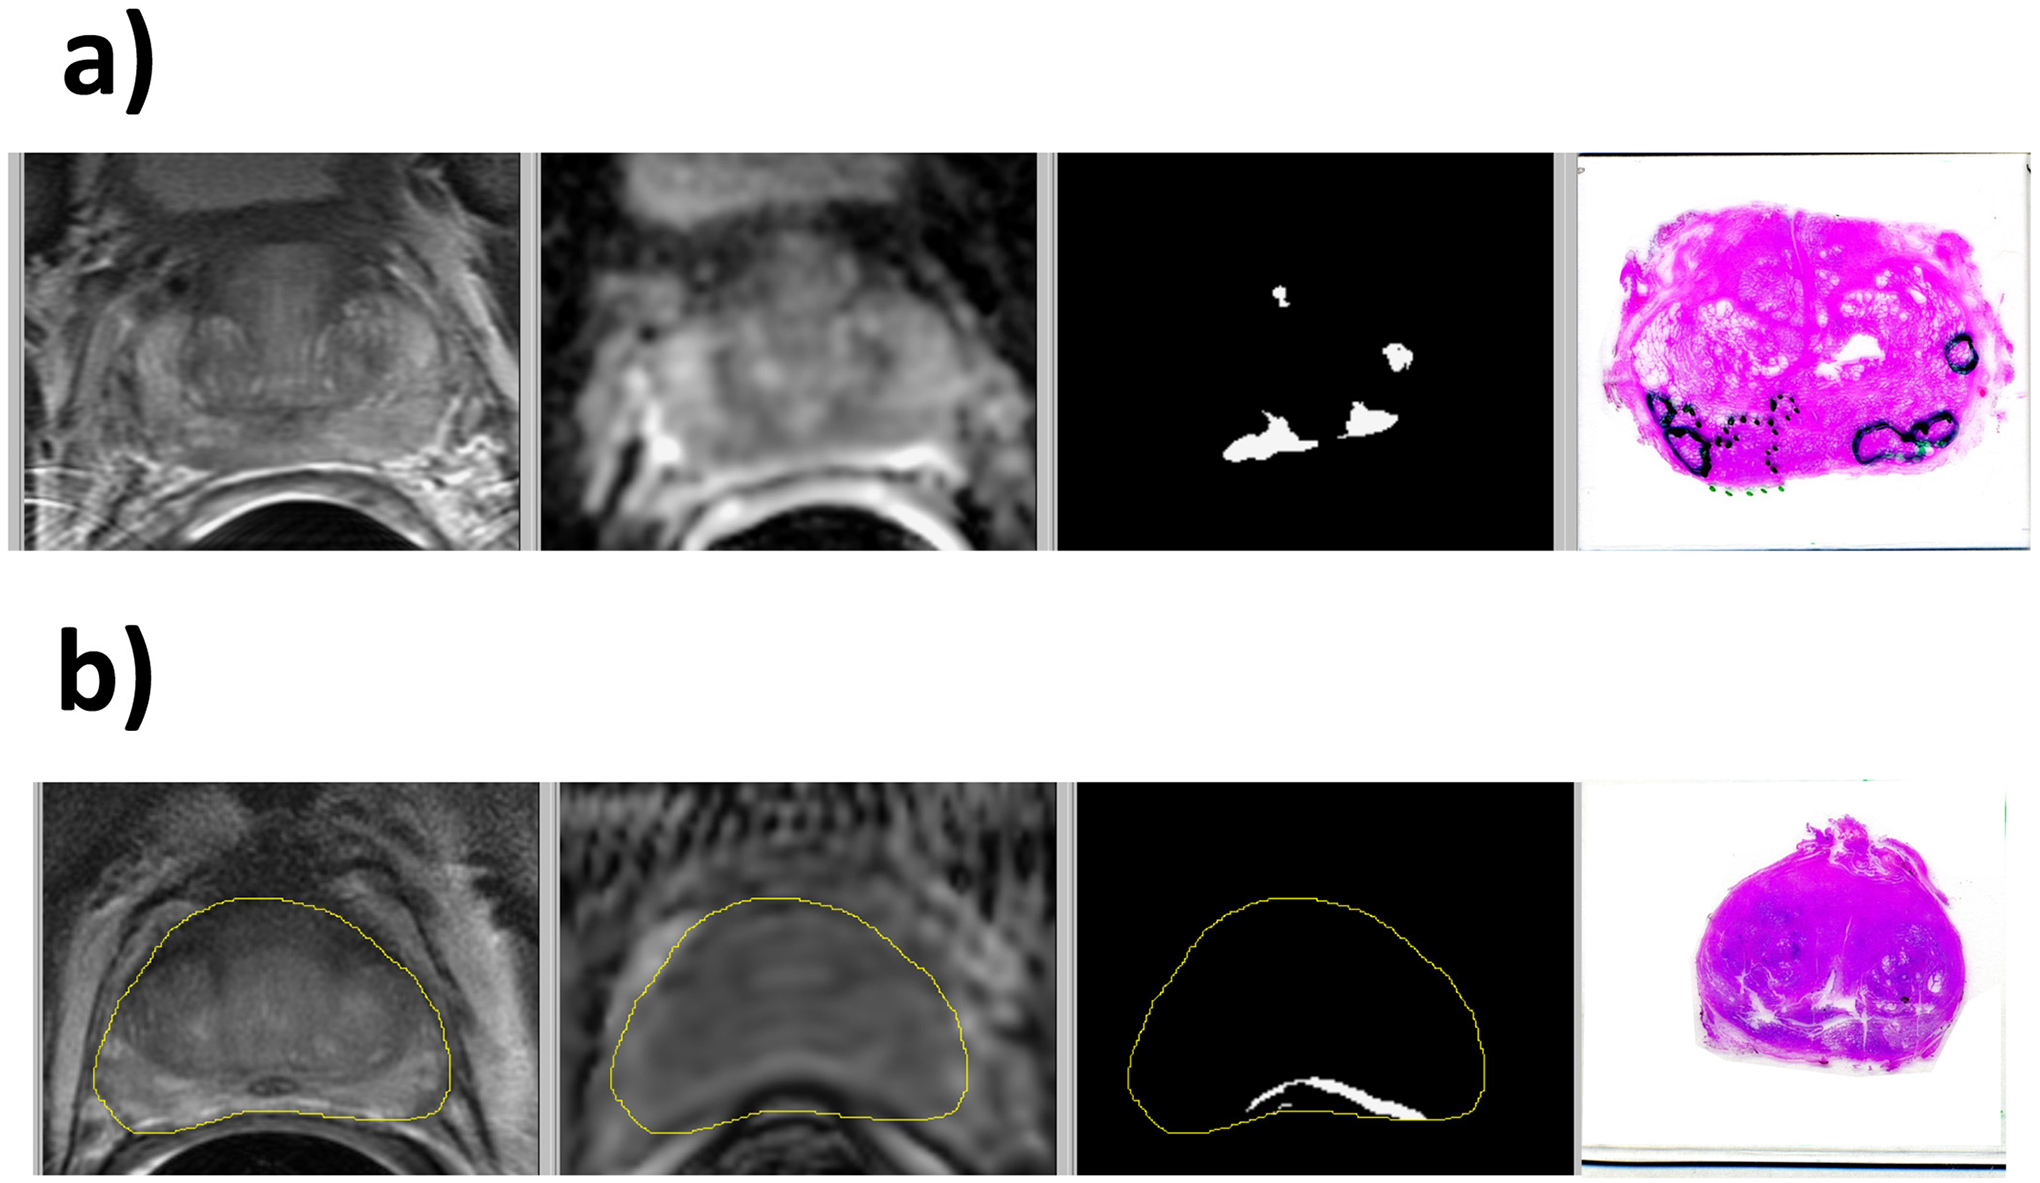
Multi-parametric MRI (mpMRI) has proven itself a clinically useful tool to assess prostate cancer (PCa). Our objective was to generate PCa risk maps to quantify the volume and location of both all PCa and high grade (Gleason grade group ≥ 3) PCa. Such capabilities would aid physicians and patients in treatment decisions, targeting biopsy, and planning focal therapy. A cohort of men with biopsy proven prostate cancer and pre-prostatectomy mpMRI were studied. PCa and benign ROIs (1524) were identified on mpMRI and histopathology with histopathology serving as the reference standard. Logistic regression models were created to differentiate PCa from benign tissues. The MRI images were registered to ensure correct overlay. The cancer models were applied to each image voxel within prostates to create probability maps of cancer and of high-grade cancer. Use of an optimum probability threshold quantified PCa volume for all lesions >0.1 cc. Accuracies were calculated using area under the curve (AUC) for the receiver operating characteristic (ROC). The PCa models utilized apparent diffusion coefficient (ADC), T2 weighted (T2W), dynamic contrast-enhanced MRI (DCE MRI) enhancement slope, and DCE MRI washout as the statistically significant MRI scans. Application of the PCa maps method provided total PCa volume and individual lesion volumes. The AUCs derived from lesion analysis were 0.91 for all PCa and 0.73 for high-grade PCa. At the optimum threshold, the PCa maps detected 135 / 150 (90%) histopathological lesions >0.1 cc. This study showed the feasibility of cancer risk maps, created from pre-prostatectomy, mpMR images validated with histopathology, to detect PCa lesions >0.1 cc. The method quantified the volume of cancer within the prostate. Method improvements were identified by determining root causes for over and underestimation of cancer volumes. The maps have the potential for improved non-invasive capability in quantitative detection, localization, volume estimation, and MRI characterization of PCa.

Keywords: Diffusion-weighted imaging; Dynamic contrast-enhanced imaging; Histopathology; Multiparametric MRI; Prostate cancer.


Conflict of interest statement

Declaration of Competing Interest None.

Figures

Fig. 1.
Fig. 1.
Prostate cancer maps flowchart.
Fig. 2.
Fig. 2.
Examples of MRI lesion volume versus histology lesion volume with different classification results: a) TP when the MRI lesion size is within the outlier limits. b) FP when the MRI lesion size is larger than 1.33 • volumepathology + 1 cc. c) FN when the MRI lesion volume is <0.75 • (volumepathology − 1 cc).
Fig. 3.
Fig. 3.
Images from a 70 year-old male with serum PSA of 9.8 ng/ml and GG3 prostate cancer who underwent radical prostatectomy: a) H&E stained histology specimen, b) coil-corrected T2-weighted FSE image, c) ADC map, d) fractional anisotropy map, e) DCE MRI enhancement slope, and f) DCE MRI washout slope. The mpMRI images were combined in a logistic regression model to generate the cancer risk maps in the TZ and the PZ. In this example, a combination of hypointense T2W, ADC, and DCE MRI washout plus hyperintense DCE MRI enhancement slope resulted in a high-risk region in the cancer maps and lesions identified by the outline of the cancer masks for all PCa (yellow) and aggressive PCa (red).
Fig. 4.
Fig. 4.
Prostate cancer volume comparison of MRI cancer map versus histopathology for a) all PCa and b) PCa with Gleason grade group 3–5. Cases with overestimated (underestimated) cancer volume are above (below) the solid red one-to-one line. Dashed bounding lines were defined to indicate outliers. Percentage of cases within the boundaries were 77% for a) and 75% for b).
Fig. 5.
Fig. 5.
Bland-Altman plots of PCa volume for each case comparing MRI to pathology for a) total cancer volume and b) Gleason grade group 3–5 cancer volume.
Fig. 6.
Fig. 6.
ROC curves for the PCa maps comparison of MRI versus histology: a) total volume of PCa and benign (AUC = 0.98) and b) PCa lesion analysis to identify lesions larger than 0.1 cc for all PCa vs benign (AUC = 0.91) and GG 3–5 vs GG < 3 (AUC = 0.73).
Fig. 7.
Fig. 7.
Examples of cases with outlier MRI PCa volumes: a) HGPIN resulting in false positive PCa in the left PZ and b) distortion of the ADC image causing false positive PCa near the rectum. The images are T2W, ADC, lesion mask, and histopathology. In the histology images, PCa is bounded by dotted lines, and HGPIN is bounded by solid lines.

References

    1. Siegel RL, Miller KD, Fuchs HE, Jemal A. Cancer statistics, 2022. CA Cancer J Clin 2022;72:7–33. - PubMed
    1. Resnick MJ, Koyama T, Fan KH, et al. Long-term functional outcomes after treatment for localized prostate cancer. N Engl J Med 2013;368(5):436–45. 10.1056/NEJMoa1209978. - DOI - PMC - PubMed
    1. Epstein JI, Partin AW, Sauvageot J, Walsh PC. Prediction of progression following radical prostatectomy. A multivariate analysis of 721 men with long-term follow-up. Am J Surg Pathol 1996;20(3):286–92. 10.1097/00000478-199603000-00004. - DOI - PubMed
    1. Hoeks CM, Barentsz JO, Hambrock T, et al. Prostate cancer: multiparametric MR imaging for detection, localization, and staging. Radiology 2011;261(1):46–66. 10.1148/radiol.11091822. - DOI - PubMed
    1. Johnson LM, Turkbey B, Figg WD, Choyke PL. Multiparametric MRI in prostate cancer management. Nat Rev Clin Oncol 2014;11(6):346–53. 10.1038/nrclinonc.2014.69. - DOI - PMC - PubMed

Publication types