. 2023 Jan 14;14(1):223.
doi: 10.1038/s41467-023-35923-4.

Transformer for one stop interpretable cell type annotation

Affiliations

Transformer for one stop interpretable cell type annotation

Jiawei Chen et al. Nat Commun. .

Abstract

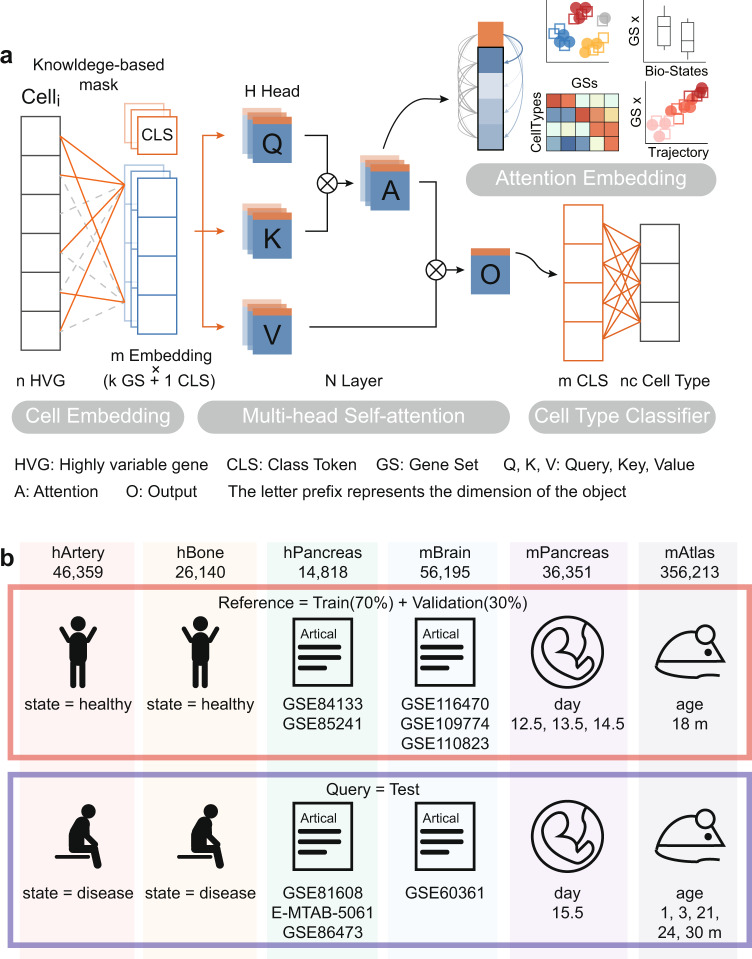
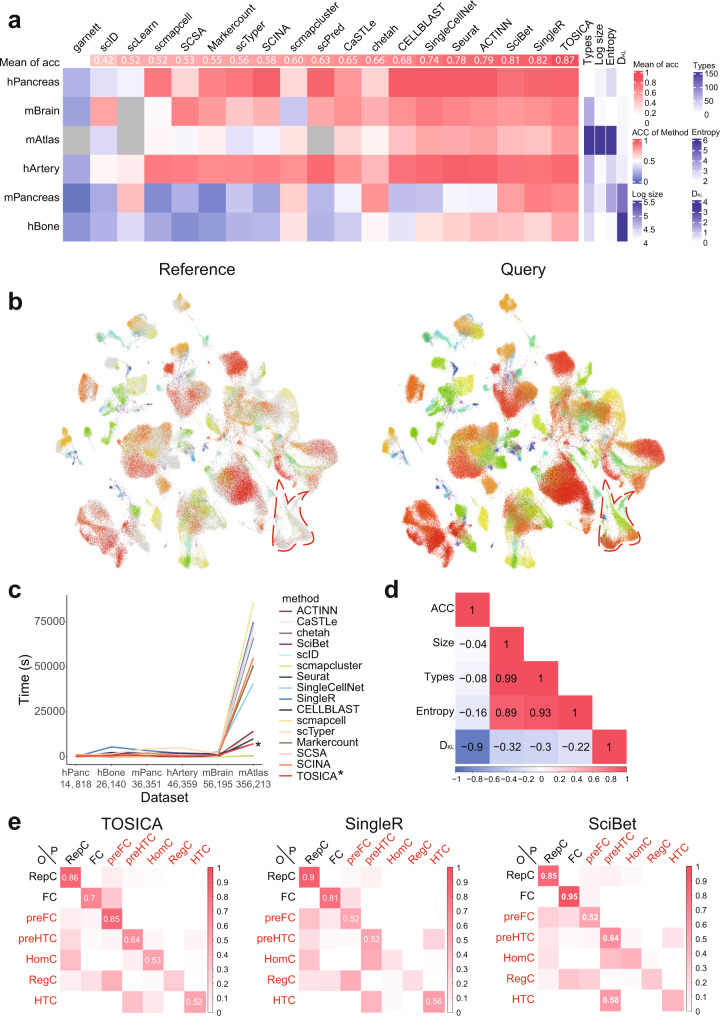
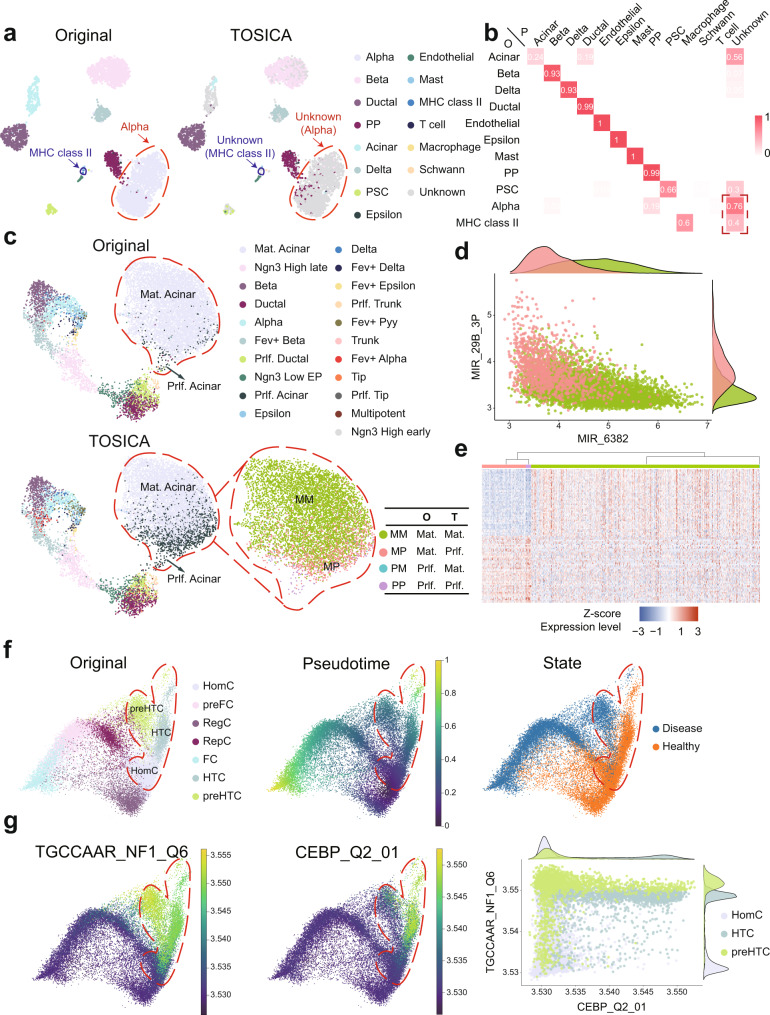
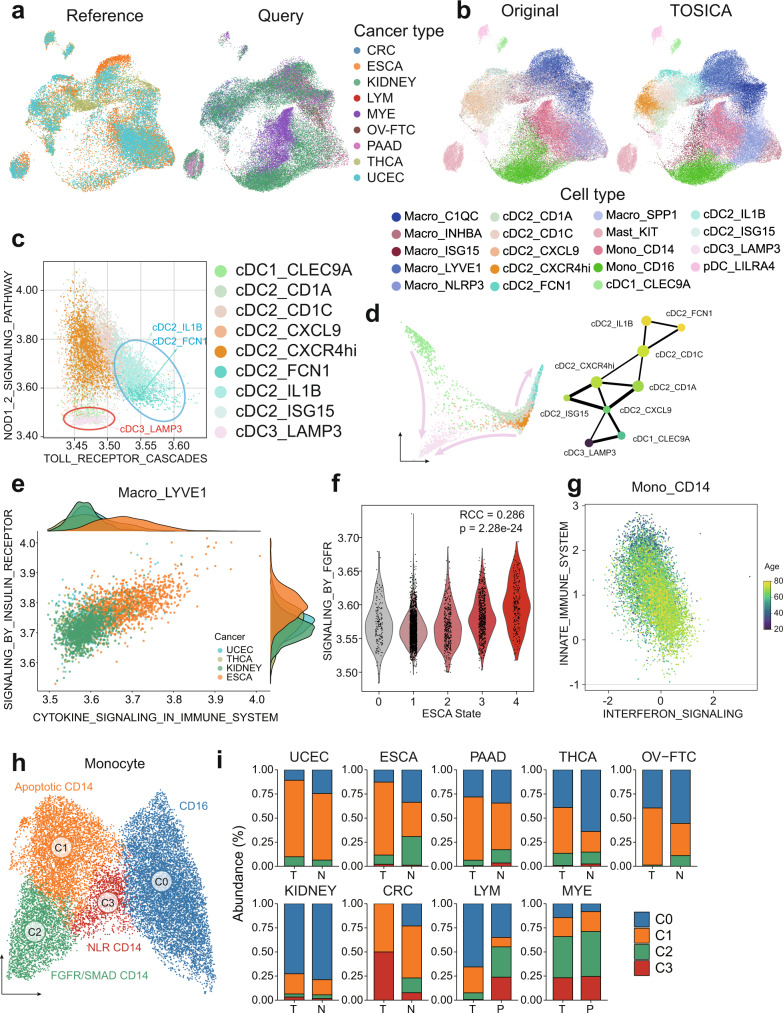
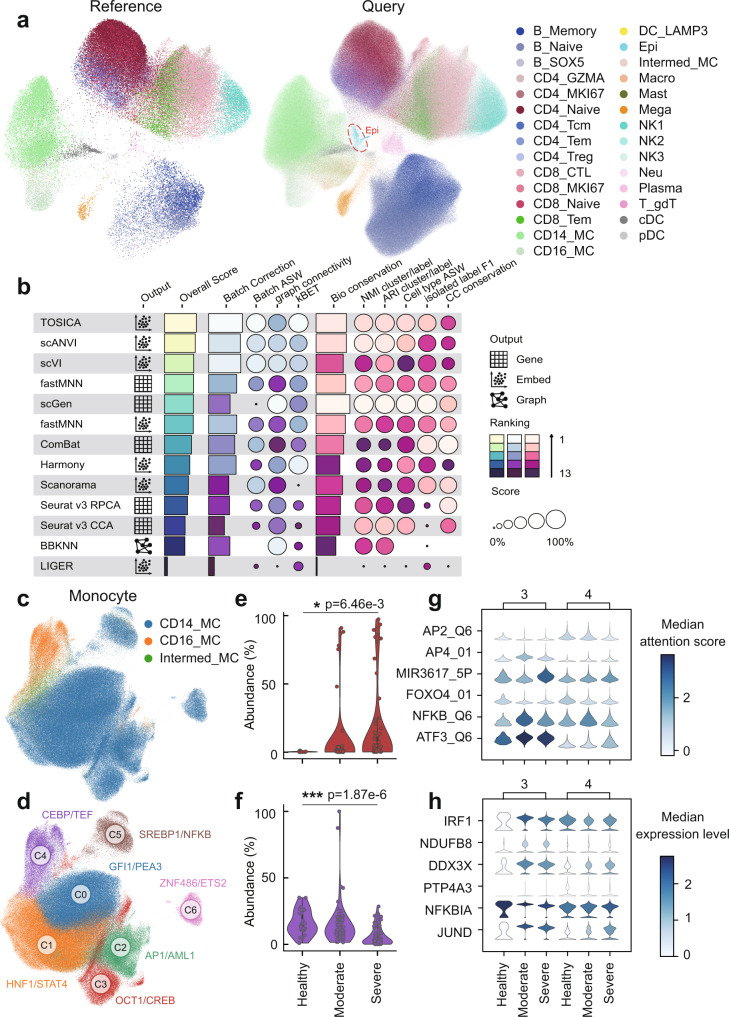
Consistent annotation transfer from reference dataset to query dataset is fundamental to the development and reproducibility of single-cell research. Compared with traditional annotation methods, deep learning based methods are faster and more automated. A series of useful single cell analysis tools based on autoencoder architecture have been developed but these struggle to strike a balance between depth and interpretability. Here, we present TOSICA, a multi-head self-attention deep learning model based on Transformer that enables interpretable cell type annotation using biologically understandable entities, such as pathways or regulons. We show that TOSICA achieves fast and accurate one-stop annotation and batch-insensitive integration while providing biologically interpretable insights for understanding cellular behavior during development and disease progressions. We demonstrate TOSICA's advantages by applying it to scRNA-seq data of tumor-infiltrating immune cells, and CD14+ monocytes in COVID-19 to reveal rare cell types, heterogeneity and dynamic trajectories associated with disease progression and severity.


Conflict of interest statement

The authors declare no competing interests.

Figures

Fig. 1
Fig. 1. Algorithmic framework of TOSICA.
a The model is trained on single-cell RNA sequencing data and cell type label for each cell. Based on databases or expert knowledge, masked learnable embeddings are used to convert the reference input data (n genes) to k input tokens representing each gene set (GS), to which class token (CLS) is added. In the attention function, query (Q), key (K), and value (V) matrix are linearly projected from these GSs and CLS combined tokens and the weights (attention, A) is computed by a compatibility function of the Q with the corresponding K, then assigned to each V for computing output (O). In each Multi-head Self-attention layer, the attention function is performed H times in parallel. The CLS of O, considered as latent space of each cell, is used as input of the whole conjunction neural network cell type classifier. Meanwhile, the attention of class (CLS) token to gene set (GS) tokens is referred as attention score and used for cell embedding. b hArtery and hBone datasets use healthy samples as training data and predict disease samples. hPancreas and mBrain datasets are split by data source. Training and test data in mPancreas and mAtlas come from different timepoints.
Fig. 2
Fig. 2. Universality of TOSICA on different datasets.
a TOSICA ranks first on mean accuracy compared to 18 other cell type annotators on different datasets. Columns are sorted by the mean accuracy of each method on all datasets (top). The number of cell types (Types), number of cells (Log size), Shannon-entropy (Entropy) in reference, and Kullback-Leibler divergence (DKL) between reference and query are labeled on the right. Gray means this dataset is too large for this method to deal with. b TOSICA succeeds in matching cells in query (mouse age ≠ 18 months) to reference (mouse age = 18 months) on mAtlas as shown by TOSICA attention embedded UMAP. The UMAP is done on the whole mAtlas dataset, including both reference and query. Cells in the reference (left panel) or query (right panel) are colored by cell types while cells in the query (left panel) or reference (right panel) are colored gray. The same types of cells from reference and query are located in the same cluster. Circled cells are rare in reference but clustered correctly in the query by TOSICA. c Runtime of TOSICA (marked by *) is relatively stable with increasing data size, and the fourth shortest on mAtlas. hPanc and mPanc stand for hPancreas and mPancreas. d DKL has the most negative impact on accuracy. Heatmap shows the correlation between accuracy (ACC) and number of cells (Size), number of cell types (Types), Shannon-entropy (Entropy), and Kullback-Leibler divergence (DKL). e TOSICA performs better than two other top-ranked methods on five cell types unbalanced between reference and query (red labels). Heatmap shows the proportion of cells in each row with cell type O (original label, shown on the right) is predicted as cell type P (prediction, shown on the top). Cell types are ordered by ratios of their proportions in reference to query. Data are normalized within each row (origin label). Only values >0.5 are labeled. Source data are provided as a Source data file.
Fig. 3
Fig. 3. One stop interpretable de novo, high resolution, dynamic, and hierarchical annotation for biological insights by TOSICA.
a TOSICA successfully isolates and labels the masked alpha cells as ‘Unknown’ cell type. UMAP is based on attention of hPancreas test set. Red circled and marked by red arrows are manually deleted alpha cells and blue circled and marked by blue arrows are MHC class II cells, originally not present in training set. These two kinds of cells are learned as isolated ‘Unknown’ cell types, and are separated by TOSICA attention scores’ UMAP. b TOSICA labels most of alpha cell and little other cell types as unknown. Heatmap shows proportion of cells in each row with original label O (original label, shown on the right) predicted as cell type P (prediction, shown on the top). See Supplementary Fig. 9 for comparison to other methods. c Some originally labeled mature Acinar (Mat., top) are predicted by TOSICA as proliferative Acinar (Prlf., bottom), red circled. UMAP is based on attention of mPancreas test set. The inset illustrates naming of MM, MP, PM, and PP, originally (O) labeled versus TOSICA (T) labeled. d Two pathways’ attention score separate the MM and MP. e Hierarchical clustering of DEGs between the originally labeled Mat. Acinar and Prlf. Acinar also groups MM and PM together, and MP and PP together. f The proportion changes of 3 cell types in the human bone (red circled) during the transition from healthy to osteoarthritis (OA), shown by diffusion map of hBone, colored by originally labeled cell type (left), pseudotime (middle) and sample status (healthy versus OA (right). Embedding is based on TOSICA attention. g High level of NF1 tracks the trajectory from HomC to HTC and preHTC (red circled) shown by diffusion map of hBone, colored by attention score of NF1 pathways (left), and by scatter plot (right), where lower CEBP attention score in preHTC versus HTC associates with OA (middle and right). Source data are provided as a Source data file.
Fig. 4
Fig. 4. TOSICA resolves pan-cancer tumor infiltrating myeloid cell heterogeneity.
a, b TOSICA predicts cell types reliably across different cell types even when the reference and query contain no overlapping cancer types as shown by TOSICA attention embedded UMAP. UMAP is colored by the cancer types in the reference (3, left panel in a), in query (6, right panel in a), and by cell types in the query as originally labeled (left panel in b) and predicted by TOSICA (right panel in b). c cDC2_FCN1, cDC2_IL1B, and cDC3_LAMP3 distinguish from other cell types in attention scores of 2 REACTOME pathways. Each dot represents one cell and is colored by cell types. d Three developmental trajectories from cDC2_CXCL9 and cDC1_CLEC9A to cDC3_LAMP3 and cDC2 to cDC2_FCN1, cDC2_IL1B delineated by TOSICA attention embedded diffusion map (left) and partition-based graph abstraction (PAGA) (right). Edge weights in PAGA represent confidence for the connections between cell types, colored by pseudotime. e Macro_LYVE1 of ESCA distinguish from that of other cancers in attention scores of 2 REACTOME pathways. f Attention score of SIGNALING_BY_FGFR increases with advanced stage of ESCA. Statistical test is two-sided. g INNATE_IMMUNE_SYSTEM is downregulated and INTERFERON_SIGNALING is upregulated during aging in Mono_CD14. Dots are colored by age. h Attention score based UMAP identifies 4 subtypes of monocytes. i The distribution of the 4 monocyte subtypes changes with tumor (T) versus matching normal (N) tissues or peripheral blood (P) in different cancer types. Source data are provided as a Source data file.
Fig. 5
Fig. 5. TOSICA reveals change in transcription factor activity during moderate and severe COVID-19.
a TOSICA predicts cell types reliably across different cell types even when using healthy individuals as reference (left) and COVID19 patients as query (right). Colors denote 29 origin labels. Red circled cell types are unique in query. b Comparison of integration accuracy on query data places TOSICA first among 13 methods. Each score is minimum–maximum scaled between 0 and 1. Overall scores are computed using a 40:60-weighted mean of batch correction and bio-conservation scores. c, d TOSICA attention score based UMAP predicts 3 known (c) and 6 novel (d) monocyte types. e, f Subtype 3 monocytes increases (e) and subtype 4 decreases (f) in abundance from healthy (N = 25), to moderate (N = 79), and to severe (N = 91) COVID-19. Statistical test is two-sided. * RCC p < 0.05; ***p < 0.001. g TOSICA attention score of 6 transcription factors distinguishes subtype 3 and 4 monocytes across different states of COVID19. h The expression levels of major targets of the 6 TFs (g) generally show consistent trends with TFs attention score. Source data are provided as a Source data file.

References

    1. Sandberg R. Entering the era of single-cell transcriptomics in biology and medicine. Nat. Methods. 2014;11:22–24. doi: 10.1038/nmeth.2764. - DOI - PubMed
    1. Butler A, Hoffman P, Smibert P, Papalexi E, Satija R. Integrating single-cell transcriptomic data across different conditions, technologies, and species. Nat. Biotechnol. 2018;36:411–420. doi: 10.1038/nbt.4096. - DOI - PMC - PubMed
    1. Stuart T, et al. Comprehensive integration of single-cell data. Cell. 2019;177:1888–1902 e1821. doi: 10.1016/j.cell.2019.05.031. - DOI - PMC - PubMed
    1. Xu C, Su ZC. Identification of cell types from single-cell transcriptomes using a novel clustering method. Bioinformatics. 2015;31:1974–1980. doi: 10.1093/bioinformatics/btv088. - DOI - PMC - PubMed
    1. Xie BB, Jiang Q, Mora A, Li XR. Automatic cell type identification methods for single-cell RNA sequencing. Comput. Struct. Biotec. 2021;19:5874–5887. doi: 10.1016/j.csbj.2021.10.027. - DOI - PMC - PubMed

Publication types