EEG Entropy in REM Sleep as a Physiologic Biomarker in Early Clinical Stages of Alzheimer's Disease
- PMID: 36641682
- PMCID: PMC10039707
- DOI: 10.3233/JAD-221152
EEG Entropy in REM Sleep as a Physiologic Biomarker in Early Clinical Stages of Alzheimer's Disease
Abstract
Background: Alzheimer's disease (AD) is associated with EEG changes across the sleep-wake cycle. As the brain is a non-linear system, non-linear EEG features across behavioral states may provide an informative physiologic biomarker of AD. Multiscale fluctuation dispersion entropy (MFDE) provides a sensitive non-linear measure of EEG information content across a range of biologically relevant time-scales.
Objective: To evaluate MFDE in awake and sleep EEGs as a potential biomarker for AD.
Methods: We analyzed overnight scalp EEGs from 35 cognitively normal healthy controls, 23 participants with mild cognitive impairment (MCI), and 19 participants with mild dementia due to AD. We examined measures of entropy in wake and sleep states, including a slow-to-fast-activity ratio of entropy (SFAR-entropy). We compared SFAR-entropy to linear EEG measures including a slow-to-fast-activity ratio of power spectral density (SFAR-PSD) and relative alpha power, as well as to cognitive function.
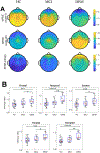
Results: SFAR-entropy differentiated dementia from MCI and controls. This effect was greatest in REM sleep, a state associated with high cholinergic activity. Differentiation was evident in the whole brain EEG and was most prominent in temporal and occipital regions. Five minutes of REM sleep was sufficient to distinguish dementia from MCI and controls. Higher SFAR-entropy during REM sleep was associated with worse performance on the Montreal Cognitive Assessment. Classifiers based on REM sleep SFAR-entropy distinguished dementia from MCI and controls with high accuracy, and outperformed classifiers based on SFAR-PSD and relative alpha power.
Conclusion: SFAR-entropy measured in REM sleep robustly discriminates dementia in AD from MCI and healthy controls.
Keywords: Alzheimer’s disease; EEG; REM sleep; entropy; mild cognitive impairment; sleep.
Conflict of interest statement
The authors have no relevant conflicts of interest to report. Sebastian Moguilner has received research funding from the Alzheimer’s Association. Rani Sarkis received grants from the National Institutes of Health (K23 NS119798) during the submitted work, and research support from Biogen. Stephen Gomperts has served on Advisory Boards of Jannsen, Acadia, Sanofi, and EIP, has received consulting fees from EIP Pharma, and receives funding from the NIH (R01AG077611, R01AG054551, R01AG066171, 1R56AG070827, U01NS119562, R41NS122576, P30AG062421), the DOD CDMRP, the Michael J. Fox Foundation, the FFFPRI, and the Lewy Body Dementia Association. Alice Lam has received consulting fees from Sage Therapeutics, Neurona Therapeutics, and Cognito Therapeutics, and has received research funding from the NIH (K23NS101037, R21AG064413), the Alzheimer’s Association, and Sage Therapeutics.
Figures


References
-
- Gaugler J, James B, Johnson T, Marin A, Weuve J (2019) 2019 Alzheimer’s disease facts and figures. Alzheimer’s Dement 15, 321–387.
-
- Scheltens P, Blennow K, Breteler MMB, de Strooper B, Frisoni GB, Salloway S, Van der Flier WM (2016) Alzheimer’s disease. Lancet (London, England) 388, 505–517. - PubMed
-
- Masters CL, Bateman R, Blennow K, Rowe CC, Sperling RA, Cummings JL (2015) Alzheimer’s disease. Nat Rev Dis Prim 1, 15056. - PubMed
-
- Tan C-C, Yu J-T, Tan L (2014) Biomarkers for preclinical Alzheimer’s disease. J Alzheimer’s Dis 42, 1051–1069. - PubMed
-
- Hansson O (2021) Biomarkers for neurodegenerative diseases. Nat Med 27, 954–963. - PubMed
Publication types
MeSH terms
Grants and funding
LinkOut - more resources
Full Text Sources
Medical
Research Materials

