. 2023 Feb:354:368-393.
doi: 10.1016/j.jconrel.2023.01.025. Epub 2023 Jan 18.

Mitochondria-containing extracellular vesicles (EV) reduce mouse brain infarct sizes and EV/HSP27 protect ischemic brain endothelial cultures

Affiliations

Mitochondria-containing extracellular vesicles (EV) reduce mouse brain infarct sizes and EV/HSP27 protect ischemic brain endothelial cultures

Kandarp M Dave et al. J Control Release. 2023 Feb.

Abstract

Ischemic stroke causes brain endothelial cell (BEC) death and damages tight junction integrity of the blood-brain barrier (BBB). We harnessed the innate mitochondrial load of BEC-derived extracellular vesicles (EVs) and utilized mixtures of EV/exogenous 27 kDa heat shock protein (HSP27) as a one-two punch strategy to increase BEC survival (via EV mitochondria) and preserve their tight junction integrity (via HSP27 effects). We demonstrated that the medium-to-large (m/lEV) but not small EVs (sEV) transferred their mitochondrial load, that subsequently colocalized with the mitochondrial network of the recipient primary human BECs. Recipient BECs treated with m/lEVs showed increased relative ATP levels and mitochondrial function. To determine if the m/lEV-meditated increase in recipient BEC ATP levels was associated with m/lEV mitochondria, we isolated m/lEVs from donor BECs pre-treated with oligomycin A (OGM, mitochondria electron transport complex V inhibitor), referred to as OGM-m/lEVs. BECs treated with naïve m/lEVs showed a significant increase in ATP levels compared to untreated OGD cells, OGM-m/lEVs treated BECs showed a loss of ATP levels suggesting that the m/lEV-mediated increase in ATP levels is likely a function of their innate mitochondrial load. In contrast, sEV-mediated ATP increases were not affected by inhibition of mitochondrial function in the donor BECs. Intravenously administered m/lEVs showed a reduction in brain infarct sizes compared to vehicle-injected mice in a mouse middle cerebral artery occlusion model of ischemic stroke. We formulated binary mixtures of human recombinant HSP27 protein with EVs: EV/HSP27 and ternary mixtures of HSP27 and EVs with a cationic polymer, poly (ethylene glycol)-b-poly (diethyltriamine): (PEG-DET/HSP27)/EV. (PEG-DET/HSP27)/EV and EV/HSP27 mixtures decreased the paracellular permeability of small and large molecular mass fluorescent tracers in oxygen glucose-deprived primary human BECs. This one-two punch approach to increase BEC metabolic function and tight junction integrity may be a promising strategy for BBB protection and prevention of long-term neurological dysfunction post-ischemic stroke.

Keywords: BBB protection; Extracellular vesicles; Heat shock protein; Ischemic stroke; Mitochondria; Paracellular permeability.


Figures

Fig. 1.
Fig. 1.. Physicochemical characteristics, membrane integrity, and protein content-based EV characterization.
(a) Average particle diameters, dispersity indices, and zeta potentials of fresh hCMEC/D3 BEC-derived EVs were determined using dynamic light scattering on a Malvern Zetasizer Pro-Red. Samples were diluted to 0.1 mg protein/mL in 1x PBS for particle diameter and 10 mM HEPES buffer pH 7.4 for zeta potential measurements. Data are presented as mean±SD of n=3 measurements. EV particle concentrations were measured using nanoparticle tracking analysis (NTA). For NTA, stock samples of sEV and m/lEV were diluted 100 times in PBS and analyzed on a multiple-laser ZetaView f-NTA Nanoparticle Tracking Analyzer (Particle Metrix Inc., Mebane, NC). Three 60 s videos were acquired at 520 nm laser wavelengths for particle diameter and concentration measurements. Average particle concentrations were reported as mean ± standard deviation of n=3 measurements. (b-c) The histograms of calcein-positive events of intact sEVs (b) and m/lEVs (c) of freshly-isolated (initial) and samples post-three FT cycles were detected using a small particle side scatter 488/10-nm filter in an Attune flow cytometer. Unstained EVs were used to gate the histograms for estimating percentage calcein-positive counts. (d-f) Detection of membrane protein markers of sEVs and m/lEVs-derived from hCMEC/D3 cells using western blot analysis. Western blot shows the relative expression of calnexin (90 kD), CD63 (29 kD), CD9 (24 kD), and GAPDH (37 kD) protein in sEVs and m/lEVs. The total protein content in the cell lysates, sEV, and m/lEV was measured using a micro BCA assay. Fifty μg protein/sample was incubated with Laemmli sample buffer at 95°C for 5 min. The sample was run on sodium dodecyl sulfate-polyacrylamide gel electrophoresis, proteins were transferred to a nitrocellulose membrane, and the membrane was incubated with a blocking buffer. The blot was incubated with primary antibodies overnight at 4°C, and secondary antibodies at room temperature. The blots were imaged on the 800 nm channel using an Odyssey imager (LI-COR Inc. Lincoln, NE) at intensity setting 5 and processed using ImageStudio 5.2 software. Uncropped western blots of triplicate runs are shown in Fig. S3.
Fig. 2:
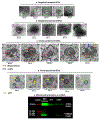
Fig. 2:. Transmission electron microscopy and western blot analysis of sEVs and m/lEVs.
Negative stain TEM images of hCMEC/D3-derived sEV (a) and m/lEV (b). Representative TEM images of sectioned m/lEVs (c) and sEVs (d). m/lEVs (blue arrow) contained one or more mitochondria (electron-dense structures, maroon arrows). sEV cross sections (yellow arrow) lacked electron-dense structures in the lumen. Scale bars of 400 nm and 200 nm. (e) Detection of mitochondrial proteins in sEVs and m/lEVs using western blot analysis. The uncropped western blots of triplicate runs are shown in Fig. S7a,b.
Fig. 3.
Fig. 3.. Transfer of EV mitochondria into recipient HBMECs cells at varying doses.
HBMECs cells were cultured in 48-well plates for 48 h in a humidified incubator. Cells were then incubated with the indicated amounts of MitoTracker red-labeled samples: (MitoT-red)-sEV, MitoT-red-EV (at a 1:1 sEV:m/lEV ratio, collectively referred to as EVs) and MitoT-red-m/lEV diluted in complete growth medium for 72 h. Post-incubation, the cells were washed, collected, and run through the Attune NxT flow cytometer. The histograms of hCMEC/D3 cells treated at indicated doses of MitoT-red-m/lEVs (a), sEV:m/lEV 1:1 (b), and sEV (c) were collected using a 674/10-nm side scatter filter in the Attune flow cytometer. Untreated HBMECs and unstained EVs were used as controls to gate the background signals in histograms. MitoT-red-stained HBMECs were used as a positive control to gate the histograms for MitoT-red-positive counts. Subsequently, this gate was applied to quantify the percentage of MitoT-red HBMECs treated with MitoT-red-EVs. (d) Quantification of sEV and m/lEV-mediated mitochondria transfer in recipient HBMECs. Data represent mean±SD of n=3.
Fig. 4.
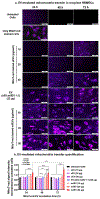
Fig. 4.. Transfer of EV mitochondria into the recipient HBMEC at varying doses and incubation times.
(a) HBMECs were cultured in 96-well plates until 80% confluency in a humidified incubator. Cells were then incubated with the indicated amounts of MitoTracker red-labeled samples: (MitoT-red)-sEVs, MitoT-red-EV (at a 1:1 sEV: m/lEV ratio), MitoT-red-m/lEVs diluted in complete growth medium for 24, 48, and 72 h. Post-incubation, the cells were washed and incubated with phenol-red-free growth medium. Intracellular MitoT-red-sEV/sEV:m/lEV/m/lEV signals were observed under an Olympus IX 73 epifluorescent inverted microscope using Cy5 channel (purple puncta) at 20x magnification. Scale bar: 50 μm. (b) EV mitochondria transfer quantification. HBMECs were treated with the indicated samples and doses for 24, 48, and 72 h. At each time point, from each control and treatment group, at least three images were acquired and the total sum of grayscale signal intensities in the Cy5 channel was estimated using Olympus CellSens software. The measured intensities were normalized with those of the untreated cells.
Fig. 5.
Fig. 5.. Colocalization of EV mitochondria with the recipient HBMEC mitochondria.
(a) HBMECs were cultured in 96-well plates until 80% confluency in a humidified incubator. HBMECs were stained with Mitotracker Green for 30 min. Post-staining, the cells were washed and treated with the indicated doses of MitoT-red-sEV, MitoT-red-EVs (at a 1:1 sEV: m/lEV ratio, collectively referred to as EVs), and MitoT-red-m/lEV for 72 h. Untreated cells and cells stained with MitoTracker Green only were used as controls. Post-incubation, the treatment mixture was replaced with phenol-red-free growth medium. The Mitotracker green staining in recipient HBMEC was acquired using the GFP channel, whereas the purple fluorescence associated with EV mitochondria was captured using Cy5 channel in an Olympus IX 73 epifluorescent inverted microscope. Colocalization of the mitochondria signals was confirmed by the presence of yellow signals in the overlay images. Scale bar: 50 μm. (b) Pearson’s correlation coefficient was obtained from the overlay images of Cy5 and GFP channels at constant signal intensities for both channels using a Cell Insight CX7 HCS microscope. Data are presented as mean±SD (n=3 images per treatment group). *p<0.05, **p<0.01, ***p<0.001, ****p<0.0001
Fig. 6.
Fig. 6.. EV-mediated increase in HBMEC ATP levels and mitochondrial respiration during normoxic and hypoxic conditions.
HBMEC cells were cultured in the 96-well plates until 80% confluency in a humidified incubator. (a-c) Confluent monolayers were treated with sEV, m/lEV, and EVs (sEV: m/lEV 1:1) at the indicated amounts for 24 (a), 48 (b), and 72h (c). Polyethyleneimine, PEI, at 50 μg/mL was used as a positive control for the ATP assay. Post-treatment, cells were incubated with a 1:1 mixture of fresh growth medium and Cell titer Glo reagent. The relative luminescence units (RLU) of the samples were measured using a SYNERGY HTX multimode plate reader at 1s integration time. Relative ATP levels were calculated by normalizing the RLU of treatment groups to the RLU of control, untreated cells. (d) Confluent HBMECs were treated with the indicated doses of sEV and m/lEV in OGD medium and relative ATP levels were measured 24 h post-treatment while untreated cells were used as a control. Data represent mean ±SD (n=3). (e) Particle diameters of naïve and OGM-EVs. EVs were isolated from either untreated hCMEC/D3 cells (naïve sEVs and m/lEVs) or cells pretreated 1 μM of oligomycin A (OGM-sEV and OGM-m/lEVs). Naïve and OGM-EVs were suspended in 1x PBS at 0.1 mg EV protein/mL concentration and particle diameters were measured using Malvern Zetasizer Pro. (f-h) Effect of RTN-EV and OGM-EVs treatment on HBMEC ATP levels in OGD conditions. Recipient HBMECs were incubated with naïve, RTN-EVs, and OGM-sEVs. EVs were isolated from the conditioned medium of hCMEC/D3 BECs pretreated with 1 μM OGM for 4 h. Confluent HBMECs were treated with the indicated samples at 25 μg EV protein/well in OGD condition for 24 h. Normoxic cells and cells treated with OGD medium (untreated cells) were used as controls. Post-treatment, relative ATP levels were measured using the Cell Titer Glo-based ATP assay. Data represent mean ±SD (n=3). (i-j) EV-mediated increase in recipient cell mitochondrial respiration and glycolysis capacity: Cells were cultured in a Seahorse XF96 plate for 4 days at 20,000 cells/well. sEV, and m/lEV were diluted in complete growth medium at 3.4 μg EV protein/well and cells were incubated in a humidified incubator for 24, 48, and 72 h. Post-treatment at each time point, the medium was replaced with DMEM and maximum oxygen consumption rate (OCR) (i), and glycolytic capacity (j) by measuring extracellular acidification rate (ECAR) were analyzed using the Seahorse XFe96 analyzer. Data represents mean±SEM (n=3). * p<0.05, ** p<0.01, *** p<0.001, **** p<0.0001.
Fig. 7.
Fig. 7.. Pilot study demonstrating potential neuroprotective effects of m/lEVs in a mouse middle cerebral artery occlusion model of ischemia/reperfusion injury (stroke).
(a) Representative 2,3,5-triphenyl tetrazolium chloride (TTC)-stained coronal sections of the vehicle and m/lEV-treated stroke brains from young male mice. (b) Quantification of total hemispheric infarct volume at 24 h post-stroke. Data are mean ± SEM (n=4) and were analyzed using an unpaired t-test.
Fig. 8.
Fig. 8.. Formation of EV- and PEG-DET/HSP27 binary/ternary mixtures.
(a) Native polyacrylamide gel electrophoresis (PAGE) for PEG-DET/HSP27 mixtures. Native HSP27, PEG-DET/HSP27 at indicated weight/weigh (w/w) ratios, and free PEG-DET polymers were mixed with 1x native sample buffer and loaded in an SDS-free 4-10% polyacrylamide gel at 1 μg HSP27 per lane. (c) Native PAGE for hCMEC/D3-derived EV/HSP27 mixtures: Native HSP27 and mixtures of sEV/HSP27 , and m/lEV/HSP27 at 10:1 weight/weight (w/w) ratios were loaded in a SDS-free 4-10% polyacrylamide gel at 1 μg HSP27 per lane. Free sEV and m/lEV equivalent to the amounts in 10:1 w/w mixtures were used as controls. Native PAGE for (PEG-DET/HSP27)/EV ternary mixtures. PEG-DET/HSP27 mixtures were prepared at 20:1 and 30:1 w/w ratios followed by incubation with 10 μg of EVs. The indicated samples were loaded in the gel at 1 μg HSP27/lane. Each gel was run at 100 V for 2 h and stained using Biosafe Coomassie G250. The gel was then scanned at 800 nm using an Odyssey imager at intensity setting 5. (b,d) Densitometry analysis was performed by measuring band densities of HSP27 in the different experimental groups in comparison to the band density of native HSP27 in the respective gel using Image Studio 5.0 software *p<0.05 (e-h) Physicochemical characterization of HSP27 mixtures with PEG-DET and EVs. Average particle diameters (e), and zeta potentials (f) of PEG-DET/HSP27 mixtures and EV/HSP27 mixtures at the indicated w/w ratios. Average particle diameters (g), and zeta potentials (h) of PEG-DET/EV and (PEG-DET/HSP27)/EV ternary mixtures at the indicated weight ratios. The samples containing 1 μg HSP27 protein were diluted to 50 μL in 10 mM HEPES buffer pH 7.4 for particle diameter measurements. The diluted samples were further diluted to 800 μL in 10 mM HEPES buffer pH 7.4 for zeta potential measurements. Data represent mean±SD (n=3). * p<0.05, **p<0.01, ***p<0.001, ****p<0.0001
Fig. 9.
Fig. 9.. Paracellular permeability of 4.4 kD TRITC-Dextran under OGD, and OGD/reperfusion conditions in pretreated HBMEC transwell culture inserts.
HBMECs were seeded in 24-well plates and maintained in a 37°C humidified incubator for a week. The complete growth medium was replaced with 300 μL of growth media containing indicated treatment groups for 72 h. Post-treatment, the treatment medium was replaced with 300 μL of OGD medium containing 1 μM 4.4 kD TRITC-Dextran for 24 h. The abluminal chamber was filled with 0.5 mL of complete growth medium. Control, untreated cells were incubated in a complete growth medium in a humidified incubator whereas OGD treatment groups were incubated in an OGD chamber. At 4 h post-OGD (a), a 500 μL volume was collected from the abluminal chamber and a fresh medium was added to the transwell inserts. Post-OGD treatment, HBMECs were washed with PBS and incubated with 300 μL of complete growth medium containing 1μM 4.4 kD TRITC-Dextran and incubated in a humidified incubator for 1-24h. At each time point, a 500 μL volume was collected from the abluminal chamber and fresh medium was added to the transwell inserts. The concentration of 4.4 kD TRITC-Dextran was measured at 1 h (OGD/reperfusion 1h, b), 2 h (OGD/reperfusion 2h, c), and 4 h (OGD/reperfusion 4h, d) using a Synergy HTX multimode plate reader at 485/20 nm excitation and 580/50 nm emission settings. The relative diffusion of TRITC 4.4 kD Dextran at each time point was determined by calculating the ratio of [TRITC-Dextran] in the abluminal compartment of treatment groups to that of untreated OGD control. Data represent mean±SD (n=4). * p<0.05, ** p<0.01, *** p<0.001, **** p<0.0001, ns: non-significant.
Fig. 10.
Fig. 10.. Paracellular permeability of 65-85 kD TRITC-Dextran under OGD, and OGD/reperfusion conditions in pretreated HBMEC transwell culture inserts.
HBMECs were seeded in 24-well plates and maintained in a 37°C humidified incubator for a week. The complete growth medium was replaced with 300 μL of growth media containing indicated treatment groups for 72 h. Post-treatment, the treatment medium was replaced with 300 μL of OGD medium containing 1 μM 65-85 kD TRITC-Dextran for 24 h. The abluminal chamber was filled with 0.5 mL of complete growth medium. Control, untreated cells were incubated in a complete growth medium in a humidified incubator whereas OGD treatment groups were incubated in an OGD chamber. At 4 h post-OGD (a), a 500 μL volume was collected from the abluminal chamber and a fresh medium was added to the transwell inserts. Post-OGD treatment, HBMECs were washed with PBS and incubated with 300 μL of complete growth medium containing 1μM 65-85 kD TRITC-Dextran and incubated in a humidified incubator for 1-24 h. At each time point, a 500 μL volume was collected from the abluminal chamber and fresh medium was added to the transwell inserts. The concentration of 65-85 kD TRITC-Dextran was measured at 1 h (OGD/reperfusion 1h, b), 2 h (OGD/reperfusion 2h, c), and 4 h (OGD/reperfusion 4h, d) using a Synergy HTX multimode plate reader at 485/20 nm excitation and 580/50 nm emission settings. The relative diffusion of TRITC 65-85 kD Dextran at each time point was determined by calculating the ratio of [TRITC-Dextran] in the abluminal compartment of treatment groups to that of untreated OGD control. Data represent mean±SD (n=4). * p<0.05, ** p<0.01, *** p<0.001, **** p<0.0001, ns: non-significant.

Similar articles

Cited by

References

    1. Murphy DE, de Jong OG, Brouwer M, Wood MJ, Lavieu G, Schiffelers RM, et al. Extracellular vesicle-based therapeutics: natural versus engineered targeting and trafficking. Experimental & Molecular Medicine. 2019;51(3):1–12. - PMC - PubMed
    1. Doyle LM, Wang MZ. Overview of Extracellular Vesicles, Their Origin, Composition, Purpose, and Methods for Exosome Isolation and Analysis. Cells. 2019;8(7):727. - PMC - PubMed
    1. He Z, Ning N, Zhou Q, Khoshnam SE, Farzaneh M. Mitochondria as a therapeutic target for ischemic stroke. Free Radical Biology and Medicine. 2020;146:45–58. - PubMed
    1. Abdullahi W, Tripathi D, Ronaldson PT. Blood-brain barrier dysfunction in ischemic stroke: targeting tight junctions and transporters for vascular protection. Am J Physiol Cell Physiol. 2018;315(3):C343–C56. - PMC - PubMed
    1. Bernardo-Castro S, Sousa JA, Brás A, Cecília C, Rodrigues B, Almendra L, et al. Pathophysiology of Blood–Brain Barrier Permeability Throughout the Different Stages of Ischemic Stroke and Its Implication on Hemorrhagic Transformation and Recovery. Frontiers in Neurology. 2020;11(1605). - PMC - PubMed

Publication types