. 2023 Jan 16;18(1):40.
doi: 10.1186/s13018-022-03485-8.

Association between total cholesterol and total bone mineral density in US adults: National Health and Nutrition Examination Survey (NHANES), 2011-2018

Affiliations

Association between total cholesterol and total bone mineral density in US adults: National Health and Nutrition Examination Survey (NHANES), 2011-2018

Li Cao et al. J Orthop Surg Res. .

Abstract

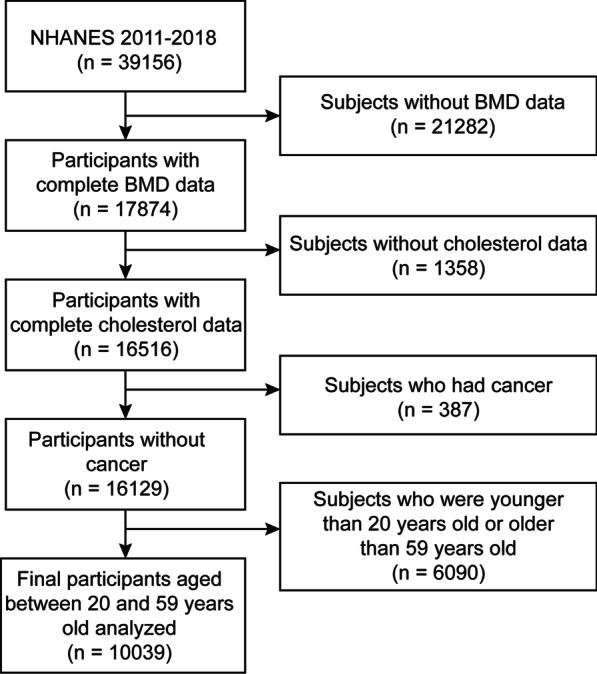
Background: Accumulated evidence indicates that cholesterol is offensive to bone metabolism. Therefore, we examined the real-world study among total cholesterol and total bone mineral density (BMD). We investigated the relationship between total cholesterol and total BMD among 10,039 US participants aged 20-59 years old over the period 2011-2018 from the NHANES.

Methods: To analyze the relationship among total cholesterol and total BMD, multivariate linear regression models were used. Fitted smoothing curves, generalized additive models, and threshold effect analysis were also conducted.

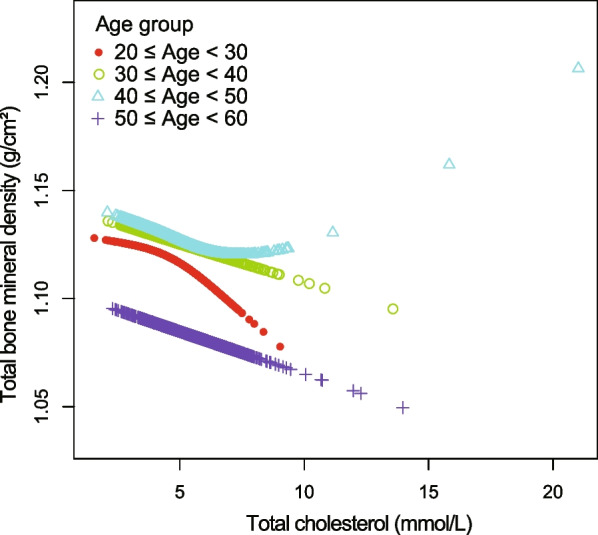
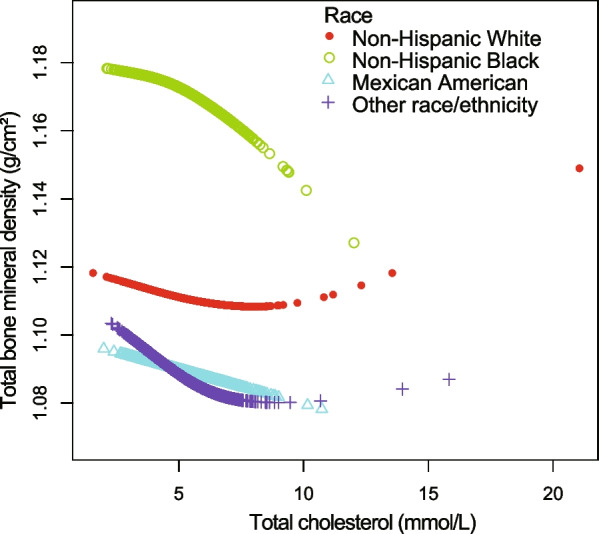
Results: After adjusting for additional covariates, weighted multivariable linear regression models indicated total cholesterol concentration levels exhibited a negative relationship with total BMD, particularly among participants aged 20-29 years. Concerning subgroup analysis, stratified by gender, race/ethnicity and age group, the negative correlation of total cholesterol with total BMD dwelled in both female and male as well as in whites and other races (including Hispanic and Multi-Racial), but not in non-Hispanic blacks and Mexican American. In other races, this relationship presented a nonlinear association (inflection point: 6.7 mmol/L) with a U-shaped curve. Among participants aged 40 to 49 years, this relationship also followed a nonlinear association (inflection point: 5.84 mmol/L), indicating a saturation effect. Moreover, the three types of diabetes status were found to have negative, U-shaped, and positive relationships. In participants with borderline diabetes status, the relationship of total cholesterol with total BMD was a U-shaped curve (inflection point: 4.65 mmol/L).

Conclusions: For US young adults (20-29 years old), our study revealed a negative relationship between total cholesterol and total BMD. This association followed a U-shaped curve (inflection point: 4.65 mmol/L) in borderline diabetes status participants, a saturation curve (inflection point: 5.84 mmol/L) in participants aged 40-49 years and a nonlinear curve (inflection point: 6.7 mmol/L) in other races (including Hispanic and Multi-Racial). Therefore, keeping total cholesterol concentration at a reasonable level for young adults and diabetic population might be an approach to prevent osteoporosis or osteopenia.

Keywords: Bone mineral density; Cholesterol; Osteopenia; Osteoporosis.


Conflict of interest statement

The authors declare that they have no competing interests.

Figures

Fig. 1
Fig. 1
Flowchart of participants selection. NHANES National Health and Nutrition Examination Survey; BMD Bone mineral density
Fig. 2
Fig. 2
Frequency histogram (bin = 0.5) of total cholesterol. A Grouped by gender; B Grouped by race/ ethnicity
Fig. 3
Fig. 3
The relationship between total cholesterol and total bone mineral density. A Each black hollow point exhibits one participant. B Solid red line illustrates the fitted smooth curve among variables. Two blue bands illustrate the 95% confidence interval of the fit. Gender, age, race/ethnicity, education level, marital status, ratio of family income-to-poverty, serum phosphorus, blood urea nitrogen, γ-glutamyl transferase, ALT, AST, lactate dehydrogenase, serum uric acid, triglycerides, BMI, waist circumference, calcium intake, serum calcium, alcohol consumption, high blood pressure, moderate activity, diabetes and smoking were adjusted
Fig. 4
Fig. 4
The relationship between total cholesterol and total bone mineral density stratified by gender. Age, gender, race/ethnicity, ratio of family income-to-poverty, education level, marital status, blood urea nitrogen, serum phosphorus, γ-glutamyl transferase, ALT, AST, lactate dehydrogenase, serum uric acid, triglycerides, BMI, waist circumference, calcium intake, serum calcium, alcohol consumption, high blood pressure, moderate activity, diabetes, and smoking were adjusted
Fig. 5
Fig. 5
The relationship between total cholesterol and total bone mineral density stratified by age. Gender, race/ethnicity, ratio of family income-to-poverty, education level, marital status, blood urea nitrogen, serum calcium, serum phosphorus, γ-glutamyl transferase, ALT, AST, lactate dehydrogenase, serum uric acid, triglycerides, BMI, waist circumference, calcium intake, alcohol consumption, high blood pressure, moderate activity, diabetes, and smoking were adjusted
Fig. 6
Fig. 6
The relationship between total cholesterol and total bone mineral density stratified by race/ethnicity. Age, gender, marital status, ratio of family income-to-poverty, education level, blood urea nitrogen, serum phosphorus, γ-glutamyl transferase, ALT, AST, lactate dehydrogenase, serum uric acid, triglycerides, BMI, waist circumference, calcium intake, serum calcium, alcohol consumption, high blood pressure, moderate activity, diabetes, and smoking were adjusted
Fig. 7
Fig. 7
The relationship between total cholesterol and total bone mineral density stratified by diabetes. Age, gender, race/ethnicity, ratio of family income-to-poverty, education level, marital status, blood urea nitrogen, serum phosphorus, γ-glutamyl transferase, ALT, AST, lactate dehydrogenase, serum uric acid, triglycerides, BMI, waist circumference, calcium intake, serum calcium, alcohol consumption, high blood pressure, moderate activity, and smoking were adjusted

Similar articles

Cited by

References

    1. Tian L, Yu X. Lipid metabolism disorders and bone dysfunction–interrelated and mutually regulated (review) Mol Med Rep. 2015;12(1):783–794. doi: 10.3892/mmr.2015.3472. - DOI - PMC - PubMed
    1. Fu X, Wang Y, He X, et al. A systematic review and meta-analysis of serum cholesterol and triglyceride levels in patients with Parkinson's disease. Lipids Health Dis. 2020;19(1):97–97. doi: 10.1186/s12944-020-01284-w. - DOI - PMC - PubMed
    1. Papathanasiou I, Anastasopoulou L, Tsezou A. Cholesterol metabolism related genes in osteoarthritis. Bone. 2021;152:116076. doi: 10.1016/j.bone.2021.116076. - DOI - PubMed
    1. Choy PC, Siow YL, Mymin D, et al. Lipids and atherosclerosis. Biochem Cell Biol. 2004;82(1):212–224. doi: 10.1139/o03-085. - DOI - PubMed
    1. Song Y, Liu J, Zhao K, et al. Cholesterol-induced toxicity: an integrated view of the role of cholesterol in multiple diseases. Cell Metab. 2021;33(10):1911–1925. doi: 10.1016/j.cmet.2021.09.001. - DOI - PubMed