

Dynamic pressure-volume loop analysis by simultaneous real-time cardiovascular magnetic resonance and left heart catheterization
- PMID: 36642713
- PMCID: PMC9841727
- DOI: 10.1186/s12968-023-00913-4
Dynamic pressure-volume loop analysis by simultaneous real-time cardiovascular magnetic resonance and left heart catheterization
Abstract
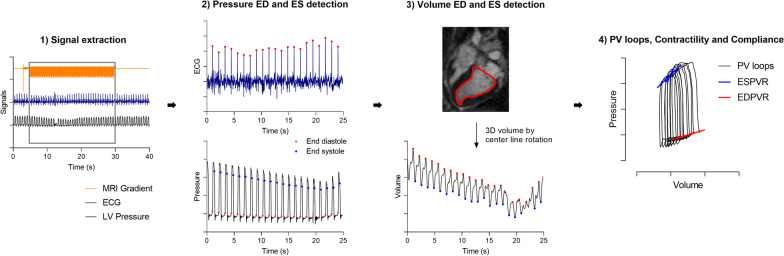
Background: Left ventricular (LV) contractility and compliance are derived from pressure-volume (PV) loops during dynamic preload reduction, but reliable simultaneous measurements of pressure and volume are challenging with current technologies. We have developed a method to quantify contractility and compliance from PV loops during a dynamic preload reduction using simultaneous measurements of volume from real-time cardiovascular magnetic resonance (CMR) and invasive LV pressures with CMR-specific signal conditioning.
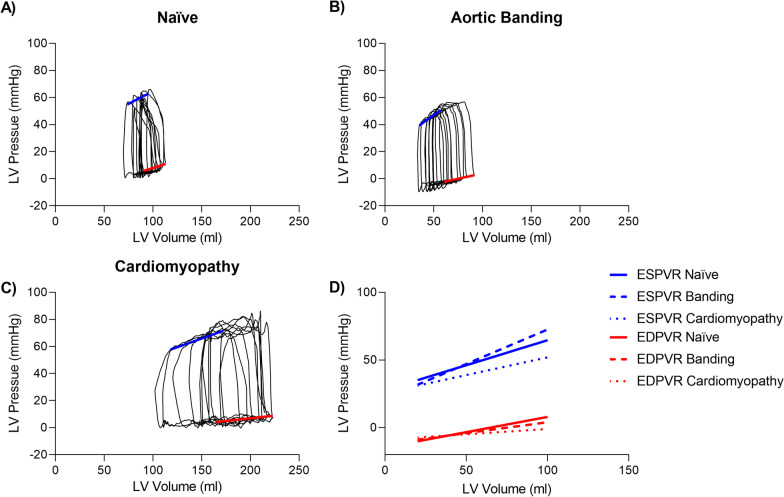
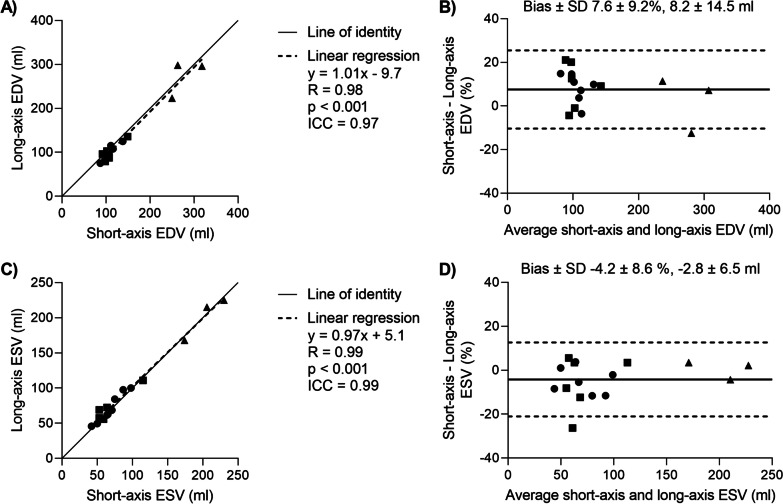
Methods: Dynamic PV loops were derived in 16 swine (n = 7 naïve, n = 6 with aortic banding to increase afterload, n = 3 with ischemic cardiomyopathy) while occluding the inferior vena cava (IVC). Occlusion was performed simultaneously with the acquisition of dynamic LV volume from long-axis real-time CMR at 0.55 T, and recordings of invasive LV and aortic pressures, electrocardiogram, and CMR gradient waveforms. PV loops were derived by synchronizing pressure and volume measurements. Linear regression of end-systolic- and end-diastolic- pressure-volume relationships enabled calculation of contractility. PV loops measurements in the CMR environment were compared to conductance PV loop catheter measurements in 5 animals. Long-axis 2D LV volumes were validated with short-axis-stack images.
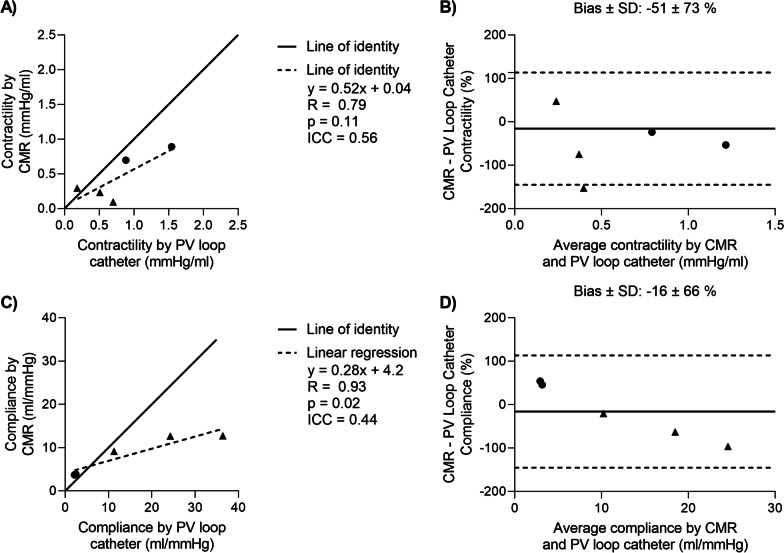
Results: Simultaneous PV acquisition during IVC-occlusion was feasible. The cardiomyopathy model measured lower contractility (0.2 ± 0.1 mmHg/ml vs 0.6 ± 0.2 mmHg/ml) and increased compliance (12.0 ± 2.1 ml/mmHg vs 4.9 ± 1.1 ml/mmHg) compared to naïve animals. The pressure gradient across the aortic band was not clinically significant (10 ± 6 mmHg). Correspondingly, no differences were found between the naïve and banded pigs. Long-axis and short-axis LV volumes agreed well (difference 8.2 ± 14.5 ml at end-diastole, -2.8 ± 6.5 ml at end-systole). Agreement in contractility and compliance derived from conductance PV loop catheters and in the CMR environment was modest (intraclass correlation coefficient 0.56 and 0.44, respectively).
Conclusions: Dynamic PV loops during a real-time CMR-guided preload reduction can be used to derive quantitative metrics of contractility and compliance, and provided more reliable volumetric measurements than conductance PV loop catheters.
Keywords: CMR-guided catheterization; Myocardial compliance; Myocardial contractility; Pressure–volume loops; Real-time CMR.
© 2023. This is a U.S. Government work and not under copyright protection in the US; foreign copyright protection may apply.
Conflict of interest statement
The authors are investigators on a US Government Cooperative Research and Development Agreement (CRADA) with Siemens Healthcare. Siemens participated in the modification of the CMR system from 1.5 T to 0.55 T.
Figures


Similar articles
-
Non-invasive pressure-volume loops using the elastance model and CMR: a porcine validation at transient pre-loads.Eur Heart J Imaging Methods Pract. 2024 Mar 5;2(1):qyae016. doi: 10.1093/ehjimp/qyae016. eCollection 2024 Jan. Eur Heart J Imaging Methods Pract. 2024. PMID: 38645798 Free PMC article.
-
Integrated assessment of diastolic and systolic ventricular function using diagnostic cardiac magnetic resonance catheterization: validation in pigs and application in a clinical pilot study.JACC Cardiovasc Imaging. 2009 Nov;2(11):1271-81. doi: 10.1016/j.jcmg.2009.09.007. JACC Cardiovasc Imaging. 2009. PMID: 19909930
-
Comprehensive cardiac phenotyping in large animals: comparison of pressure-volume analysis and cardiac magnetic resonance imaging in pig post-myocardial infarction systolic heart failure.Int J Cardiovasc Imaging. 2019 Sep;35(9):1691-1699. doi: 10.1007/s10554-019-01610-z. Epub 2019 May 5. Int J Cardiovasc Imaging. 2019. PMID: 31056718
-
Advancements in pressure-volume catheter technology - stress remodelling after infarction.Exp Physiol. 2013 Mar;98(3):614-21. doi: 10.1113/expphysiol.2012.064733. Epub 2012 Oct 12. Exp Physiol. 2013. PMID: 23064506 Review.
-
Guidelines for assessing ventricular pressure-volume relationships in rodents.Am J Physiol Heart Circ Physiol. 2025 Jan 1;328(1):H120-H140. doi: 10.1152/ajpheart.00434.2024. Epub 2024 Dec 3. Am J Physiol Heart Circ Physiol. 2025. PMID: 39625460 Review.
Cited by
-
Non-invasive pressure-volume loops using the elastance model and CMR: a porcine validation at transient pre-loads.Eur Heart J Imaging Methods Pract. 2024 Mar 5;2(1):qyae016. doi: 10.1093/ehjimp/qyae016. eCollection 2024 Jan. Eur Heart J Imaging Methods Pract. 2024. PMID: 38645798 Free PMC article.
-
Cardiac Functional Assessment by Magnetic Resonance Imaging.Cardiol Discov. 2024 Dec;4(4):284-299. doi: 10.1097/CD9.0000000000000141. Epub 2024 Nov 8. Cardiol Discov. 2024. PMID: 39677505 Free PMC article. Review.
-
Crafting a Rigorous, Clinically Relevant Large Animal Model of Chronic Myocardial Ischemia: What Have We Learned in 20 Years?Methods Protoc. 2024 Feb 19;7(1):17. doi: 10.3390/mps7010017. Methods Protoc. 2024. PMID: 38392691 Free PMC article.
-
Cardiac MRI at Low Field Strengths.J Magn Reson Imaging. 2024 Feb;59(2):412-430. doi: 10.1002/jmri.28890. Epub 2023 Aug 2. J Magn Reson Imaging. 2024. PMID: 37530545 Free PMC article. Review.
-
Accelerated deep learning-based function assessment in cardiovascular magnetic resonance.Radiol Med. 2025 Aug;130(8):1149-1157. doi: 10.1007/s11547-025-02019-6. Epub 2025 May 17. Radiol Med. 2025. PMID: 40381163 Free PMC article.
References
Publication types
MeSH terms
Grants and funding
LinkOut - more resources
Full Text Sources
