

Identification of seven hypoxia-related genes signature and risk score models for predicting prognosis for ovarian cancer
- PMID: 36642729
- PMCID: PMC9841006
- DOI: 10.1007/s10142-022-00956-3
Identification of seven hypoxia-related genes signature and risk score models for predicting prognosis for ovarian cancer
Abstract
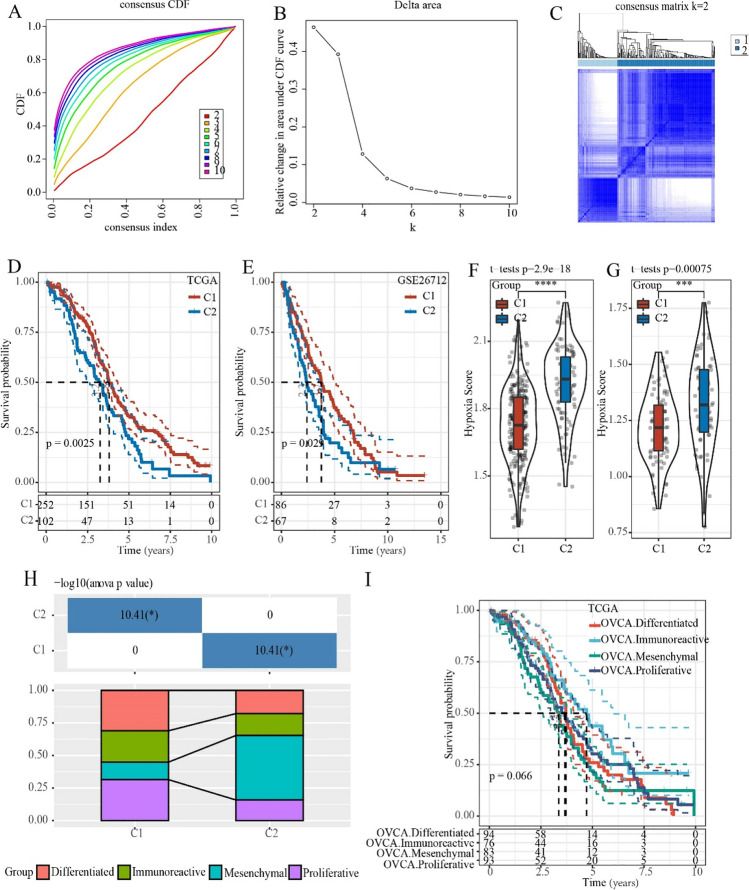
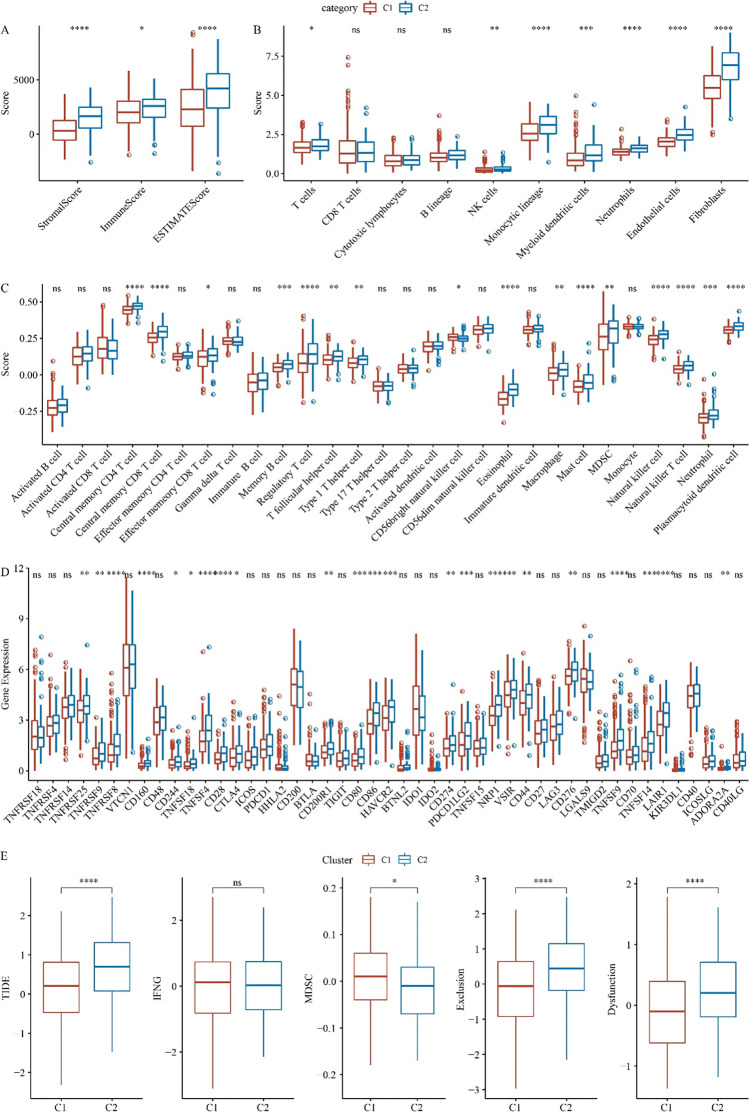
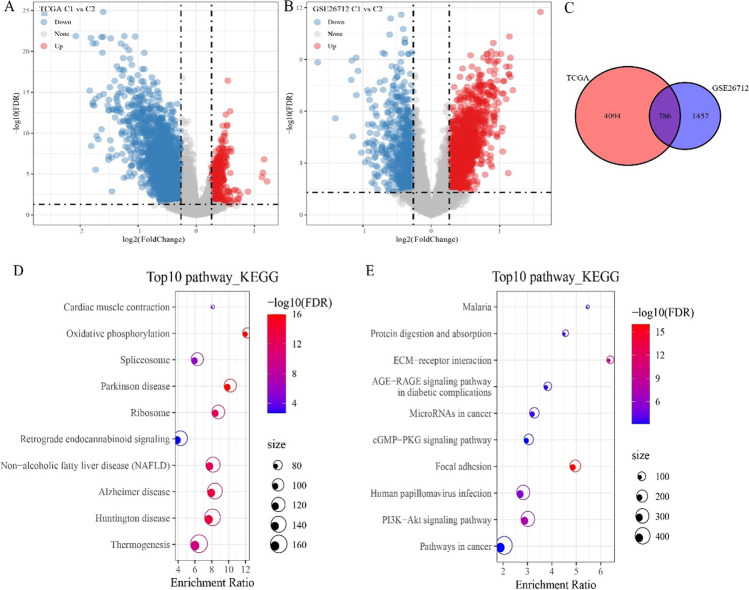
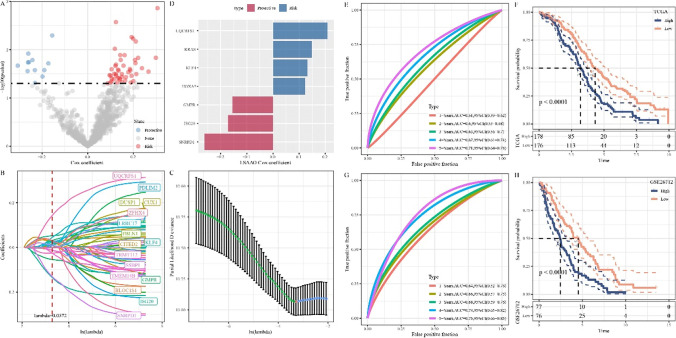
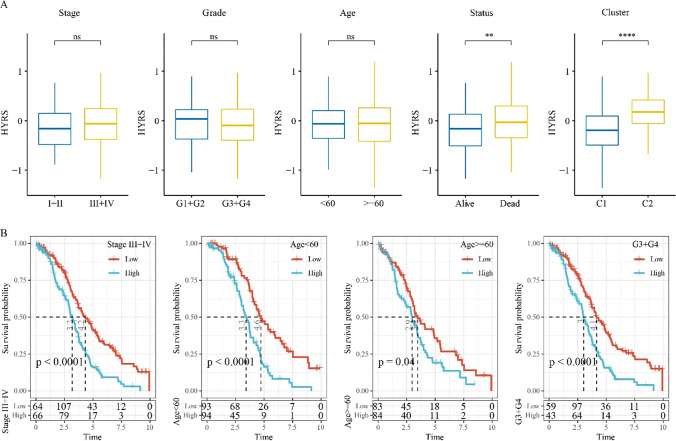
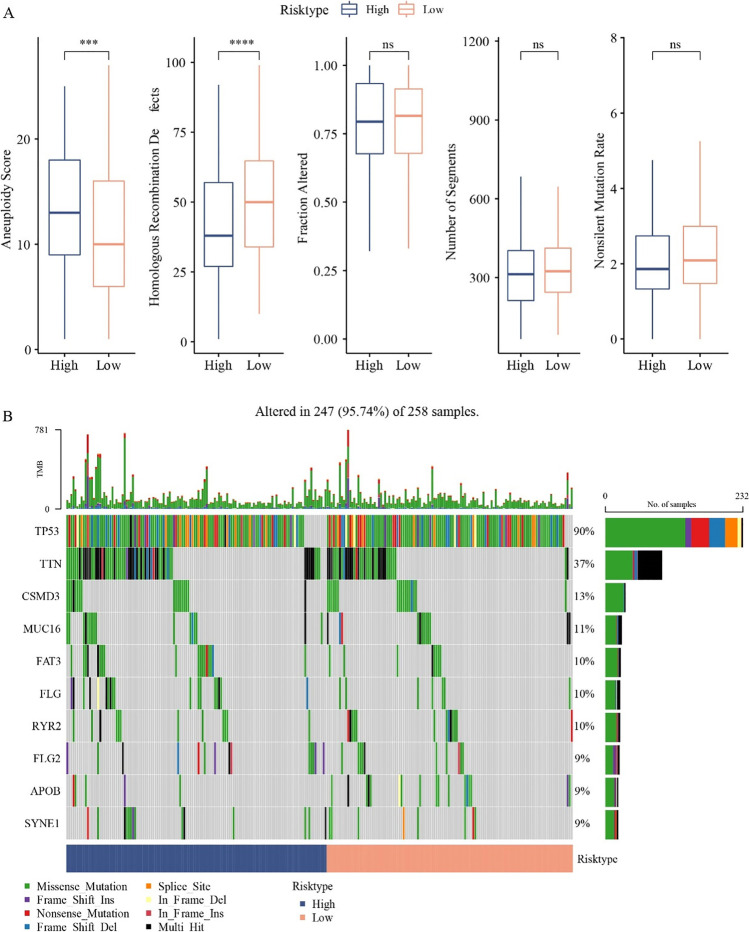
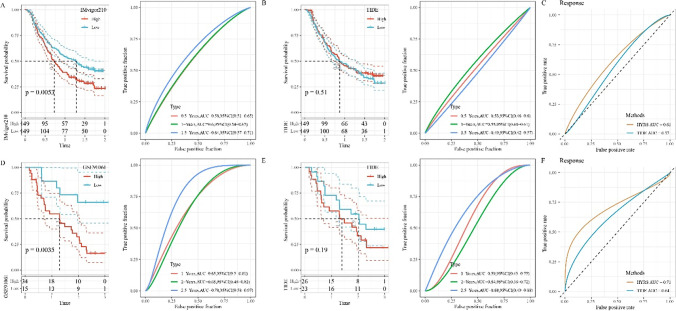
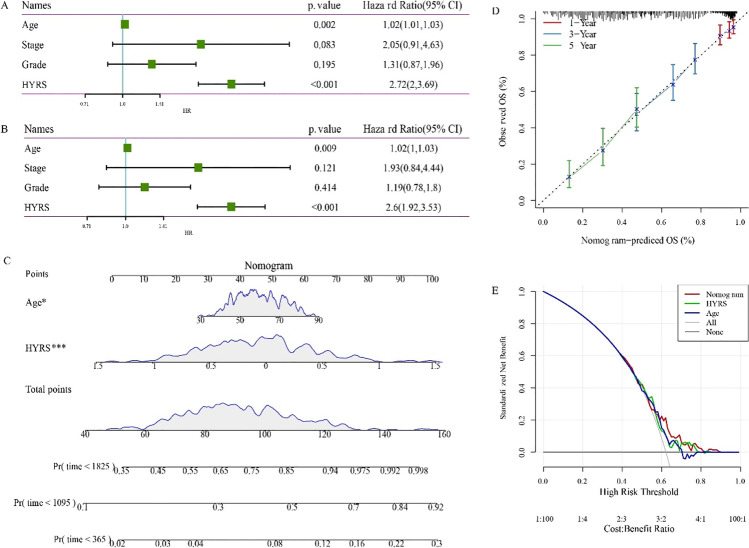
Ovarian cancer (OC) is the most common malignant cancer in the female reproductive system. Hypoxia is an important part of tumor immune microenvironment (TIME), which is closely related to cancer progression and could significantly affect cancer metastasis and prognosis. However, the relationship between hypoxia and OC remained unclear. OCs were molecularly subtyped by consensus clustering analysis based on the expression characteristics of hypoxia-related genes. Kaplan-Meier (KM) survival was used to determine survival characteristics across subtypes. Immune infiltration analysis was performed by using Estimation of Stromal and Immune cells in Malignant Tumors using Expression data (ESTIMATE) and microenvironment cell populations-counter (MCP-Counter). Differential expression analysis was performed by using limma package. Next, univariate Cox and least absolute shrinkage and selection operator (LASSO) regression analyses were used to build a hypoxia-related risk score model (HYRS). Mutational analysis was applied to determine genomic variation across the HYRS groups. The Tumor Immune Dysfunction and Exclusion (TIDE) algorithm was used to compare the effectiveness of HYRS in immunotherapy prediction. We divided OC samples into two molecular subtypes (C1 and C2 subtypes) based on the expression signature of hypoxia genes. Compared with C1 subtype, there was a larger proportion of poor prognosis genotypes in the C2 subtype. And most immune cells scored higher in the C2 subtype. Next, we obtained a HYRS based on 7 genes. High HYRS group had a higher gene mutation rate, such as TP53. Moreover, HYRS performed better than TIDE in predicting immunotherapy effect. Combined with clinicopathological features, the nomogram showed that HYRS had the greatest impact on survival prediction and a strong robustness.
Keywords: Biomarkers; Hypoxia; Ovarian cancer; Prognosis; TIME.
© 2023. The Author(s).
Conflict of interest statement
The authors declare no competing interests.
Figures
Similar articles
-
Development of a novel hypoxia-immune-related LncRNA risk signature for predicting the prognosis and immunotherapy response of colorectal cancer.Front Immunol. 2022 Sep 14;13:951455. doi: 10.3389/fimmu.2022.951455. eCollection 2022. Front Immunol. 2022. PMID: 36189298 Free PMC article.
-
Identification of STEAP3-based molecular subtype and risk model in ovarian cancer.J Ovarian Res. 2023 Jun 29;16(1):126. doi: 10.1186/s13048-023-01218-x. J Ovarian Res. 2023. PMID: 37386521 Free PMC article.
-
Identification of Hypoxia-Related Subtypes, Establishment of Prognostic Models, and Characteristics of Tumor Microenvironment Infiltration in Colon Cancer.Front Genet. 2022 Jun 17;13:919389. doi: 10.3389/fgene.2022.919389. eCollection 2022. Front Genet. 2022. PMID: 35783281 Free PMC article.
-
Establishment of an ovarian cancer omentum metastasis-related prognostic model by integrated analysis of scRNA-seq and bulk RNA-seq.J Ovarian Res. 2022 Nov 23;15(1):123. doi: 10.1186/s13048-022-01059-0. J Ovarian Res. 2022. PMID: 36424614 Free PMC article.
-
Identification of cuproptosis-related subtypes, construction of a prognosis model, and tumor microenvironment landscape in gastric cancer.Front Immunol. 2022 Nov 21;13:1056932. doi: 10.3389/fimmu.2022.1056932. eCollection 2022. Front Immunol. 2022. PMID: 36479114 Free PMC article.
Cited by
-
Advances in application of circulating tumor DNA in ovarian cancer.Funct Integr Genomics. 2023 Jul 21;23(3):250. doi: 10.1007/s10142-023-01181-2. Funct Integr Genomics. 2023. PMID: 37479960 Review.
-
Development of a Starvation Response-Based Model and Its Application in Prognostic Assessment of Liver Hepatocellular Carcinoma.Mediators Inflamm. 2025 Jul 7;2025:8828435. doi: 10.1155/mi/8828435. eCollection 2025. Mediators Inflamm. 2025. PMID: 40662145 Free PMC article.
-
"DEPHENCE" system-a novel regimen of therapy that is urgently needed in the high-grade serous ovarian cancer-a focus on anti-cancer stem cell and anti-tumor microenvironment targeted therapies.Front Oncol. 2023 Jun 28;13:1201497. doi: 10.3389/fonc.2023.1201497. eCollection 2023. Front Oncol. 2023. PMID: 37448521 Free PMC article. Review.
References
-
- Brahimi-Horn MC, Chiche J, Pouysségur J. Hypoxia and cancer. J Mol Med (Berl) 2007;85(12):1301–1307. - PubMed
-
- Bray F, Ferlay J, Soerjomataram I, Siegel RL, Torre LA, Jemal AJ. Global cancer statistics 2018: GLOBOCAN estimates of incidence and mortality worldwide for 36 cancers in 185 countries. CA Cancer J Clin. 2018;68(6):394–424. - PubMed
-
- Caan BJ, Thomson C. Optimizing women's health through nutrition. 2007. 10 Breast and ovarian cancer.
-
- Chan DA, Giaccia AJJC Reviews M (2007) Hypoxia, gene expression, and metastasis. Cancer Metastasis Rev 26(2):333–339. - PubMed
MeSH terms
LinkOut - more resources
Full Text Sources
Medical
Research Materials
Miscellaneous
