

Utility of isolated-check visual evoked potential technique in dysthyroid optic neuropathy
- PMID: 36642765
- PMCID: PMC10271890
- DOI: 10.1007/s00417-023-05975-9
Utility of isolated-check visual evoked potential technique in dysthyroid optic neuropathy
Erratum in
-
Correction to: Utility of isolated‑check visual evoked potential technique in dysthyroid optic neuropathy.Graefes Arch Clin Exp Ophthalmol. 2023 Sep;261(9):2725. doi: 10.1007/s00417-023-05980-y. Graefes Arch Clin Exp Ophthalmol. 2023. PMID: 36705744 Free PMC article. No abstract available.
Abstract
Purpose: To analyze the utility of isolated-check visual evoked potential (icVEP) for discriminating between eyes with dysthyroid optic neuropathy (DON) and eyes with thyroid-associated ophthalmopathy (TAO) but not DON.
Methods: Forty-three eyes with TAO but not DON (as non-DON), fifty-three eyes with DON, and sixty healthy eyes (as controls) were included. Comprehensive ophthalmic examinations, including best-corrected visual acuity, refraction, color vision test, intraocular pressure measurement, slit-lamp biomicroscopy, ophthalmoscopy, RAPD, exophthalmometry measurements, pVEP test, icVEP test, standard automated perimetry, and clinical activity score classification of TAO, as well as demographic information, were collected and analyzed.
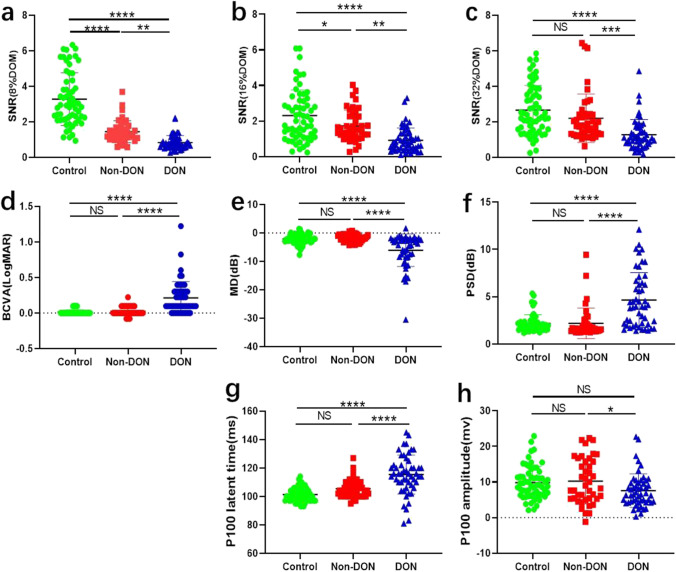
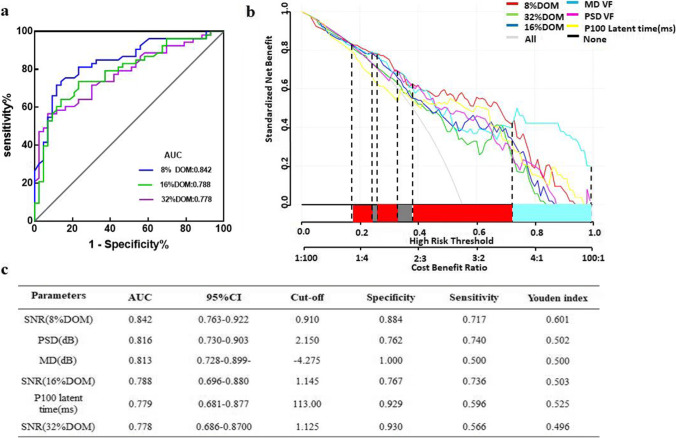
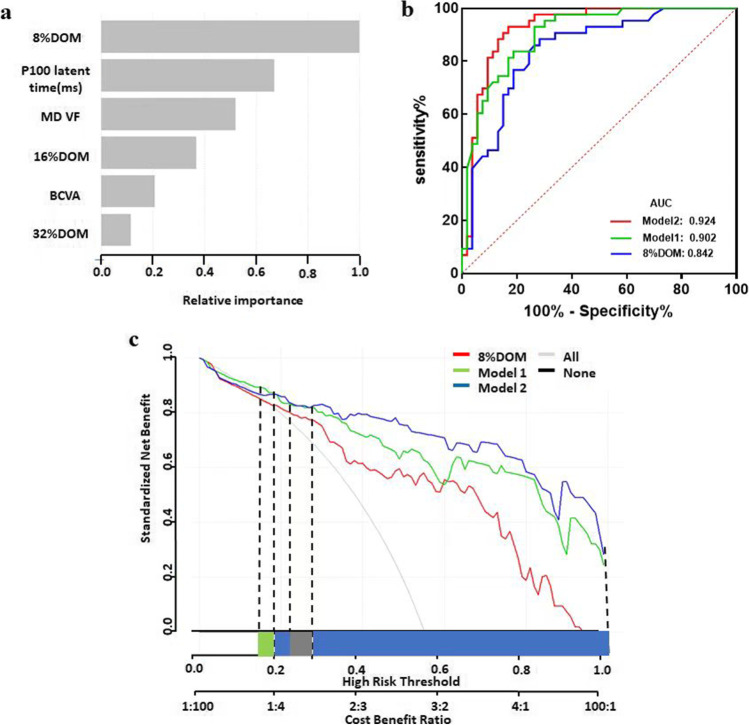
Results: In the DON group, the signal-to-noise ratio (SNR) value of icVEPs decreased significantly compared with that of the non-DON group as well as control (p < 0.05). The SNR values under 8%, 16% and 32% depth of modulation (DOM) were significantly negatively correlated with BCVA (p < 0.05, r = - 0.9 ~ - 0.6), papilledema (Y/N) (p < 0.05, r = - 0.8 ~ 0.4) and DON (Y/N) (p < 0.001, r = - 0.7 ~ - 0.5). The 8% DOM of icVEP had the largest area under the receiver operating characteristic curve (AUC) (0.842) for discriminating DON from non-DONs. Meanwhile, decision curve analysis (DCA) showed that patients clinically benefit most from 8% DOM of icVEP. Furthermore, the 8% DOM of icVEP combing with papilledema (Y/N) and BCVA (Model 1) has significantly larger AUC than the 8% DOM of icVEP (p = 0.0364), and has better clinical benefit in DCA analysis.
Conclusions: The SNR of 8% DOM from icVEP may represent a significant ancillary diagnostic method for DON detection. Furthermore, icVEP combined with papilledema (Y/N) and BCVA should be considered as a diagnostic model in future clinical practice.
Keywords: Diagnosis; Dysthyroid optic neuropathy (DON); Isolated-check visual evoked potential (icVEP); Thyroid-associated ophthalmopathy (TAO).
© 2023. The Author(s), under exclusive licence to Springer-Verlag GmbH Germany, part of Springer Nature.
Conflict of interest statement
The authors declare no competing interests.
Figures
Similar articles
-
Comparing isolated-check visual evoked potential, pattern visual evoked potential, and standard automated perimetry in dysthyroid optic neuropathy eyes.Eye (Lond). 2021 Sep;35(9):2556-2563. doi: 10.1038/s41433-020-01274-3. Epub 2020 Nov 13. Eye (Lond). 2021. PMID: 33188292 Free PMC article.
-
Visual function changes of dysthyroid optic neuropathy and ROC curve analysis for early diagnostic indicators.Zhong Nan Da Xue Xue Bao Yi Xue Ban. 2023 Aug 28;48(8):1197-1202. doi: 10.11817/j.issn.1672-7347.2023.230140. Zhong Nan Da Xue Xue Bao Yi Xue Ban. 2023. PMID: 37875359 Free PMC article. Chinese, English.
-
Application of electrophysiological tests in the evaluation of early thyroid-associated ophthalmopathy.Doc Ophthalmol. 2021 Jun;142(3):343-351. doi: 10.1007/s10633-020-09808-6. Epub 2021 Jan 28. Doc Ophthalmol. 2021. PMID: 33511522
-
Dysthyroid Optic Neuropathy.Ophthalmic Plast Reconstr Surg. 2023 Dec 1;39(6S):S65-S80. doi: 10.1097/IOP.0000000000002555. Epub 2023 Dec 4. Ophthalmic Plast Reconstr Surg. 2023. PMID: 38054987 Review.
-
Electrophysiological Studies in Thyroid Associated Orbitopathy: A Systematic Review.Sci Rep. 2017 Sep 21;7(1):12108. doi: 10.1038/s41598-017-11998-0. Sci Rep. 2017. PMID: 28935968 Free PMC article.
Cited by
-
Diagnostic Capability of Isolated-Check Visual Evoked Potential for Early to Moderate Primary Open-Angle Glaucoma.Life (Basel). 2023 May 25;13(6):1257. doi: 10.3390/life13061257. Life (Basel). 2023. PMID: 37374038 Free PMC article.
-
Diagnostic accuracy of isolated-check visual evoked potentials for glaucoma: a systematic review and meta-analysis.BMC Ophthalmol. 2025 Jul 10;25(1):405. doi: 10.1186/s12886-025-04221-6. BMC Ophthalmol. 2025. PMID: 40640806 Free PMC article.
References
MeSH terms
Grants and funding
LinkOut - more resources
Full Text Sources
