. 2023 Mar;10(7):e2203869.
doi: 10.1002/advs.202203869. Epub 2023 Jan 15.

MCU Upregulation Overactivates Mitophagy by Promoting VDAC1 Dimerization and Ubiquitination in the Hepatotoxicity of Cadmium

Affiliations

MCU Upregulation Overactivates Mitophagy by Promoting VDAC1 Dimerization and Ubiquitination in the Hepatotoxicity of Cadmium

Cong Liu et al. Adv Sci (Weinh). 2023 Mar.

Abstract

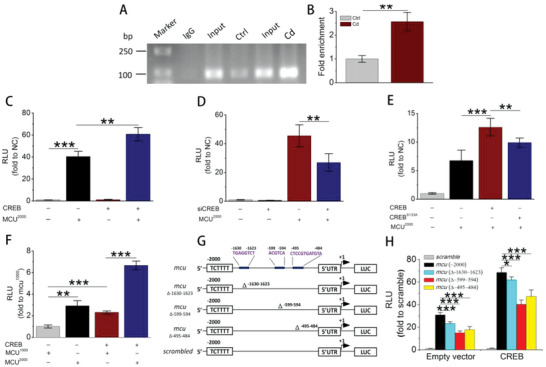
Cadmium (Cd) is a high-risk pathogenic toxin for hepatic diseases. Excessive mitophagy is a hallmark in Cd-induced hepatotoxicity. However, the underlying mechanism remains obscure. Mitochondrial calcium uniporter (MCU) is a key regulator for mitochondrial and cellular homeostasis. Here, Cd exposure upregulated MCU expression and increased mitochondrial Ca2+ uptake are found. MCU inhibition through siRNA or by Ru360 significantly attenuates Cd-induced excessive mitophagy, thereby rescues mitochondrial dysfunction and increases hepatocyte viability. Heterozygous MCU knockout mice exhibit improved liver function, ameliorated pathological damage, less mitochondrial fragmentation, and mitophagy after Cd exposure. Mechanistically, Cd upregulates MCU expression through phosphorylation activation of cAMP-response element binding protein at Ser133(CREBS133 ) and subsequent binding of MCU promoter at the TGAGGTCT, ACGTCA, and CTCCGTGATGTA regions, leading to increased MCU gene transcription. The upregulated MCU intensively interacts with voltage-dependent anion-selective channel protein 1 (VDAC1), enhances its dimerization and ubiquitination, resulting in excessive mitophagy. This study reveals a novel mechanism, through which Cd upregulates MCU to enhance mitophagy and hepatotoxicity.

Keywords: cadmium; hepatotoxicity; mitochondrial calcium uniporter; mitophagy; voltage-dependent anion-selective channel protein 1.


Conflict of interest statement

The authors declare no conflict of interest.

Figures

Figure 1
Figure 1
The effects of Cd exposure on MCU expression and mitochondrial Ca2+ uptake. A) MCU mRNA levels detected by RT‐PCR (n = 5). GAPDH was used as an internal control. B) Immunoblots of MCU in whole cell lysates. C) Quantification data of MCU from (B), n = 3. D) Immunoblots of MCU in mitochondrial lysates. COX IV was selected as the loading control. E) Quantification data of MCU from (D), n = 3. F) Colocalization of MCU and mitochondria analyzed by confocal microscopy. Scale bar: 5 µm. G) Average gray value tested by confocal microscopy. HepG2 cells were transfected with GCaMP6m constructs before Cd exposure to monitor mitochondrial calcium alterations. The GCaMP6m fluorescence was continuously collected at ex 475 and 410 nm simultaneously. Histamine (100 µm) was added into cells as an agonist for mitochondrial calcium. H) The 475/410 ratio calculated from (G). *p < 0.05, **p < 0.01, ***p < 0.001.
Figure 2
Figure 2
The effects of MCU inhibition on Cd‐induced autophagic cell death. A) Immunoblots and B) quantification of LC3 II/I for evaluating the effect of MCU knockdown on autophagy (n = 3). The siMCU was transfected into cells 48 h before Cd exposure. C) Cells were infected with EGFP‐mCherry‐LC3 adenovirus, and the effects of siMCU on autophagic flux were monitored. Representative confocal images were shown. D) Quantification of autophagosomes and autolysosomes (n = 20). E) Cell viability change in cells treated with siMCU and Cd. F–J) The effects of Ru360 (5 µm, 2 h before Cd exposure) on autophagy were further evaluated using methods similar to those of siMCU. *p < 0.05, **p < 0.01, ***p < 0.001.
Figure 3
Figure 3
The effects of siMCU and Ru360 on Cd‐induced mitochondrial dysfunction. A–C) Effects of siMCU on (A) MMP detected by JC‐1, (B) ATP content, and (C) mitochondrial ROS production tested by MitoTracker Red CM‐H2XRos (n = 5). D–F) Effects of Ru360 on (D) MMP, (E) ATP, and (F) mitochondrial ROS by the methods used in (A)–(C), respectively (n = 5). MMP: mitochondrial membrane potential. *p < 0.05, **p < 0.01, ***p < 0.001.
Figure 4
Figure 4
Evaluation of excessive mitophagy and hepatotoxicity in heterogeneous MCU KO mice exposed to Cd. The MCU+/+ and MCU+/− CD1 mice were exposed to saline or Cd for 7 consecutive days and anesthetized for blood or liver yielding (n = 10). A) Immunoblots of MCU in fresh liver lysates. B) Quantification of MCU from (A), n = 3. C) Immunohistochemistry (IHC) staining of MCU in liver tissues. 400× magnification images were taken and 10 fields each group were randomly chosen for analysis. D) Average optical density calculated from (C). E) Immunoblots of LC3 ǁ/ǀ and p62 in fresh liver lysates. F) Quantification of LC3 ǁ/ǀ and G) p62 from (E), n = 3. H) TEM images of liver tissue. Blue asterisks indicate impaired mitochondria, and blue arrows indicate ruptured mitochondrial membranes. Scale bar: 1 µm. I) Total autophagosomes and autolysosomes counted from TEM images (n = 10). J) Percentages of intact and ruptured mitochondria calculated from TEM images. Chi‐square test was used for comparison between groups. K) Serum ALT, L) AST, and M) LDH were detected using a biochemistry analyzer (n = 5–6). N) HE staining of liver tissue. Magnification, 200×. Scale bar: 100 µm. *p < 0.05, **p < 0.01, ***p < 0.001. ns, no significance.
Figure 5
Figure 5
The regulatory effect of CREB on MCU expression. A) Immunoblots and B) quantitative analysis of pCREBS133, T‐CREB, and C) their ratio in cell lysates after 3, 6, and 12 µm Cd exposure (n = 3). D) Representative confocal images of pCREBS133 immunostaining. The nucleus was stained with DAPI (blue). E) Immunoblots and F) quantitative analysis of pCREBS133/T‐CREB ratio, and G) MCU in cell lysates (n = 3). H) Immunoblots and I) quantitative analysis of T‐CREB and MCU for evaluating the effect of CREB on MCU expression (n = 3). J) Immunoblots and K) quantitative analysis of pCREBS133/T‐CREB ratio and L) MCU for evaluating the effect of CREB mutation at Ser133 on MCU expression (n = 3). *p < 0.05, **p < 0.01, ***p < 0.001.
Figure 6
Figure 6
Transcriptional regulation of CREB on MCU. A) Agarose gel electrophoresis for ChIP‐PCR products. HepG2 cells were treated with or without 12 µm Cd for 12 h, and the protein–DNA complex were harvested for ChIP assay. B) Relative enrichment of pCREBS133 on MCU promoter (n = 3). C) Activation of the MCU promoter (MCU2000) with empty vector (basal condition, served as a negative control) or CREB (WT) plasmid transfection (n = 5). The RLU data are expressed as the fold change compared to the negative control (NC). D) RLU values normalized to the NC group after CREB knockdown (n = 5). E) RLU values normalized to the NC group after CREB phosphorylation mutation at Ser133 site (CREBS133A), n = 5. F) Comparison of MCU promoter (MCU1000 and MCU2000) activity under basal conditions or CREB treatment. Data were normalized to the MCU1000 group (n = 5). G) Schematic diagram showing three different mutation sites in the MCU 2000 bp promoter and their relative locations. H) Cells were transfected with empty vector or the indicated plasmids, including three mutated firefly luciferase reporter gene plasmids as stated in (G) and CREB (WT). The RLU values were obtained and normalized to scramble (n = 5). From (C) to (H), the dual luciferase reporter assay was performed on HEK293T cells with four types of plasmid transfection, including the firefly luciferase plasmids (MCU1000, MCU2000, and its mutations), the transcription factor (CREB and CREBS133A), the Renilla luciferase plasmids and the corresponding empty vectors. *p < 0.05, **p < 0.01, ***p < 0.001.
Figure 7
Figure 7
Upregulated MCU promoted VDAC1 dimerization through their physical interaction. A) Confocal images indicating mitochondrial colocalization between MCU and VDAC1 tagged with HA. B,C) Immunoblots for coimmunoprecipitation of MCU and HA‐VDAC1 in cell lysates without Cd exposure. (B) HA‐VDAC1 or (C) MCU primary antibody was used to pull down proteins binding to VDAC1 or MCU in cells treated with siMCU or siVDAC1, respectively. D) Immunoblots for coimmunoprecipitation of MCU, HA‐VDAC1, and DRP1 in cell lysates after Cd exposure. HA‐VDAC1 primary antibody was utilized to pull down proteins binding to VDAC1 in cells exposed to Cd or not exposed. E) FRET assay verified the interaction between MCU and VDAC1. The VDAC1‐ECFP and MCU‐EYFP plasmids were constructed and transfected into HepG2 cells, and the FRET was performed by photobleaching the EYFP (acceptor) on mitochondria of living HepG2 cells. The middle panel and the bottom panel indicated the FRET after total bleaching and partial bleaching of EYFP, respectively. An increased fluorescence of ECFP (donor) was observed after bleaching. F) Quantification of FRET efficiency after total bleaching (n = 5). The value was normalized to ECFP+MCU‐EYFP. G) RNA‐seq of VDAC1 in cells treated with or without 12 µm Cd for 12 h (n = 4). H,I) The effect of VBIT4 (H) or siMCU (I) on VDAC1 dimerization. Tubulin served as the loading control in these assays. **p < 0.01. ns, no significance.
Figure 8
Figure 8
Inhibition of VDAC1 attenuated autophagic cell death caused by Cd. A) Immunoblots of LC3 ǁ/ǀ from lysates pretreated with VBIT4 for 48 h and then exposed to 12 µm Cd for 12 h. B) Quantification of LC3 ǁ/ǀ from (A), n = 3. C) Alternation of autophagic flux after VBIT4 treatment. Cells were treated as previously described. Scale bar: 5 µm. D) Quantification of autophagosomes and autolysomes (n = 20). E) Cell viability after VBIT4 treatment (n = 5). *p < 0.05, **p < 0.01, ***p < 0.001.
Figure 9
Figure 9
Mitophagy was inhibited by reducing VDAC1 ubiquitination through MCU downregulation. A) Immunoblots showing total ubiquitination in Cd (12 µm, 12 h)‐ or CCCP (10 µm, 12 h)‐treated cells. B) Immunoblots of total ubiquitination after 3, 6, and 12 µm Cd exposure for 12 h. C,D) Effects of VBIT4 (C) or siMCU (D) on the ubiquitination of total protein or VDAC1. Immunoprecipitation was performed using HA primary antibody to pull down HA‐VDAC1 with or without ubiquitin modifications. E–G) Confocal images indicating mitochondrial translocation of Parkin and PINK1 in cells pretreated with siVDAC1 (E), VBIT4 (F), and siMCU (G) before Cd exposure. Representative images are shown. The Parkin and PINK1 primary antibodies were mixed and incubated together before probing with two different secondary fluorescent antibodies. Scale bar: 5 µm. H,I) Representative confocal images indicating mitophagy after VBIT4 (H) or siMCU (I) treatment. Mitophagy dye was utilized to monitor the occurrence of mitophagy as described previously.

References

    1. a) Flannery B. M., Schaefer H. R., Middleton K. B., Regul. Toxicol. Pharmacol. 2022, 131, 105155; - PubMed
    2. b) Satarug S., Baker J. R., Urbenjapol S., Haswell‐Elkins M., Reilly P. E., Williams D. J., Moore M. R., Toxicol. Lett. 2003, 137, 65; - PubMed
    3. c) Genchi G., Sinicropi M. S., Lauria G., Carocci A., Catalano A., Int. J. Environ. Res. Public Health 2020, 17, 3782. - PubMed
    1. a) Hong D., Min J. Y., Min K. B., J. Prev. Med. Public Health 2021, 54, 471; - PMC - PubMed
    2. b) Park E., Kim J., Kim B., Park E. Y., Chemosphere 2021, 266, 128947; - PubMed
    3. c) Han S., Sung G. H., Lee S., Han K. J., Han H. J., Medicine 2022, 101, 28559; - PubMed
    4. d) Li Y., Chen C., Lu L., Guo W., VanWagner L. B., Shikany J. M., Zhang S., Kahe K., Dig. Dis. Sci. 2022, 67, 689; - PMC - PubMed
    5. e) Satarug S., Curr. Drug Metab. 2012, 13, 257; - PubMed
    6. f) Hyder O., Chung M., Cosgrove D., Herman J. M., Li Z., Firoozmand A., Gurakar A., Koteish A., Pawlik T. M., J. Gastrointest. Surg. 2013, 17, 1265. - PMC - PubMed
    1. a) Men H., Young J. L., Zhou W., Zhang H., Wang X., Xu J., Lin Q., Tan Y., Zheng Y., Cai L., Oxid. Med. Cell. Longevity 2021, 2021, 1427787; - PMC - PubMed
    2. b) Li X., Li H., Cai D., Li P., Jin J., Jiang X., Li Z., Tian L., Chen G., Sun J., Bai W., Food Chem. Toxicol. 2021, 148, 111944; - PubMed
    3. c) Alshammari G. M., Al‐Qahtani W. H., AlFaris N. A., Alzahrani N. S., Alkhateeb M. A., Yahya M. A., BioFactors 2021, 47, 489. - PubMed
    1. a) Lee W. K., Thévenod F., Arch. Toxicol. 2020, 94, 1017; - PubMed
    2. b) Pi H., Xu S., Reiter R. J., Guo P., Zhang L., Li Y., Li M., Cao Z., Tian L., Xie J., Zhang R., He M., Lu Y., Liu C., Duan W., Yu Z., Zhou Z., Autophagy 2015, 11, 1037. - PMC - PubMed
    1. a) Xu S., Pi H., Chen Y., Zhang N., Guo P., Lu Y., He M., Xie J., Zhong M., Zhang Y., Yu Z., Zhou Z., Cell Death Dis. 2013, 4, 540; - PMC - PubMed
    2. b) Pi H., Xu S., Zhang L., Guo P., Li Y., Xie J., Tian L., He M., Lu Y., Li M., Zhang Y., Zhong M., Xiang Y., Deng L., Zhou Z., Yu Z., Autophagy 2013, 9, 1780. - PubMed

Publication types