Evaluating Natural Gas Emissions from Pneumatic Controllers from Upstream Oil and Gas Facilities in West Virginia
- PMID: 36643185
- PMCID: PMC9835970
- DOI: 10.1016/j.aeaoa.2022.100199
Evaluating Natural Gas Emissions from Pneumatic Controllers from Upstream Oil and Gas Facilities in West Virginia
Abstract
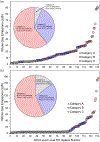
In April of 2018, an optical gas imaging (OGI) and full flow sampler (FFS) emissions measurement study of pneumatic controllers (PCs) was conducted at 15 oil and natural gas production sites in West Virginia. The objective of the study was to identify and characterize PC systems with excessive emissions caused by maintenance issues or nonoptimized process conditions. A total of 391 PC systems were found on the sites and all were classified by the operator as snap-acting (on/off) intermittent venting PCs (IPCs) that should exhibit little gas release while the PC is closed between actuation events. The population was comprised of two groups, 259 infrequently actuating, lower emitting (LE) IPCs and 132 gas processing unit (GPU) liquid level IPCs and associated dump valve actuators that vent more frequently and have larger emission volumes. Using a PC-specific OGI inspection protocol with an assumed whole gas OGI detection threshold of 2.0 scfh, only 2 out of 259 LE-IPCs exhibited OGI detectable emissions indicating good inspection and maintenance practices for this category. Due to combined (ganged) GPU exhaust vents, the OGI inspection of the GPU liquid level IPCs was comparatively less informative and determination of single component IPC emissions by the FFS was more difficult. The time resolved FFS measurements of GPU IPCs defined three categories of operation: one that indicated proper function and two associated with higher emissions that may result from an IPC maintenance or process issues. The overall GPU IPC emission distribution was heavy tailed, with a median value of 12.8 scfh, similar to the 13.5 scfh whole gas IPC emission factor (EF). Total emissions were dominated by non-optimal temporal profile high-emitter IPC cases with the top 20% of IPC systems accounting for between 51.3% and 70.7% of GPU liquid level IPC emissions by volume. The uncertainty in the estimate was due to the ganged nature of the GPU exhaust vents. The highest GPU IPC emission came from a single malfunctioning unit with a measured whole gas value of 157 scfh. Up to six IPCs exceeded 100 scfh. An analysis of FFS emission measurements compared to liquids production per IPC unit employed indicated that production sites operating at a high level of liquids production test the limits of the site engineering, likely resulting in higher IPC emissions. Overall, this study found that the LE-IPCs with OGI-verified low closed bleed rates may emit well below the IPC EF while GPU liquid level IPC systems are likely well represented by the current IPC EF. IPCs that are experiencing a maintenance or process issue or that are operating at sites with a very high product throughput per IPC employed can emit at rates exceeding ten times IPC EF.
Keywords: Greenhouse Gases; Methane Emissions; Oil and Natural Gas Production; Pneumatic Controller Emissions; Volatile Organic Compounds.
Figures


Similar articles
-
Methane emissions from oil and gas production sites and their storage tanks in West Virginia.Atmos Environ X. 2022 Dec;16:1-11. doi: 10.1016/j.aeaoa.2022.100193. Atmos Environ X. 2022. PMID: 37091901 Free PMC article.
-
Understanding oil and gas pneumatic controllers in the Denver-Julesburg basin using optical gas imaging.J Air Waste Manag Assoc. 2020 Apr;70(4):468-480. doi: 10.1080/10962247.2020.1735576. Epub 2020 Mar 13. J Air Waste Manag Assoc. 2020. PMID: 32101088 Free PMC article.
-
Assessment of Uinta Basin Oil and Natural Gas Well Pad Pneumatic Controller Emissions.J Environ Prot (Irvine, Calif). 2017 Apr;8(4):394-415. doi: 10.4236/jep.2017.84029. J Environ Prot (Irvine, Calif). 2017. PMID: 30319880 Free PMC article.
-
The Minderoo-Monaco Commission on Plastics and Human Health.Ann Glob Health. 2023 Mar 21;89(1):23. doi: 10.5334/aogh.4056. eCollection 2023. Ann Glob Health. 2023. PMID: 36969097 Free PMC article. Review.
-
Folic acid supplementation and malaria susceptibility and severity among people taking antifolate antimalarial drugs in endemic areas.Cochrane Database Syst Rev. 2022 Feb 1;2(2022):CD014217. doi: 10.1002/14651858.CD014217. Cochrane Database Syst Rev. 2022. PMID: 36321557 Free PMC article.
Cited by
-
Quantification of natural gas and other hydrocarbons from production sites in northern West Virginia using tracer flux ratio methodology.Atmos Environ X. 2023 Aug 1;19:1-8. doi: 10.1016/j.aeaoa.2023.100220. Atmos Environ X. 2023. PMID: 37538994 Free PMC article.
-
Methane emissions from oil and gas production sites and their storage tanks in West Virginia.Atmos Environ X. 2022 Dec;16:1-11. doi: 10.1016/j.aeaoa.2022.100193. Atmos Environ X. 2022. PMID: 37091901 Free PMC article.
-
Developing Specific Emission Factors for Natural Gas Driven Pneumatic Devices.Environ Sci Technol. 2024 Oct 22;58(42):18663-18670. doi: 10.1021/acs.est.4c05637. Epub 2024 Oct 10. Environ Sci Technol. 2024. PMID: 39434656 Free PMC article.
References
-
- Allen DT; Pacsi AP; Sullivan DW; Zavala-Araiza D; Harrison M; Keen K; Fraser MP; Daniel Hill A; Sawyer RF; Seinfeld JH, Methane emissions from process equipment at natural gas production sites in the United States: Pneumatic controllers. Environmental Science & Technology 2015, 49 (1), 633–640. - PubMed
-
- Bari MA; Kindzierski WB, Ambient volatile organic compounds (VOCs) in Calgary, Alberta: sources and screening health risk assessment. Science of the Total Environment 2018, 631, 627–640. - PubMed
-
- Brantley HL; Thoma ED; Eisele AP, Assessment of volatile organic compound and hazardous air pollutant emissions from oil and natural gas well pads using mobile remote and on-site direct measurements. Journal of the Air & Waste Management Association 2015, 65 (9), 1072–1082. - PubMed
-
- Colorado Department of Public Health & Environment, Approved Instrument Monitoring Method (AIMM) for oil & gas, https://cdphe.colorado.gov/oil-and-gas-and-your-health/approved-instrume..., accessed November 11, 2022. 2022.
Grants and funding
LinkOut - more resources
Full Text Sources
Miscellaneous
