. 2022 Dec 14;2(12):100217.
doi: 10.1016/j.xgen.2022.100217. Epub 2022 Nov 15.

Genome-scale CRISPR screening in a single mouse liver

Affiliations

Genome-scale CRISPR screening in a single mouse liver

Heather R Keys et al. Cell Genom. .

Abstract

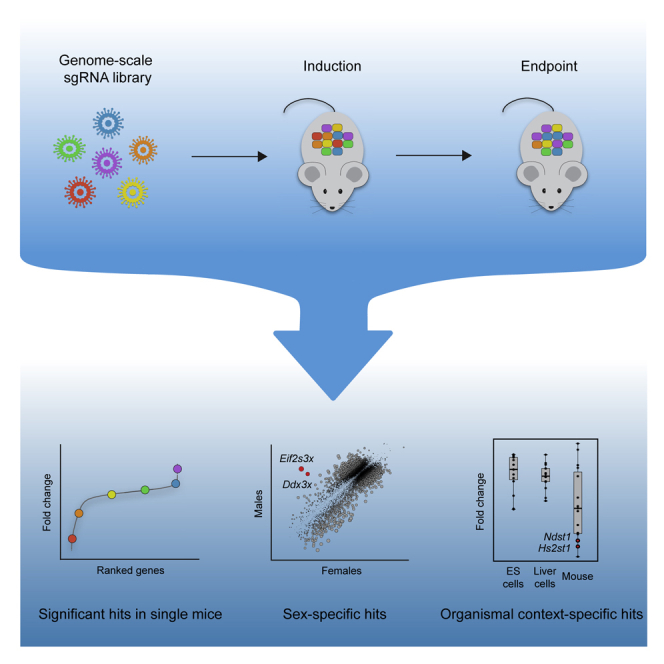
A complete understanding of the genetic determinants underlying mammalian physiology and disease is limited by the capacity for high-throughput genetic dissection in the living organism. Genome-wide CRISPR screening is a powerful method for uncovering the genetic regulation of cellular processes, but the need to stably deliver single guide RNAs to millions of cells has largely restricted its implementation to ex vivo systems. There thus remains a need for accessible high-throughput functional genomics in vivo. Here, we establish genome-wide screening in the liver of a single mouse and use this approach to uncover regulation of hepatocyte fitness. We uncover pathways not identified in cell culture screens, underscoring the power of genetic dissection in the organism. The approach we developed is accessible, scalable, and adaptable to diverse phenotypes and applications. We have hereby established a foundation for high-throughput functional genomics in a living mammal, enabling comprehensive investigation of physiology and disease.


Conflict of interest statement

DECLARATION OF INTERESTS H.R.K. and K.A.K. are co-inventors on a patent filed by the Whitehead Institute related to work in this manuscript.

Figures

None
Graphical abstract
Figure 1
Figure 1
Genome-scale sgRNA delivery in a single mouse liver (A) Lentiviral vectors for U6-driven expression of an sgRNA and hepatocyte-specific expression of a fluorescent reporter (mCherry or mTurq2). (B) Images of endogenous mCherry and mTurq2 fluorescence in livers from mice 4 days after injection with an equal mixture of sgAAVS1-mCherry and sgAAVS1-mTurq2 lentiviruses. Livers were counterstained with phalloidin (green) to label actin. Scale bars, 100 μm. (C) Percentage of mCherry-, mTurq2-, and double-positive hepatocytes in livers from mice 4 days after injection with an equal mixture of sgAAVS1-mCherry and sgAAVS1-mTurq2 lentiviruses. Error bars indicate standard deviation. n = 3 mice per dose and 200 hepatocytes per mouse. See also Figure S1.
Figure 2
Figure 2
Temporally controlled protein depletion in the mouse liver (A) Scheme for inducing protein depletion in LSL-Cas9 mice. (B) Images of livers from LSL-Cas9 mice injected with sgMaob-mCherry followed by PBS or AAV-Cre immunostained for mCherry (magenta), MAO-B (green), and actin (blue). Scale bars, 45 μm. (C) Cytoplasmic MAO-B intensity per μm in mCherry-positive and mCherry-negative hepatocytes from LSL-Cas9 mice injected with sgMaob-mCherry followed by PBS or AAV-Cre. Closed and open circles represent values from male and female mice, respectively. n = 1 male and 1 female mouse per condition and 25 cells per mouse. See also Figure S2.
Figure 3
Figure 3
A genome-scale screen for hepatocyte fitness in the neonatal mouse liver (A) Number of protein-coding genes expressed in the liver as determined by RNA sequencing of livers at various time points. (B) Scheme for performing a genome-scale screen for hepatocyte fitness in neonatal mice. (C) Representation of sgRNAs in livers 4 days after injection with lentiviral library relative to the sgRNA representation in the plasmid library expressed as reads per million (RPM). n = 2 male and 2 female mice pooled into a single sequencing library. Pearson correlation r = 0.97. (D) Pairwise comparisons of median fold change (log2) for each gene for each mouse at the endpoint of the screen. (E) Genes ranked by median fold change across mice (log2) with significantly depleted genes denoted by red points and significantly enriched genes denoted by blue points (FDR < 0.05 by two-tailed Wilcoxon test). Core essential genes (red bars) are positioned below based on gene rank to demonstrate their significant depletion across mice. p < 2.2 × 10−16 by one-sided Kolmogorov-Smirnov test. (F) Genes ranked by median fold change (log2) in each of the four mice. Highlighted are control gene sets consisting of tumor-suppressor genes in hepatocellular carcinoma (expected to enrich, blue) and genes required for hepatocyte viability (expected to deplete, red). Core essential genes (red bars) are positioned below based on gene rank to demonstrate their significant depletion in each mouse. Expected gene depletion p = 1 × 10−5, 1.6 × 10−4, 1.4 × 10−4, and 1 × 10−5 for male 1, female 1, male 2, and female 2, respectively, by one-sided Kolmogorov-Smirnov test, and expected gene enrichment p = 0.0032, 0.0052, 0.0053, and 0.0039 for male 1, female 1, male 2, and female 2, respectively, by one-sided Kolmogorov-Smirnov test. Core essential gene depletion p < 2.2 × 10−16 for each mouse by one-sided Kolmogorov-Smirnov test. (G) Benjamini-Hochberg-adjusted Wilcoxon p-value (−log10) versus the median fold change across mice (log2) for each gene in the screen. Highlighted are control gene sets consisting of tumor-suppressor genes in hepatocellular carcinoma (expected to enrich, blue) and genes required for hepatocyte viability (expected to deplete, red). Expected depleted p = 3.5 × 10−6 by one-sided Kolmogorov-Smirnov test, and expected enriched p = 4.7 × 10−4 by one-sided Kolmogorov-Smirnov test. See also Figure S3.
Figure 4
Figure 4
Genome-scale screening in the organism enhances discovery of tumor-suppressor genes and uncovers genes with sex-specific effects (A) Cumulative fraction of tumor suppressor genes (cyan, blue) and other genes (black, gray) based on quantile-normalized median fold change (log2) of their gene scores across screens in mouse embryonic stem cells (ESCs) and our screen. ESCs p > 0.05 by one-sided Kolmogorov-Smirnov test, and our screen p = 6.5 × 10−3 by one-sided Kolmogorov-Smirnov test. (B) Median fold change (log2) across males versus median fold change (log2) across females for each gene. Highlighted are genes uniquely enriched in females (blue), genes uniquely enriched in males (cyan), genes uniquely depleted in females (red), and genes uniquely depleted in males (pink). Point size is proportional to the absolute difference in median log2 fold change between females and males. See also Figure S4.
Figure 5
Figure 5
Class I MHC and heparan sulfate biosynthesis are uniquely required for hepatocyte fitness in the organism (A) KEGG gene sets exhibiting significant depletion (FDR q < 0.05) at the endpoint of the screen ranked by FDR q-value (−log10). Bars extending to the end of the plot indicate an FDR q-value of 0. (B) KEGG gene sets exhibiting significant depletion (FDR q < 0.05) in our screen relative to screens in either mouse ESCs (dark gray bars) or human hepatocellular carcinoma (HCC) cell lines (light gray bars) ranked by FDR q-value (−log10) for our screen relative to mouse ESCs. Bars extending to the end of the plot indicate an FDR q-value of 0. (C) Median fold change (log2) for genes in the KEGG gene set for antigen processing and presentation in quantile-normalized ESC screens, HCC cell line screens, and our screen. Genes uniquely depleted in our screen are highlighted in red. The bounds of the box indicate the first and third quartiles, and the whiskers extend to the furthest data point that is within 1.5 times the interquartile range. (D) Median fold change (log2) for genes in the KEGG gene set for glycosaminoglycan biosynthesis and heparan sulfate in quantile-normalized ESC screens, HCC cell line screens, and our screen. Genes uniquely depleted in our screen are highlighted in red. The bounds of the box indicate the first and third quartiles, and the whiskers extend to the furthest data point that is within 1.5 times the interquartile range. (E) Median fold change (log2) for genes in the heparan sulfate interactome in our screen. The bounds of the box indicate the first and third quartiles, and the whiskers extend to the furthest data point that is within 1.5 times the interquartile range. (F) Scheme for determining effects of NDST1 knockdown on hepatocyte proliferation (top panel). Image of liver from postnatal day 15 mouse injected with 1 × 1010 genome copies (GC) of AAV-shNDST1 and AAV-shScramble on postnatal day 5 immunostained for Ki67 (white), GFP (green), and mCherry (magenta) and counterstained for Hoechst (blue) (left panel). Scale bar, 25 μm. Quantification of proliferation as inferred by Ki67 positivity in shNDST1 hepatocytes relative to shScramble hepatocytes (right panel). Bar and whiskers indicate mean and standard deviation across mice, respectively, and closed and open circles represent values from male and female mice, respectively. n = 2 male and 2 female mice and 200 cells per shRNA per mouse. ∗∗p = 0.0023 by two-tailed Fisher’s exact test. See also Figure S5.

References

    1. Shalem O., Sanjana N.E., Hartenian E., Shi X., Scott D.A., Mikkelson T., Heckl D., Ebert B.L., Root D.E., Doench J.G., et al. Genome-scale CRISPR-Cas9 knockout screening in human cells. Science. 2014;343:84–87. doi: 10.1126/science.1247005. - DOI - PMC - PubMed
    1. Wang T., Wei J.J., Sabatini D.M., Lander E.S. Genetic screens in human cells using the CRISPR-Cas9 system. Science. 2014;343:80–84. doi: 10.1126/science.1246981. - DOI - PMC - PubMed
    1. Beronja S., Janki P., Heller E., Lien W.-H., Keyes B.E., Oshimori N., Fuchs E. RNAi screens in mice identify physiological regulators of oncogenic growth. Nature. 2013;501:185–190. doi: 10.1038/nature12464. - DOI - PMC - PubMed
    1. Wertz M.H., Mitchem M.R., Pineda S.S., Hachigian L.J., Lee H., Lau V., Powers A., Kulicke R., Madan G.K., Colic M., et al. Genome-wide in vivo CNS screening identifies genes that modify CNS neuronal survival and mHTT toxicity. Neuron. 2020;106:76–89.e8. doi: 10.1016/j.neuron.2020.01.004. - DOI - PMC - PubMed
    1. Chen S., Sanjana N.E., Zheng K., Shalem O., Lee K., Shi X., Scott D.A., Song J., Pan J.Q., Weissleder R., et al. Genome-wide CRISPR screen in a mouse model of tumor growth and metastasis. Cell. 2015;160:1246–1260. doi: 10.1016/j.cell.2015.02.038. - DOI - PMC - PubMed