. 2023 Jan 11;7(1):016104.
doi: 10.1063/5.0123127. eCollection 2023 Mar.

Opto-electromechanical quantification of epithelial barrier function in injured and healthy airway tissues

Affiliations

Opto-electromechanical quantification of epithelial barrier function in injured and healthy airway tissues

Jiawen Chen et al. APL Bioeng. .

Abstract

The airway epithelium lining the luminal surface of the respiratory tract creates a protective barrier that ensures maintenance of tissue homeostasis and prevention of respiratory diseases. The airway epithelium, unfortunately, is frequently injured by inhaled toxic materials, trauma, or medical procedures. Substantial or repeated airway epithelial injury can lead to dysregulated intrinsic repair pathways and aberrant tissue remodeling that can lead to dysfunctional airway epithelium. While disruption in the epithelial integrity is directly linked to degraded epithelial barrier function, the correlation between the structure and function of the airway epithelium remains elusive. In this study, we quantified the impact of acutely induced airway epithelium injury on disruption of the epithelial barrier functions. By monitoring alternation of the flow motions and tissue bioimpedance at local injury site, degradation of the epithelial functions, including mucociliary clearance and tight/adherens junction formation, were accurately determined with a high spatiotemporal resolution. Computational models that can simulate and predict the disruption of the mucociliary flow and airway tissue bioimpedance have been generated to assist interpretation of the experimental results. Collectively, findings of this study advance our knowledge of the structure-function relationships of the airway epithelium that can promote development of efficient and accurate diagnosis of airway tissue injury.


Conflict of interest statement

The authors have no conflicts to disclose.

Figures

FIG. 1.
FIG. 1.
Airway epithelial barrier established by polarized, coordinated arrangement of airway epithelium. Schematics of (a) unidirectional mucociliary flow generated by cilia beating and (b) polarized arrangement of airway epithelium along the proximal and distal axis via planar cell polarity (PCP) signal pathway. Fzd: frizzled, Dvl: dishevelled, Vangl: Van Gogh-like, Pk: Prickle. (c) Schematic of epithelial barrier disruption caused by airway tissue injury.
FIG. 2.
FIG. 2.
Induction of localized acute physical injury to rat trachea epithelium ex vivo. (a) Rat trachea whole-mount stained for tight junction protein Zonula occludens-1 (ZO-1), acetylated α tubulin to label cilia, and PCP protein Vang-like1 (Vangl-1). (b) Scanning electronic microscopy (SEM) image showing the luminal surface of the rat trachea. (c) Experimental setup used to generate the airway tissue injury. Localized epithelial injury was induced by gently compressing the tissue with the tip of a thin metal probe (diameter: 500 μm). Fluorescence and SEM images of (d) native and (e) injured lumen of rat tracheal tissues. Ciliated cells were labeled with WGA (wheat germ agglutinin; green), while the injured tissue was visualized by EB (Evans blue; red). Injury site is indicated with an yellow dotted line.
FIG. 3.
FIG. 3.
Quantification of the speed and direction of cilia-generated flow in native and injured airway via microparticle tracking. (a) Schematic of mucociliary (MCC) flow and microparticle movement along the proximal–distal axis of isolated rat trachea. MPs (microparticles). (b) and (c) Fluorescent images of injured tracheal luminal surface and trajectories of microparticles traveling on the injured epithelial surface. EB (Evans blue). (d) and (e) Fluorescent images of native tracheal luminal surface and trajectories of microparticles placed on the intact surface. WGA (wheat germ agglutinin). (f) Microparticle traveling speeds determined by monitoring the trajectories of the particles at injured and native tissue regions, respectively. ***p <0.001. (g) Travel distance and (h) average traveling speeds of microparticles measured as the particles moved across the injury site. Polar histograms showing the angular direction of the moving microparticles on (i) the injured and (j) native airway lumen. (k) Mean angular direction and index of orientation of the microparticles calculated through the particle trajectory analysis. **p <0.01 and ***p <0.001.
FIG. 4.
FIG. 4.
Computer simulation of mucociliary flow near the injury site. (a) Schematic of the three-dimensional (3D) geometry of the mucociliary flow simulated using COMSOL software. (b) Boundary conditions and values applied at different surfaces of the computational model. (c) Simulation results showing the flow speed and velocity vectors near a circular injury site. Computer simulated speed of the flow measured along (d) a–a′ and (e) b–b′ lines that are indicated in (c). (f) Pressure distribution within the flow at the injury site indicated with a black circle and (g) magnitude of the pressure inside the flow calculated along a–a′.
FIG. 5.
FIG. 5.
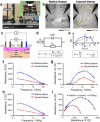
Bioimpedance measured in injured and intact rat trachea airway tissues. (a) The experimental setup used to measure bioimpedance of the airway tissue. (b) Bright field images show the luminal surfaces of native and injured trachea tissues. Dotted line indicates the injured tissue region. CC1 and CC2: current carrying electrode 1 and 2, PU1 and PU2: voltage pickup electrodes 1 and 2. (c) Schematic of the cross-sectional view of the rat trachea with four-probe bioimpedance measurement system. I: Current source, V: voltage meter, EP: epithelium, ECM: extracellular matrix. (d) An equivalent electrical circuit of the rat trachea, known as the Cole model. R1 and R2: resistor 1 and 2, CPE: constant phase element, Z: impedance, R0: resistance at zero frequency, R: resistance at infinite frequency, α: an empirical exponent (range: 0 and 1), τ: characteristic time constant, R1 = R0, R2 = R0–R. (e) Cole–Cole plot that graphically shows different parameters. fc: Frequency corresponding to the maximum reactance. (f) Resistance (R), (g) reactance (XC), and (h) impedance (Z) of both native and injured trachea tissues measured with different alternating current (AC) frequency values (range: 250 Hz–135 kHz). (i) Complex impedance plot of native and injured tracheas. The solid lines represent the best fit to the measured data for the extraction of Cole parameters.
FIG. 6.
FIG. 6.
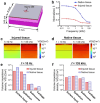
Computer simulation of bioimpedance of injured and native airway tissues. (a) 3D computer model of injured trachea used for the computer simulation. (b) Simulated values of normalized impedance ( Z^) of native and injured trachea with respect to AC frequency. Simulated volume impedance density (VID) profile of (c) injured and (d) native trachea tissue layer with AC frequency of 10 Hz and 135 kHz. VID values determined via the simulations at (e) 10 Hz and (f) 135 kHz.
FIG. 7.
FIG. 7.
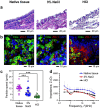
Opto-electromechanical quantification of inhalation-induced airway epithelium injury. (a) Microscopic analysis of native and injured trachea tissues via H&E staining. Injury was induced by inhalation of either 3% NaCl or HCl with pH 1.5. (b) Immunofluorescence staining of the tissues with ZO-1 (red), acetylated α tubulin to label cilia (green) and nuclei (blue). (c) Traveling speeds of traced microparticles measured from native and injured tissues. (d) Impedance (Z) measured from native and injured trachea tissues with the AC frequency range between 250 Hz and 135 kHz. ***p < 0.001.

Similar articles

Cited by

References

    1. Knowles M. R. and Boucher R. C., J. Clin. Invest. 109(5), 571 (2002).10.1172/JCI0215217 - DOI - PMC - PubMed
    1. Pohl C., Hermanns M. I., Uboldi C., Bock M., Fuchs S., Dei-Anang J., Mayer E., Kehe K., Kummer W., and Kirkpatrick C. J., Eur. J. Pharm. Biopharm. 72(2), 339 (2009).10.1016/j.ejpb.2008.07.012 - DOI - PubMed
    1. Bals R. and Hiemstra P. S., Eur. Respir. J. 23(2), 327 (2004).10.1183/09031936.03.00098803 - DOI - PubMed
    1. Kilburn K. H., Am. Rev. Respir. Dis. 98(3), 449 (1968).10.1164/arrd.1968.98.3.449 - DOI - PubMed
    1. Tilley A. E., Walters M. S., Shaykhiev R., and Crystal R. G., Annu. Rev. Physiol. 77, 379 (2015).10.1146/annurev-physiol-021014-071931 - DOI - PMC - PubMed