. 2023 Jan 4:2023:9990843.
doi: 10.1155/2023/9990843. eCollection 2023.

Effects of a Macroporous Resin Extract of Dendrobium officinale Leaves in Rats with Hyperuricemia Induced by Anthropomorphic Unhealthy Lifestyle

Affiliations

Effects of a Macroporous Resin Extract of Dendrobium officinale Leaves in Rats with Hyperuricemia Induced by Anthropomorphic Unhealthy Lifestyle

Lin-Zi Li et al. Evid Based Complement Alternat Med. .

Abstract

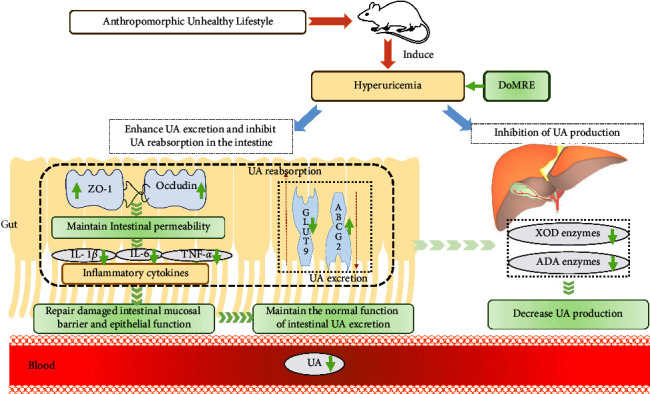
Aim: Hyperuricemia (HUA) has received increased attention in the last few decades due to its global prevalence. Our previous study found that administration of a macroporous resin extract of Dendrobium officinale leaves (DoMRE) to rats with HUA that was induced by exposure to potassium oxazine combined with fructose and a high-purine diet led to a significant reduction in serum uric acid (SUA) levels. The aim of this study was to explore the effects of DoMRE on hyperuricemia induced by anthropomorphic unhealthy lifestyle and to elucidate its possible mechanisms of action.

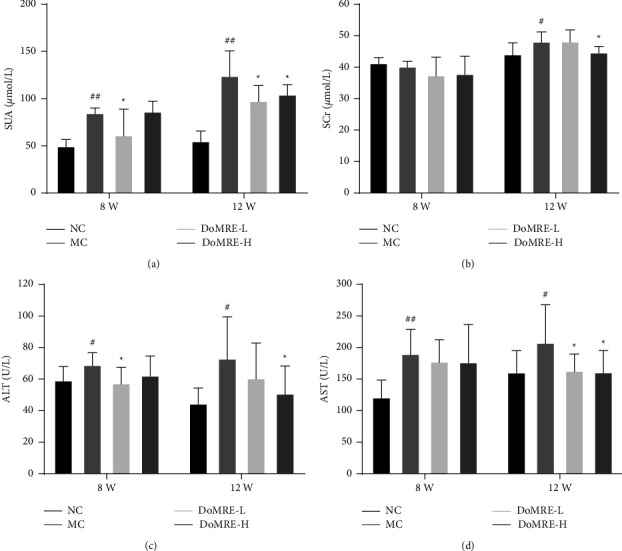
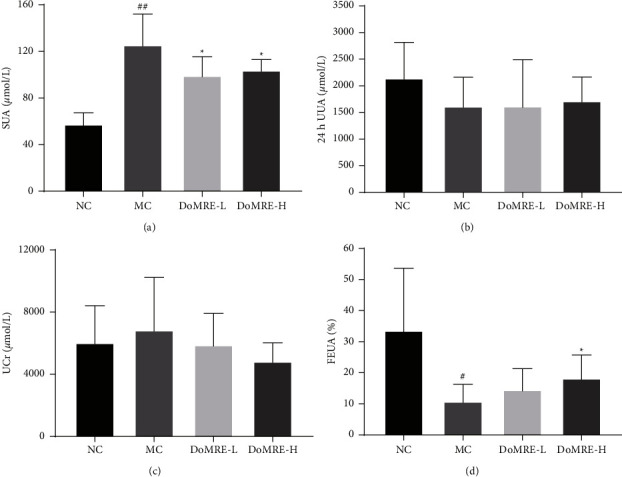
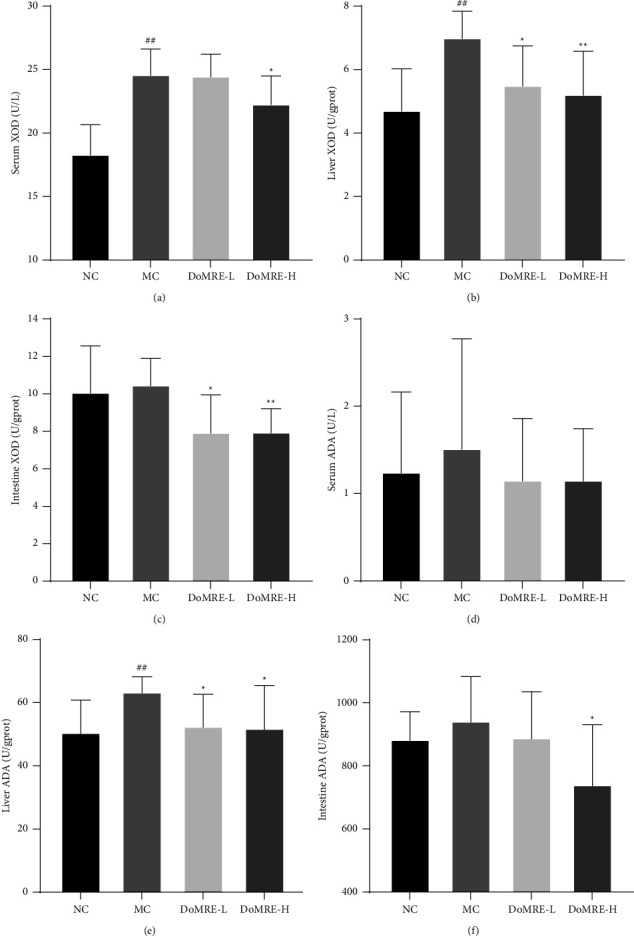
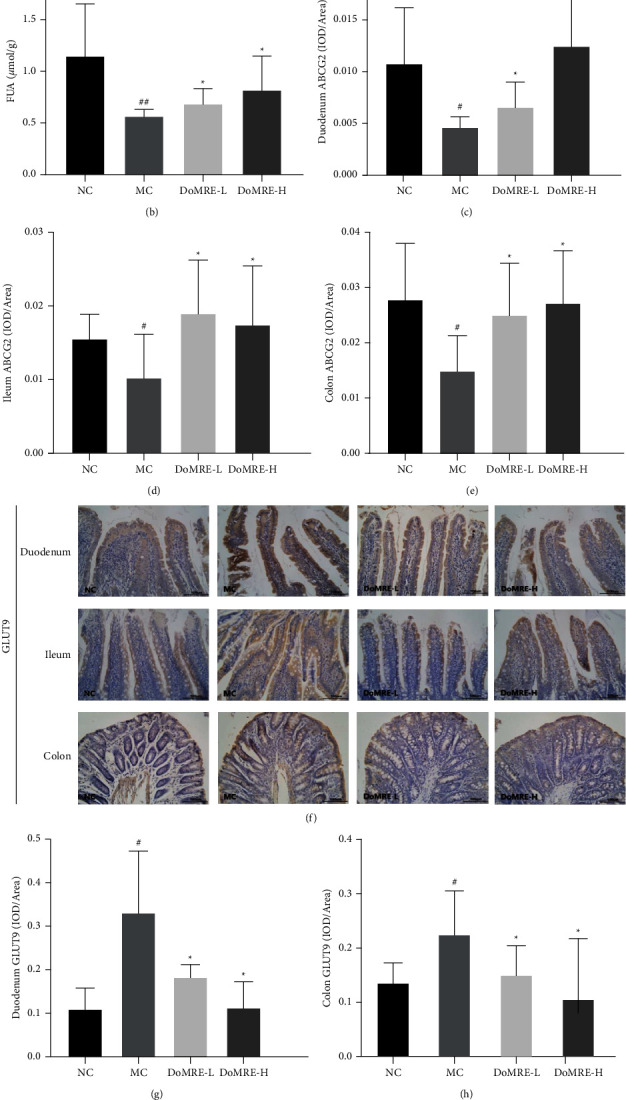
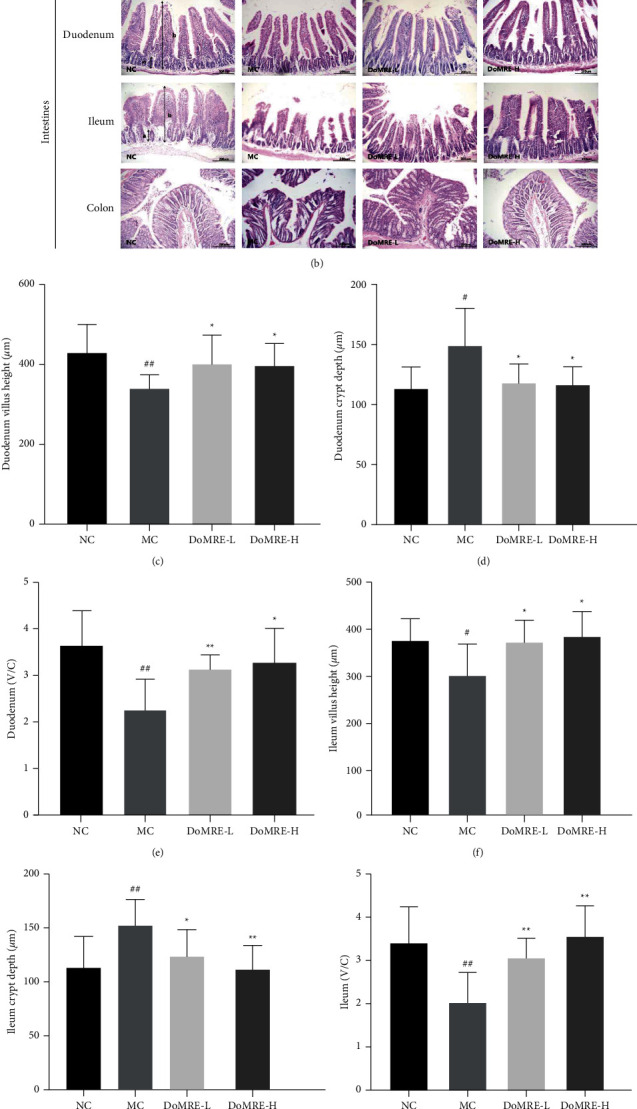
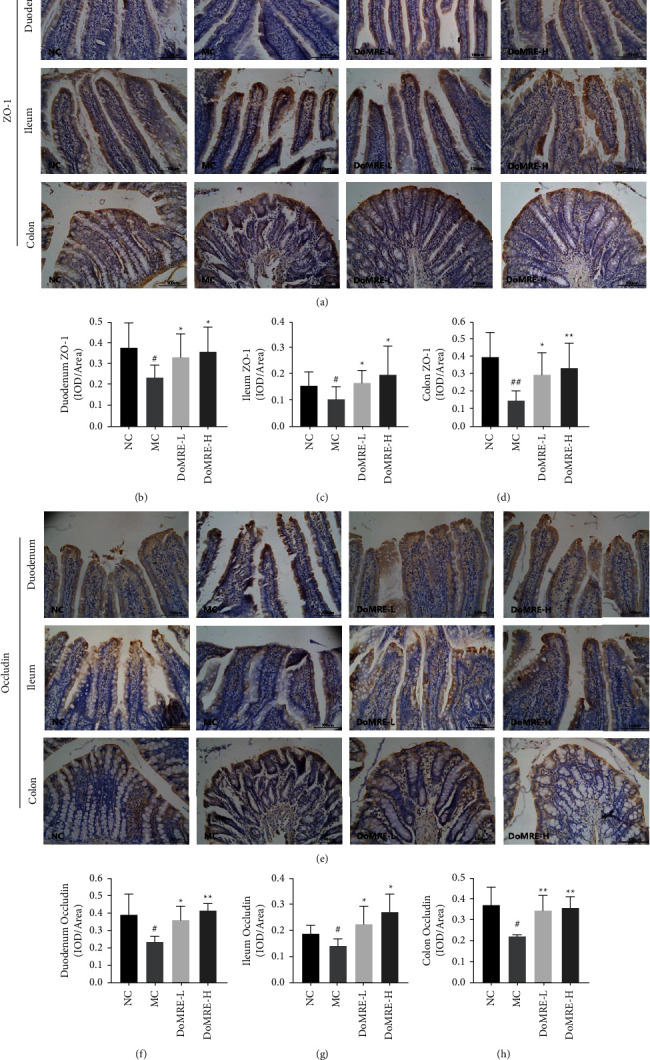
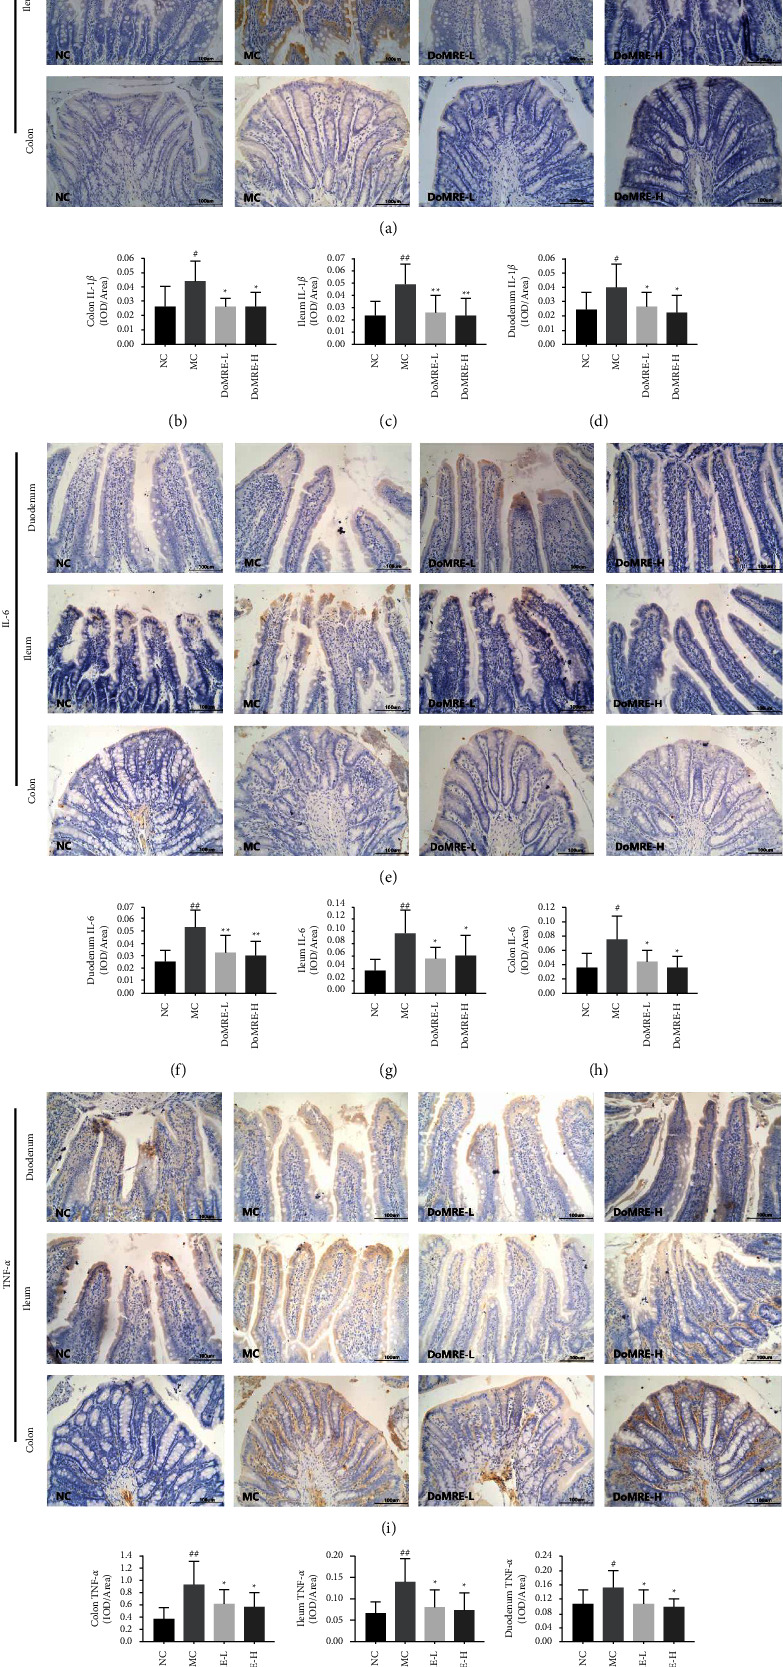
Methods: Dosages (5.0 and 10.0 g/kg/day) of DoMRE were administered to rats daily after induction of HUA by anthropomorphic unhealthy lifestyle for 12 weeks. The levels of UA in the serum, urine, and feces; the levels of creatinine (Cr) in the serum and urine; and the levels of aspartate aminotransferase (AST) and alanine aminotransferase (ALT) in serum were all measured using an automatic biochemical analyzer. The activities of xanthine oxidase (XOD) and adenosine deaminase (ADA) in the serum, liver, and intestine tissue supernatant were measured using appropriate kits for each biological target. The expressions levels of UA transporters (ABCG2 and GLUT9), tight junction (TJ) proteins (ZO-1 and occludin), and inflammatory factors (IL-6, IL-8, and TNF-α) in the intestine were assayed by immunohistochemical (IHC) staining. Hematoxylin and eosin (H&E) staining was used to assess histological changes in the renal and intestinal tissues.

Results: DoMRE treatment significantly reduced SUA levels and concomitantly increased fecal UA (FUA) levels and the fractional excretion of UA (FEUA) in HUA rats. Furthermore, DoMRE significantly reduced both the XOD activity in the serum, liver, and intestine and the ADA activity in the liver and intestine. DoMRE also effectively regulated the expression of GLUT9 and ABCG2 in the intestine, and it significantly upregulated the expression of the intestinal TJ proteins ZO-1 and occludin. Therefore, DoMRE reduced the damage to the intestinal barrier function caused by the increased production of inflammatory factors due to HUA to ensure normal intestinal UA excretion.

Conclusion: DoMRE demonstrated anti-HUA effects in the HUA rat model induced by an anthropomorphic unhealthy lifestyle, and the molecular mechanism appeared to involve the regulation of urate transport-related transporters (ABCG2 and GLUT9) in the intestine, protection of the intestinal barrier function to promote UA excretion, and inhibition of XOD and ADA activity in the liver and intestine to inhibit UA production in the HUA-induced rats.


Conflict of interest statement

The authors declare that they have no conflicts of interest.

Figures

Figure 1
Figure 1
Effect of DoMRE on SUA and SCr levels. (a) SUA levels after 8 and 12-week oral administration. (b) SCr levels after 8 and 12-week administration. (c) ALT levels after 8 and 12-week administration. (d) AST levels after 8 and 12-week administration. NC, normal control group; MC, model control group; DoMRE-L, low dose of DoMRE group; DoMRE-H, high dose of DoMRE group. The data were expressed as mean ± SD of 8 rats in each group. #P < 0.05; ##P < 0.01, compared with NC group; P < 0.05; ∗∗P < 0.01, compared with MC group.
Figure 2
Figure 2
Effect of DoMRE on UV, 24 h UUA, UCr and FEUA levels and renal urate transporters protein levels. (a) SUA levels. (b) 24 h UUA levels. (c) UCr levels. (d) FEUA levels. NC, normal control group; MC, model control group; DoMRE-L, low dose of DoMRE group; DoMRE-H, high dose of DoMRE group. The data were expressed as mean ± SD of 8 rats in each group. #P < 0.05; ##P < 0.01, compared with NC group; P < 0.05; ∗∗P < 0.01, compared with MC group.
Figure 3
Figure 3
Effect of DoMRE on XOD and ADA activity. (a) The XOD activity in the serum after 12-week oral administration. (b) The XOD activity in the liver after 12-week oral administration. (c) The XOD activity in the small intestine after 12-week oral administration. (d) The ADA activity in the serum after 12-week oral administration. (e) The ADA activity in the liver after 12-week oral administration. (f) The ADA activity in the small intestine after 12-week oral administration. NC, normal control group; MC, model control group; DoMRE-L, low dose of DoMRE group; DoMRE-H, high dose of DoMRE group. The data were expressed as mean ± SD of 8 rats in each group. #P < 0.05; ##P < 0.01, compared with NC group; P < 0.05; ∗∗P < 0.01, compared with MC group.
Figure 4
Figure 4
Effect of DoMRE on FUA levels and intestinal urate transporters ABCG2 and GLUT9 protein levels. (a) Intestinal ABCG2 IHC pictures (×400). (b) FUA levels. (c) Duodenum ABCG2 OD value. (d) Ileum ABCG2 OD value. (e) Colon ABCG2 OD value. (f) Intestinal GLUT9 IHC pictures (×400). (g) Duodenum GLUT9 OD value. (h) Colon GLUT9 OD value. (i) Ileum GLUT9 OD value. Semiquantitative analysis of ABCG2 and GLUT9 protein expressions in duodenum ileum, and colon were presented as IOD/Area. NC, normal control group; MC, model control group; DoMRE-L, low dose of DoMRE group; DoMRE-H, high dose of DoMRE group. The data were expressed as mean ± SD of 8 rats in each group. #P < 0.05; ##P < 0.01, compared with NC group; P < 0.05; ∗∗P < 0.01, compared with MC group.
Figure 5
Figure 5
Effect of DoMRE on histopathological changes in the renal and intestine. (a) Renal tissues were stained with H&E at a magnification of 200x: (A) glomerulus significantly atrophy; (B) glomerular rupture; (C) the renal tubules swollen and deformed. (b) The duodenum, ileum, and colon were stained with H&E staining to observe crypt (A) and villus (B) at 200x. (c–h) The villus height (V), crypt depth (C), and V/C ratio in duodenum and ileum. IOD: integrated optical density; NC: normal control group; MC: model control group; DoMRE-L: low dose of DoMRE group; DoMRE-H: high dose of DoMRE group. The data were expressed as mean ± SD of 8 rats in each group. #P < 0.05; ##P < 0.01, compared with NC group; P < 0.05; ∗∗P < 0.01, compared with MC group.
Figure 6
Figure 6
DoMRE restore the TJ proteins levels to protects the intestinal barrier function. (a) Intestinal ZO-1 IHC pictures (×400). (b) Duodenum ZO-1 OD value. (c) Ileum ZO-1 OD value. (d) Colon ZO-1 OD value. (e) Intestinal occludin IHC pictures (×400). (f) Duodenum occludin OD value. (g) Ileum occludin OD value. (h) Colon occludin OD value. Semiquantitative analysis of ZO-1 and occludin protein expressions in duodenum ileum, and colon were presented as IOD/area. NC, normal control group; MC, model control group; DoMRE-L, low dose of DoMRE group; DoMRE-H, high dose of DoMRE group. The data were expressed as mean ± SD of 8 rats in each group. #P < 0.05; ##P < 0.01, compared with NC group; P < 0.05; ∗∗P < 0.01, compared with MC group.
Figure 7
Figure 7
Effects of DoMRE on the inflammatory factors TNF-α, IL-6, and IL-1β of colonic mucosa in HUA rats. (a) Intestinal IL-1β IHC pictures (×400). (b) Colon IL-16 OD value. (c) Ileum IL-1β OD value. (d) Duodenum IL-16 OD value. (e) Intestinal IL-6 IHC pictures (×400). (f) Duodenum IL-6 OD value. (g) Ileum IL-6 OD value. (h) Colon IL-6 OD value. (i) Intestinal TNF-α IHC pictures (×400). (j) Colon TNF-5 OD value. (k) Ileum TNF-α OD value. (l) Duodenum TNF-5 OD value. Semiquantitative analysis of TNF-α, IL-6 and IL-1β protein expressions in duodenum ileum, and colon were presented as IOD/area. NC, normal control group; MC, model control group; DoMRE-L, low dose of DoMRE group; DoMRE-H, high dose of DoMRE group. The data were expressed as mean ± SD of 8 rats in each group. #P < 0.05; ##P < 0.01, compared with NC group; P < 0.05; ∗∗P < 0.01, compared with MC group.
Figure 8
Figure 8
The mechanism of DoMRE against hyperuricemia. The yellow arrow represents hyperuricemia, whereas the green arrow represents DoMRE. On the one hand, DoMRE significantly upregulates the expressions of intestinal ZO-1 and occludin proteins, and reduce the intestinal barrier function damage caused by inflammatory factors, which cause the villus height significantly increased of intestinal tissue and a significant decrease in crypt depth of ileum, all of which lead to the improvement of the intestinal barrier function and the assurance of the normal function of intestinal UA excretion. Besides, the DoMRE treatment upregulate the expression of ABCG2 and downregulate the expression of GLUT9 to promote the intestinal UA excretion and purine intaking, ultimately reducing the SUA level. Besides, the DoMRE treatment upregulate the expressions of intestinal ZO-1 and claudin-1 proteins, to improve the intestinal barrier function, so as to ensure the normal function of intestinal UA excretion. Meanwhile, DoMRE can also inhibit XOD and ADA activity in intestine and liver to a certain extent, which ultimately lead to the reduction of the SUA level.

References

    1. Bardin T., Richette P. Definition of hyperuricemia and gouty conditions. Current Opinion in Rheumatology . 2014;26(2):186–191. doi: 10.1097/bor.0000000000000028. - DOI - PubMed
    1. Billiet L., Doaty S., Katz J. D., Velasquez M. T. Review of hyperuricemia as new marker for metabolic syndrome. ISRN Rheumatology . 2014;2014:1–7. doi: 10.1155/2014/852954.852954 - DOI - PMC - PubMed
    1. Shan R., Ning Y., Ma Y., et al. Incidence and risk factors of hyperuricemia among 2.5 million Chinese adults during the years 2017-2018. International Journal of Environmental Research and Public Health . 2021;18(5):p. 2360. doi: 10.3390/ijerph18052360. - DOI - PMC - PubMed
    1. de Oliveira E. P., Burini R. C. High plasma uric acid concentration: causes and consequences. Diabetology & Metabolic Syndrome . 2012;4(1):p. 12. doi: 10.1186/1758-5996-4-12. - DOI - PMC - PubMed
    1. Narang R. K., Vincent Z., Phipps-Green A., Stamp L. K., Merriman T. R., Dalbeth N. Population-specific factors associated with fractional excretion of uric acid. Arthritis Research and Therapy . 2019;21(1):p. 234. doi: 10.1186/s13075-019-2016-6. - DOI - PMC - PubMed