

Retromer oligomerization drives SNX-BAR coat assembly and membrane constriction
- PMID: 36644906
- PMCID: PMC9841331
- DOI: 10.15252/embj.2022112287
Retromer oligomerization drives SNX-BAR coat assembly and membrane constriction
Abstract
Proteins exit from endosomes through tubular carriers coated by retromer, a complex that impacts cellular signaling, lysosomal biogenesis and numerous diseases. The coat must overcome membrane tension to form tubules. We explored the dynamics and driving force of this process by reconstituting coat formation with yeast retromer and the BAR-domain sorting nexins Vps5 and Vps17 on oriented synthetic lipid tubules. This coat oligomerizes bidirectionally, forming a static tubular structure that does not exchange subunits. High concentrations of sorting nexins alone constrict membrane tubes to an invariant radius of 19 nm. At lower concentrations, oligomers of retromer must bind and interconnect the sorting nexins to drive constriction. Constricting less curved membranes into tubes, which requires more energy, coincides with an increased surface density of retromer on the sorting nexin layer. Retromer-mediated crosslinking of sorting nexins at variable densities may thus tune the energy that the coat can generate to deform the membrane. In line with this, genetic ablation of retromer oligomerization impairs endosomal protein exit in yeast and human cells.
Keywords: endosomes; lysosomes; membrane traffic; retromer; yeast.
© 2022 The Authors. Published under the terms of the CC BY NC ND 4.0 license.
Figures
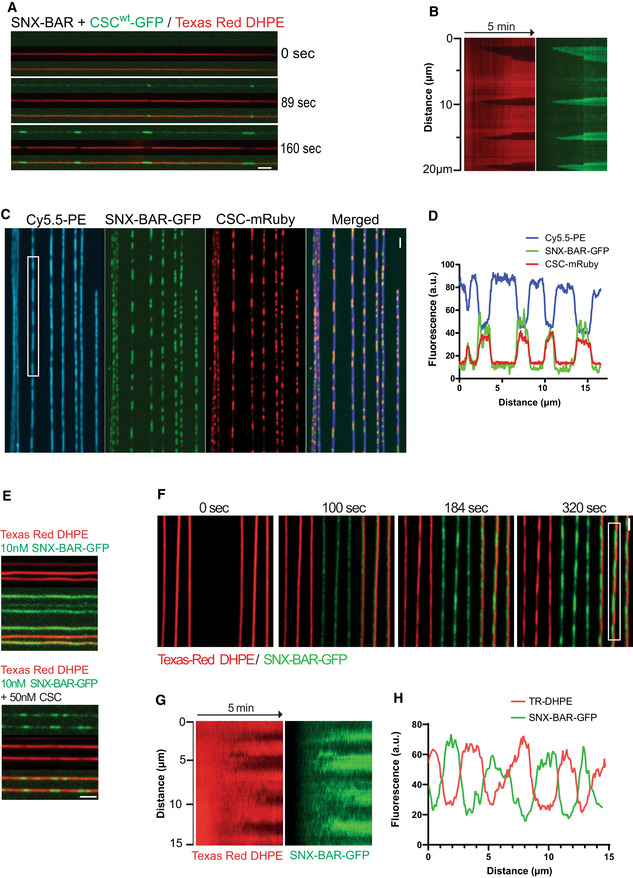
Dynamics of scaffold formation. 25 nM SNX‐BARs and 25 nM retromermClover in PBS were added to SMTs and imaged by confocal microscopy at a frame rate of 1 Hz for 5 min. Scale bar: 2 μm.
Kymograph of the tubule shown in (A). See Movie EV1.
SNXGFP colocalizes with retromermRuby on SMTs. SMTs containing 1 mol % of the fluorescent lipid Cy5.5‐PE were incubated with 25 nM of SNXGFP and retromermRuby for 2 min. Then, the tubes were imaged by confocal microscopy. Scale bar: 2 μm.
Line scan analysis along the boxed tubule from (C).
Scaffold formation at low SNX‐BARs concentration is facilitated by retromer. SMTs were incubated as in (A), using 10 nM SNX‐BARGFP complex in combination with either 50 nM retromer or only control buffer. Scale bar: 2 μm.
Scaffold formation by elevated concentrations of SNX‐BARs alone. 100 nM SNX‐BARs‐GFP was added to SMTs and imaged by confocal microscopy at a rate of 0.5 Hz for 5 min. Scale bar: 2 μm.
Kymograph of the tubule highlighted in (F).
Line scan analysis of the tubule highlighted in (F). This experiment is also shown in Movie EV2.
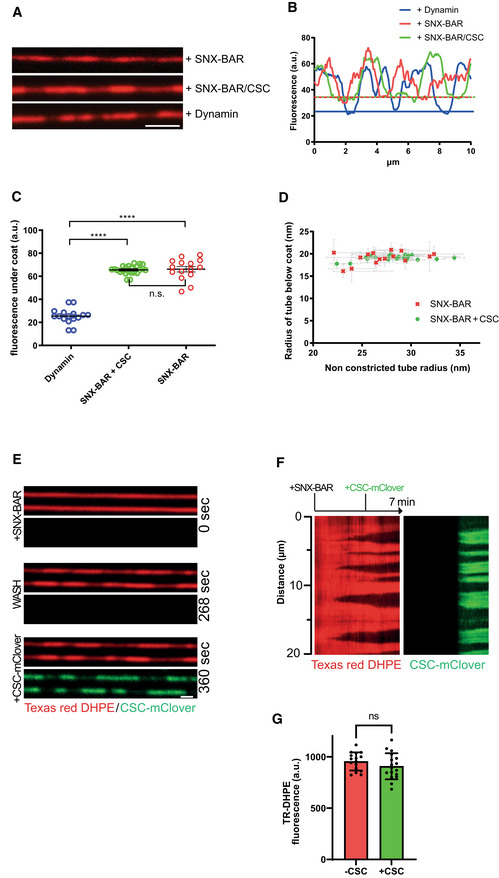
SMTs labeled with Texas‐Red DHPE were incubated with non‐tagged proteins at 25°C for 3–5 min and analyzed by fluorescence microscopy. Proteins were used at the following concentrations: 100 nM SNX‐BARs; 25 nM SNX‐BARs/25 nM retromer; 50 nM dynamin. Scale bar: 2 μm.
Line scan analysis along the tubules from (A). The lower boundaries of fluorescence are indicated by horizontal lines in the respective colors.
Distribution of Texas‐Red DHPE fluorescence in constricted domains for tubules coated by SNX‐BARs (n = 16), SNX‐BARs plus retromer (n = 18), or dynamin (n = 15). Error bars represent the standard deviation from the mean. P‐values were calculated by Welch's t‐test. ****P < 0.0001.
Constricted domain radius as a function of starting (non‐constricted) tube radius. Radii of constricted and non‐constricted regions of a variety of lipid tubes were determined using the known diameter of a dynamin‐coated tube as a reference. Experiments were performed as in (A), using 25 nM SNXs (n = 16) or 25 nM SNX‐BARs plus 25 nM retromer (n = 18). Error bars represent the standard error from the mean.
Binding of retromermClover to constricted SNX‐BARs domains. SMTs were first incubated with 100 nM SNX‐BARs for 2 min at 25°C until constriction zones were visible through reduced lipid fluorescence. Then, 50 nM retromermClover was added under continuous acquisition at 0.5 Hz. Scale bar: 2 μm.
Kymograph of a tubule from (E).
Quantification of Texas‐Red‐DHPE fluorescence under the constriction zones before and after retromermClover addition (n = 16 tubes). Error bars represent the standard error from the mean. P‐values were calculated by Welch's t‐test. n.s.: not significant (P = 0.235).
Scheme of the experiment.
Representative tube of the experiment performed as described in (A). Tubes were imaged by confocal microscopy at a framerate of 0.5 Hz. Scale bar: 2 μm.
Kymograph of the tubule shown in (B). Arrowheads show the origin of coat polymerization.
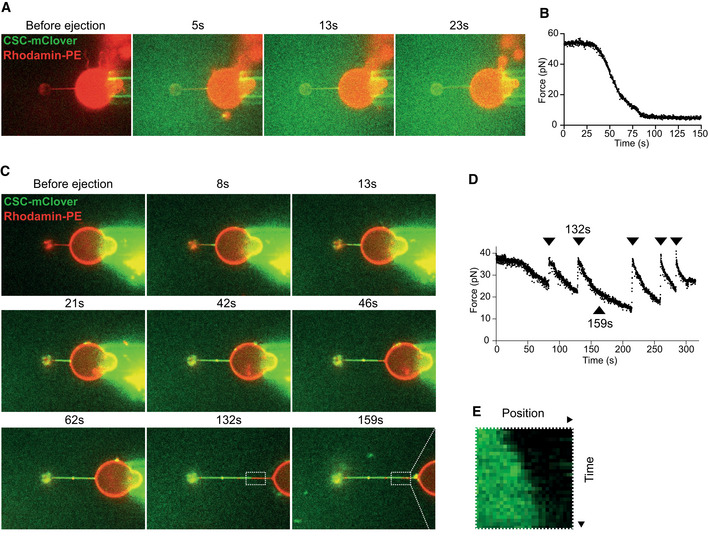
Coat formation on a pulled membrane tubule. Confocal pictures of a GUV labeled with Rhodamine‐DHPE (red). A membrane tubule has been pulled from the GUV through a small bead and optical tweezers. The GUV is shown before and at several time points after ejection of SNX‐BARs/retromermClover (green) from a pipette in the vicinity of the GUV. The images shown are representative of a total of five tubes analyzed, which all showed similar behavior.
Measurement of the force exerted on the bead as a function of time after protein ejection, taken from the experiment shown in (A).
Repetitive pulling and stabilization. Confocal pictures of a GUV labeled with Rhodamine‐DHPE (red). A tubule has been pulled as in (A) and SNX‐BARs/retromermClover (green) was added. The GUV is shown before and after protein ejection, and at several stages of subsequent re‐pulling and stabilization through additional coat recruitment. Protein quickly populates new tube regions generated by pulling back the GUV. The images are representative of a total of five tubes analyzed.
Measurement of the force exerted on the bead as a function of time for the experiment shown in (C). Arrowheads mark the timepoints when the GUV has been pulled back.
Kymograph of the portion of the tubule boxed in (D), showing growth of retromer coat into a newly pulled portion of the tubule.
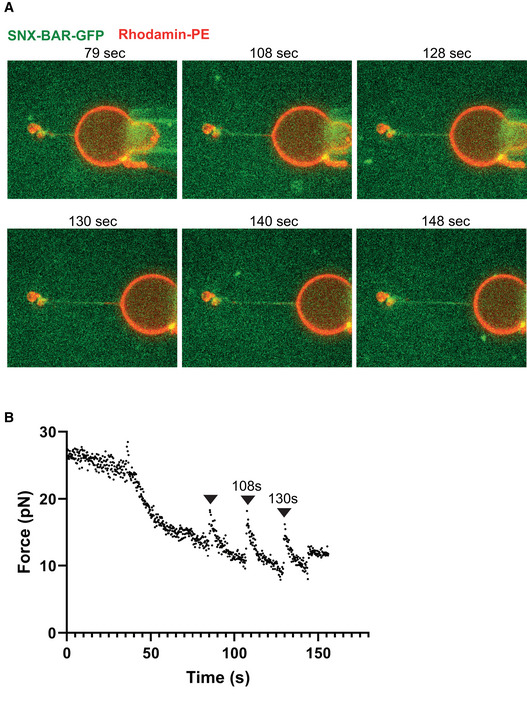
Repetitive pulling and stabilization. Confocal pictures of a GUV labeled with Rhodamine‐DHPE (red). A tubule has been pulled as in (A) and SNX‐BAR‐GFP (green) was added. The GUV is shown at several stages of subsequent re‐pulling and stabilization through additional coat recruitment. Protein quickly populates new tube regions generated by pulling back the GUV. The images show a representative experiment. Equivalent behavior was observed with another, independently prepared tube.
Measurement of the force exerted on the bead as a function of time for the experiment shown in (A). Arrowheads mark the timepoints when the GUV has been pulled back.
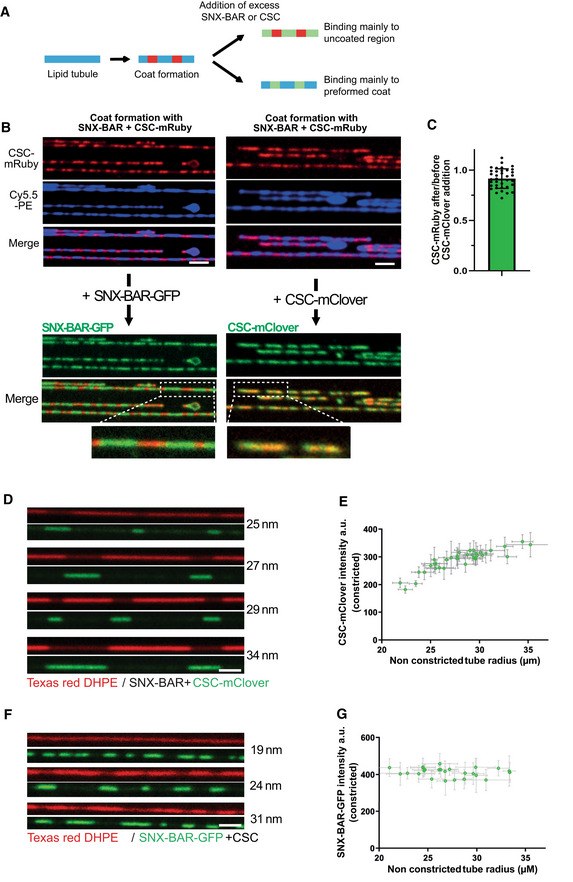
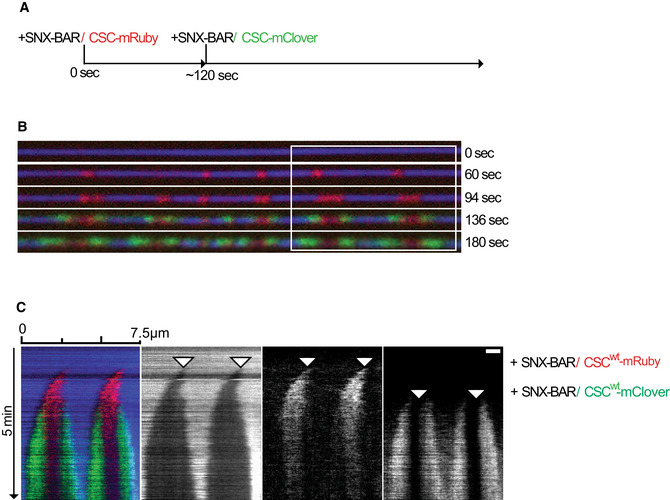
Recruitment of additional subunits to pre‐formed coats using differentially labeled retromer and SNX‐BARs. Scheme of the experiment shown in (B) and (C).
Coats were formed on SMTs using 25 nM SNX‐BARs and 25 nm retromermRuby. Excess protein was washed out with buffer, and 50 nM SNXGFP or 50 nM retromermClover was added. SMTs were imaged after SNX‐BARs/retromermRuby coat formation and 2 min after addition of retromermClover or SNXGFP. Scale bar: 2 μm. A magnification showing constriction zones for each panel is shown.
Ratio of retromermRuby signals in the constricted areas before and after addition of retromermClover. Quantification of the experiment in (B). 36 coats from 10 different tubes were analyzed. Means and SEM are shown.
Occupation of SNX‐BARs domains with retromer as a function of the starting radius of the tube (naked tube radius). Arrays of SMTs were incubated with 25 nM SNX‐BARs and 25 nM retromermClover. The density of retromermClover in constricted domains was traced through its fluorescence signal. The starting radius of the tube was estimated through Texas Red‐DHPE fluorescence in non‐constricted regions and calibration with dynamin. This radius is indicated for each tube. Scale bar: 2 μm.
The density of retromermClover in SNX‐BARs/retromermClover coats from (D) was plotted as a function of the radius of the non‐constricted tube. 36 tubes were analyzed. Error bars represent the standard error of the mean.
Experiment as in (D) using 25 nM SNXGFP and 25 nM retromer.
The fluorescence signals of SNXGFP in SNX‐BARs/retromer coats from (F) were quantified plotted as a function of the radius of the non‐constricted tube as in (E). 26 tubes were analyzed. Error bars represent the standard error of the mean.
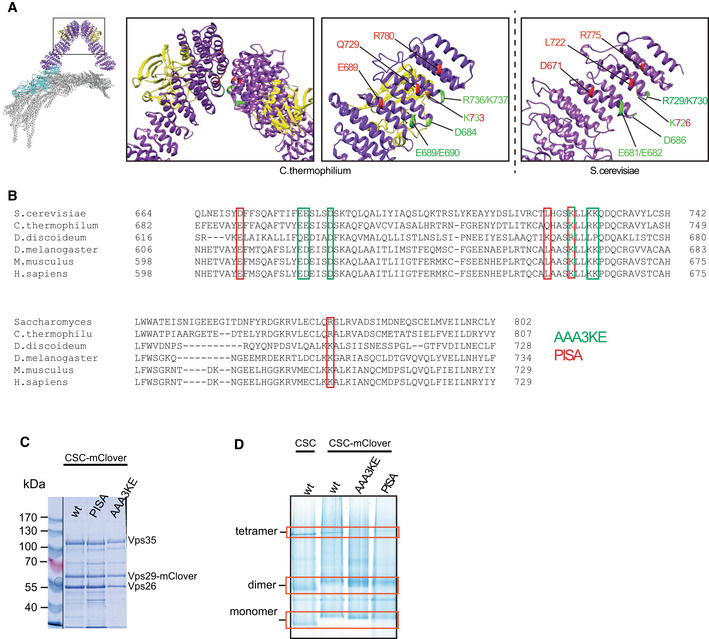
Structure of the pentameric retromer complex (Kovtun et al, ; Leneva et al, 2021). The boxes highlight the Vps35 dimerization interface. Residues substituted in vps35 PISA and vps35 AAA3KE are shown red and green, respectively, in the structure from (C). thermophilum and in a model of the Saccharomyces cerevisiae complex derived from the Chaetomium thermophilum structure (PDB 7BLR) using the online modeling tool Swiss‐model (
https://swissmodel.expasy.org ).Sequence alignment of the Vps35 dimerization domains from different species. Amino acids substituted in vps35 PISA and vps35 AAA3KE are shown in red and green, respectively. One residue (in red‐green) is shared between the two.
Coomassie‐stained SDS–PAGE gel of purified retromermClover complexes containing the indicated Vps35 variants.
Blue native PAGE gel showing the formation of higher‐order assemblies for retromermClover complexes containing Vps35 variants and their tentative assignment as monomers, dimers and tetramers. The samples loaded stem from the same protein preparation as in (C). The bands for monomer, dimers and tetramer (red boxes) are linked to retromer because they show altered migration upon addition of the mClover tag (monomer and dimer), or are destabilized by the PISA and AAA3KE substitutions (tetramer). See also Appendix Fig S3.
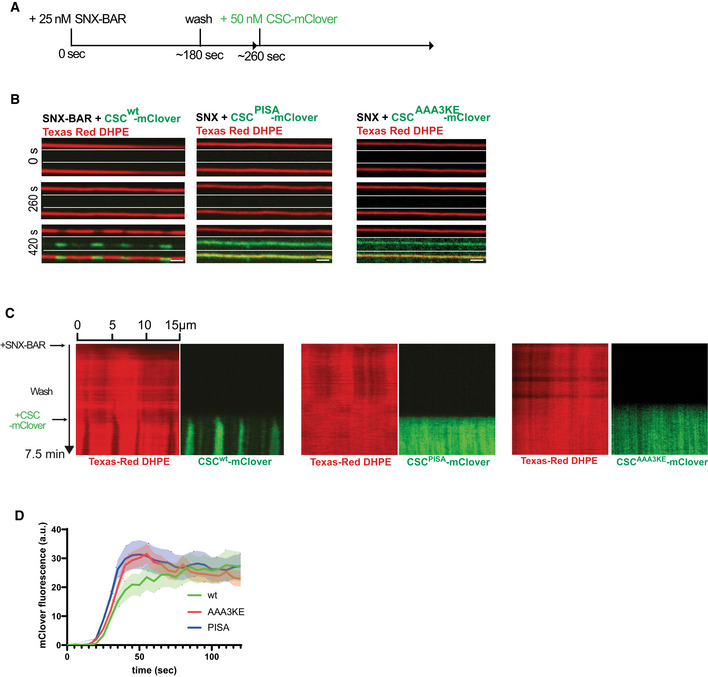
Experimental setup: supported membrane tubes (SMTs) labeled with Texas Red DHPE were preincubated with 25 nM SNX‐BARs for 3 min to load them with SNX‐BARs but not allow formation of constrictions. After a wash with protein‐free buffer, 50 nM of retromermClover carrying the indicated Vps35 variants was added. The tubes were imaged by confocal microscopy at a framerate of 0.5 Hz.
Images of three timepoints after addition of retromermClover variants. Scale bar: 2 μm.
Kymographs of the entire reactions. Experiments are shown in Movies [Link], [Link].
Quantification of retromermClover recruitment over time. SMTs were incubated as in (A). mClover fluorescence appearing along the entire length of the tubes during the second incubation phase was quantified over time. n = 10 tubes per variant. Curves represent the mean and shaded areas around the curves represent the SEM.
- A, B
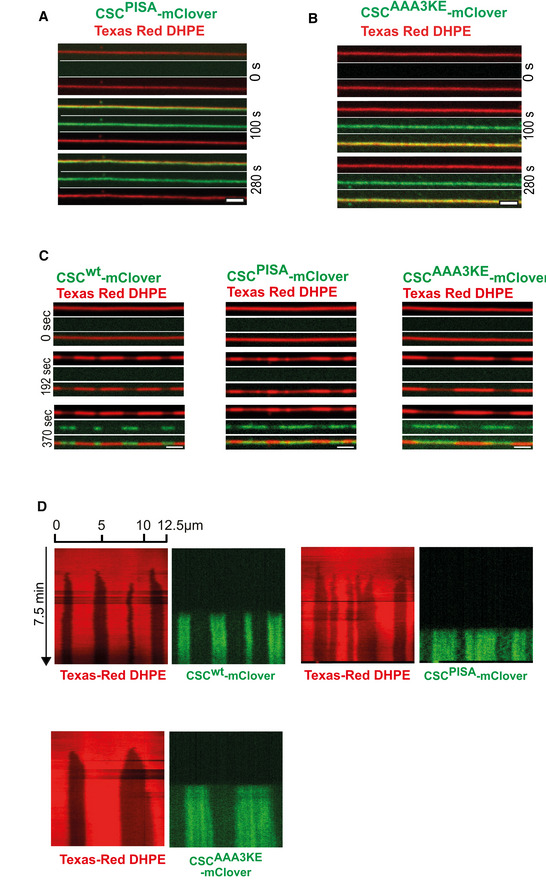
SMT assay with the dimerization mutants. 50 nM SNX‐BARs and 50 nM of retromermClover carrying the indicated Vps35 variants were incubated with SMTs and imaged by confocal microscopy. Note that for retromerwt already 25 nM reliably induces constrictions. The higher concentration chosen for the substituted retromer complexes is safely above that critical threshold and provides rapid formation of constrictions. Scale bars: 2 μm.
- C
Binding of retromer variants to pre‐formed SNX‐BARs domains. SMTs were incubated with high SNX‐BARs concentration (100 nM) for 2 min to pre‐form constrictions zones. Unbound SNX‐BARs were washed away and 50 nM retromermClover containing the indicated Vps35 variants was added. Panels show tubes before SNX‐BARs addition (0 s), after the formation of SNX‐BARs only coats (192 s) and after incubation with retromermClover variants (370 s). Tubes were imaged by spinning disc confocal microscopy at 0.5 Hz throughout the experiment. Scale bars: 2 μm.
- D
Kymographs of the tubes shown in (C).
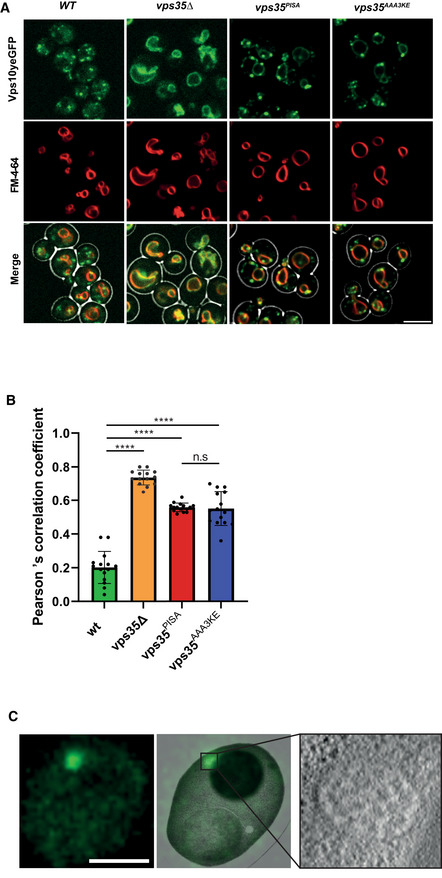
Vps10yEGFP localization. Yeast cells carrying Vps10yEGFP and expressing the indicated vps35 alleles as the sole source of Vps35 were logarithmically grown in SC medium. Their vacuoles were labeled with FM4‐64. Cells were harvested by brief centrifugation and immediately imaged by confocal microscopy. Single confocal planes are shown. A brightfield image was used to outline the cell boundaries (shown in the merged images). Scale bar: 5 μm.
Co‐localization of Vps10yEGFP and FM4‐64 in cells from (A) was measured using Pearson's coefficient. 15 Confocal planes with 20–30 cells each from three independent experiments were analyzed. Means and standard error of the mean are shown. P‐values were calculated by Welch's t‐test. ****P < 0.0001.
CLEM analysis of Vps10yEGFP localization in vps35PISA mutant cells. Logarithmically growing cells were high‐pressure frozen and processed by freeze substitution and embedding. Scale bar: 5 μm.
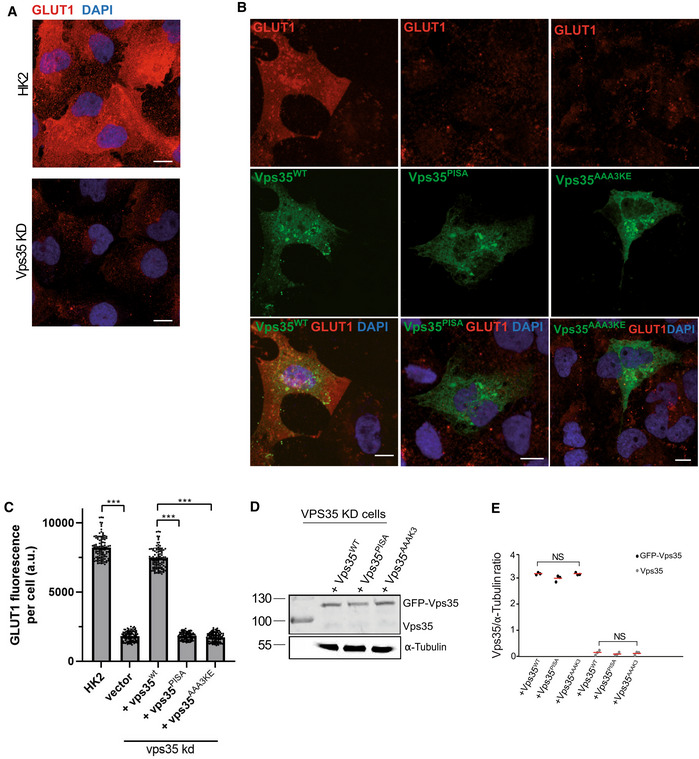
GLUT1 at the plasma membrane. HK2 cells were treated with siRNA targeting VPS35 or with mock siRNA. Cells were fixed and stained with antibody to GLUT1 (red) and with DAPI (blue). Cells were not detergent permeabilized to preferentially show GLUT1 at the cell surface. Maximum projections of image stacks (step size in z of 300 nm) are shown. Scale bars: 10 μm.
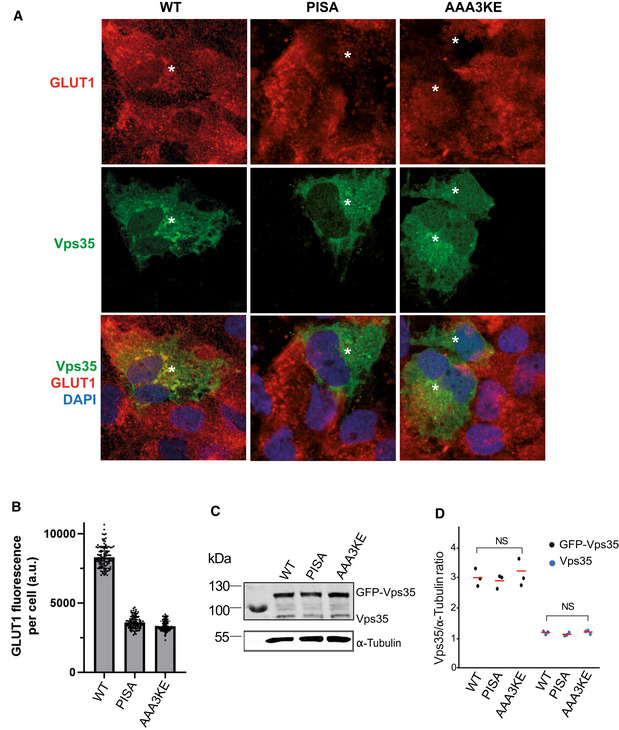
Influence of VPS35 variants on GLUT1. HK2 cells silenced for VPS35 were transfected with a plasmid carrying siRNA‐resistant wildtype or mutant forms of GFP‐VPS35. GLUT1 was detected by fixation and immunofluorescence staining as in (A). Maximum projections of image stacks (step size in z of 300 nm) are shown. Scale bars: 10 μm.
Quantification of GLUT1 immunofluorescence in cells from (B). Regions of interest (ROIs) corresponding to cells expressing the indicated VPS35 variants, and some regions outside the cells (background), were manually defined using ImageJ software. Total cell fluorescence was integrated and corrected for background fluorescence. 105 cells per condition stemming from three independent experiments were analyzed. Mean and SEM are indicated. P‐values were calculated by Welch's t‐test. The analysis was performed with 99% confidence: ***P < 0.001.
Expression of Vps35 variants in cells from (B) was analyzed by SDS–PAGE and Western blot against Vps35. Tubulin served as loading control.
Quantification of the Vps35/tubulin ratio in cells from (B). Data stem from three independent experiments and show the mean and SEM. P‐values were calculated by Welch's t‐test. NS: not significant (P > 0.01).
HK2 cells were transfected with a plasmid carrying the indicated variants of hVPS35GFP, or with an empty plasmid, and cultivated for 24 h. They were fixed, stained with antibody to GLUT1 (red) and with DAPI (blue) and analyzed by confocal microscopy. The cells were not detergent permeabilized. Scale bar: 10 μm.
Quantification of GLUT1 fluorescence in the cells from (A) was performed as in Fig 9C.
Expression of Vps35 variants in cells from (A) was analyzed by SDS–PAGE and Western blot against Vps35. Tubulin served as loading control.
Quantification of the Vps35/tubulin ratio in cells from (A). Data stem from three independent experiments and show the mean. NS: not significant according to a two‐tailed t‐test (P > 0.01).
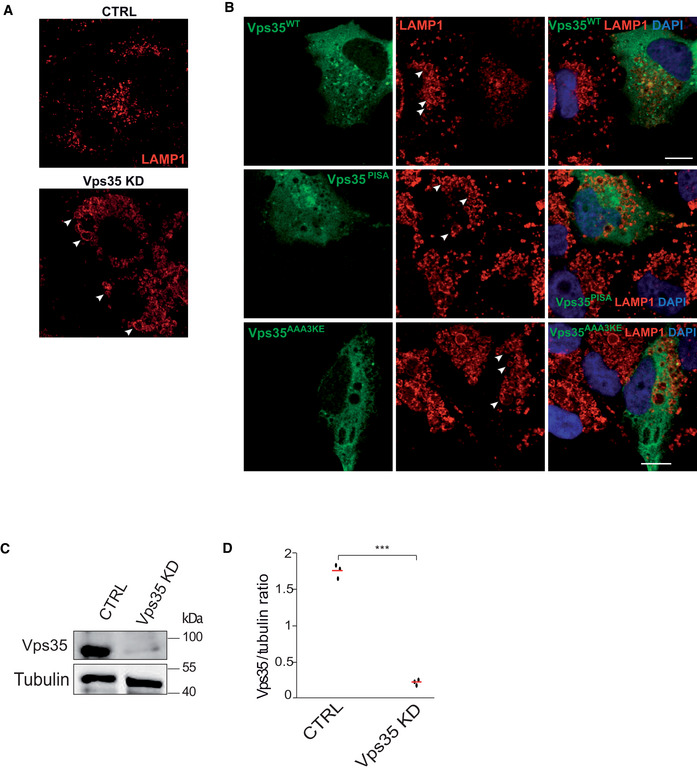
Effect of VPS35 knockdown. HK2 cells were treated with siRNA targeting VPS35 or with mock siRNA. The cells were fixed and immuno‐stained with anti‐LAMP1 antibody and DAPI and imaged by confocal microscopy. Representative images are shown. Scale bar: 10 μm. Arrowheads point to examples of enlarged LAMP1‐compartments. Scale bar: 10 μm.
Effect of VPS35 variants. Vps35 knock‐down cells were transfected with a plasmid expressing siRNA‐resistant wildtype or mutant forms of VPS35GFP, or with an empty plasmid. Cells were fixed, immuno‐stained with anti‐LAMP1 and DAPI and imaged by confocal microscopy. Scale bar: 10 μm. Arrowheads point to examples of enlarged LAMP1‐compartments.
Western blot assessing the siRNA Vps35 knockdown efficiency. Tubulin was used as a loading control.
Quantification of the siRNA knockdown efficiency of Vps35 for tree‐independent experiments.
Similar articles
-
Molecular basis for the assembly of the Vps5-Vps17 SNX-BAR proteins with Retromer.Nat Commun. 2025 Apr 15;16(1):3568. doi: 10.1038/s41467-025-58846-8. Nat Commun. 2025. PMID: 40234461 Free PMC article.
-
The VINE complex is an endosomal VPS9-domain GEF and SNX-BAR coat.Elife. 2022 Aug 8;11:e77035. doi: 10.7554/eLife.77035. Elife. 2022. PMID: 35938928 Free PMC article.
-
N-terminal signals in the SNX-BAR paralogs Vps5 and Vin1 guide endosomal coat complex formation.Mol Biol Cell. 2024 Jun 1;35(6):ar76. doi: 10.1091/mbc.E24-01-0043. Epub 2024 Apr 10. Mol Biol Cell. 2024. PMID: 38598303 Free PMC article.
-
You can go your own way: SNX-BAR coat complexes direct traffic at late endosomes.Curr Opin Cell Biol. 2022 Jun;76:102087. doi: 10.1016/j.ceb.2022.102087. Epub 2022 May 12. Curr Opin Cell Biol. 2022. PMID: 35569261 Review.
-
Updated Insight into the Physiological and Pathological Roles of the Retromer Complex.Int J Mol Sci. 2017 Jul 25;18(8):1601. doi: 10.3390/ijms18081601. Int J Mol Sci. 2017. PMID: 28757549 Free PMC article. Review.
Cited by
-
Assembly and fission of tubular carriers mediating protein sorting in endosomes.Nat Rev Mol Cell Biol. 2024 Oct;25(10):765-783. doi: 10.1038/s41580-024-00746-8. Epub 2024 Jun 17. Nat Rev Mol Cell Biol. 2024. PMID: 38886588 Review.
-
Molecular basis for the assembly of the Vps5-Vps17 SNX-BAR proteins with Retromer.Nat Commun. 2025 Apr 15;16(1):3568. doi: 10.1038/s41467-025-58846-8. Nat Commun. 2025. PMID: 40234461 Free PMC article.
-
Emerging Role of Sorting Nexin 17 in Human Health and Disease.Curr Protein Pept Sci. 2024;25(10):814-825. doi: 10.2174/0113892037284582240522155112. Curr Protein Pept Sci. 2024. PMID: 38874037 Review.
References
-
- Angelova MI, Soléau S, Méléard P, Faucon F, Bothorel P (1992) Trends in colloid and interface science VI. Prog Colloid Polym Sci 127–131
-
- Balderhaar HJK, Arlt H, Ostrowicz C, Bröcker C, Sündermann F, Brandt R, Babst M, Ungermann C (2010) The Rab GTPase Ypt7 is linked to retromer‐mediated receptor recycling and fusion at the yeast late endosome. J Cell Sci 123: 4085–4094 - PubMed
Publication types
MeSH terms
Substances
LinkOut - more resources
Full Text Sources
Molecular Biology Databases
Miscellaneous
