HIF2α activation and mitochondrial deficit due to iron chelation cause retinal atrophy
- PMID: 36645044
- PMCID: PMC9906391
- DOI: 10.15252/emmm.202216525
HIF2α activation and mitochondrial deficit due to iron chelation cause retinal atrophy
Abstract
Iron accumulation causes cell death and disrupts tissue functions, which necessitates chelation therapy to reduce iron overload. However, clinical utilization of deferoxamine (DFO), an iron chelator, has been documented to give rise to systemic adverse effects, including ocular toxicity. This study provided the pathogenic and molecular basis for DFO-related retinopathy and identified retinal pigment epithelium (RPE) as the target tissue in DFO-related retinopathy. Our modeling demonstrated the susceptibility of RPE to DFO compared with the neuroretina. Intriguingly, we established upregulation of hypoxia inducible factor (HIF) 2α and mitochondrial deficit as the most prominent pathogenesis underlying the RPE atrophy. Moreover, suppressing hyperactivity of HIF2α and preserving mitochondrial dysfunction by α-ketoglutarate (AKG) protects the RPE against lesions both in vitro and in vivo. This supported our observation that AKG supplementation alleviates visual impairment in a patient undergoing DFO-chelation therapy. Overall, our study established a significant role of iron deficiency in initiating DFO-related RPE atrophy. Inhibiting HIF2α and rescuing mitochondrial function by AKG protect RPE cells and can potentially ameliorate patients' visual function.
Keywords: HIF2α upregulation; RPE atrophy; iron deficiency; mitochondrial deficit; α-ketoglutarate.
© 2023 The Authors. Published under the terms of the CC BY 4.0 license.
Figures
- A–D
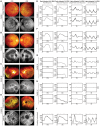
Color fundus photographs and SW‐AF examinations on four patients of β‐thalassemia subject to chelation therapy by DFO for at least 16 years. Fundus phenotypes, including RPE mottling and depigmentation in the macula (Case I; Gelman et al, 2014), choroidal sclerosis in the perimacular areas (Case II), peripapillary (Cases III and IV), and subretinal pigmentation (Case IV) were evaluated. RPE lesions including concentric distribution of stippled hyper‐autofluorescence at the macula (Case I), large areas of hypo‐autofluorescent regions at parapapillary or perimacular area (Cases II and III), and extensive RPE loss in both eyes (Case IV) were observed by SW‐AF.
- E–H
ffERG test on the four patients to analyze the light‐ and dark‐adapted vision.
- I
ffERG profiling of a healthy individual was obtained as the reference.

- A–C
Adult C57BL/6J mice (four months old) were intraperitoneally injected with DFO at 100 mg/kg three times a week for three months in a row. SW‐AF images were acquired longitudinally at one, two and three months post injection.
- D, E
SD‐OCT was performed on seven‐month‐old mice subject to six months of DFO injection. Age‐matched mice without DFO injection were included as the control. Rectangle indicates outer retina/RPE region. Yellow dashed line indicates the RPE layer. ONL: outer nuclear layer; RPE: retinal pigment epithelium.
- F, G
ERG was carried out on the mice injected with DFO for six months. Photoreceptor scotopic response was measured under the condition of −3 log cd·s/m2; the mixed response was measured under the condition of 0.417 log cd·s/m2; the photopic response was measured under the condition of 1.48 log cd·s/m2. The statistics are analyzed by unpaired Student's t‐test. The results are presented as mean ± S.E.M., n = 4 mice for each group.
- H
RPE light response was determined by exposing mouse eyes to a series of flash intensities. Age‐matched untreated mice were included as the controls. The statistics under the same flash intensity are analyzed by unpaired Student's t‐test. The results are presented as mean ± S.E.M., n = 4 mice for each group. *P < 0.05.
- I, J
Flat mount RPE was harvested from the mice treated with DFO for five months and stained by TUNEL to detect cell death. Hoechst was used for nuclear staining. Untreated mice of similar age were used as the healthy controls. Flat mount images were captured by 10× confocal microscopy and stitched together. Scale bar: 1 mm.
- K–N
The RPE was dissected from the mice injected with DFO for three and nine months, respectively, and stained with phalloidin. Age‐matched untreated mice were included as the controls. The images were taken at 40× magnification. Scale bar: 50 μm.
- A–H
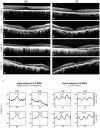
SD‐OCT of the four thalassemia patients with a history of taking DFO showed interruption of the ellipsoid zone (Case I; Gelman et al, 2014), decreased photoreceptor nuclear layer, and thinning of the retinal layers (Cases II–IV). Focal thickening and bumps of RPE were also noted in Case I. Granular hyper‐reflective deposits within the RPE (yellow arrows) can be seen in all four cases. An intraretinal degenerative cyst (Case IV) and multiple areas of choroidal hyper‐transmission were also noted in Cases II–IV.
- I
The ffERG examination on Case IV with continuous supplementation of AKG for 18 months (2 g/day). Repeated ffERG examination (lower panel) on both eyes showed increased amplitudes in light‐adapted single‐flash cone and 30 Hz flicker responses compared with the amplitude prior to taking AKG (upper panel). The exact numbers of the peak value are indicated inside the panel boxes. Y‐Axis: microvolts; X‐Axis: milliseconds.
- A–D
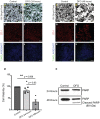
Light microscopic examination of the iRPE cells 24‐ and 48‐h post treatment. Scale bar: 50 μm.
- E–H
iRPE cells were stained with ZO‐1 24‐ and 48‐h post treatment. Untreated iRPE cells were used as the control. Scale bar: 30 μm.
- I–L
Cell death among the iRPE population was examined by TUNEL assay 24‐h and 48‐h post treatment. Untreated iRPE cells were included as the control. The cells were counterstained with Hoechst. Scale bar: 30 μm.
- M
Cell viability was determined with the iRPE cells subject to DFO treatment for 24‐ and 48‐h. The colorimetric values of the treatment groups were normalized to the control group. The statistics are analyzed by one‐way ANOVA with the Tukey test. The results are presented as mean ± S.E.M., n = 5 iRPE lines for each group. *P < 0.05; **P < 0.01.
- N
iRPE cells were collected and lysed for immunoblotting assay against PARP, which was predicted to be 100 kDa. The molecular weight of cleaved PARP was predicted to be 89 kDa.

- A, B
SD‐OCT was performed on DFO‐treated mouse eyes to display potential changes to RPE and retina, respectively. Yellow arrows denote hyper‐reflective signal and outer retinal lesion in SW‐AF and SD‐OCT, respectively (A); and hypo‐reflective signal and lesions located in the photoreceptor outer segment/RPE microvilli area (B). Yellow lines in the near‐infrared images indicate the sections scanned by SD‐OCT.
- C, D
Cell death was examined by TUNEL assay in the retinas collected from the mice with DFO treatment for five months.
- E, F
Cone photoreceptors were stained by Arrestin 3 in retinal flat mounts from the mice with DFO treatment for five months.
- A
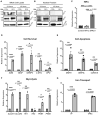
iRPE cells treated with DFO were collected and lysed to measure the expression of HIF1α and HIF2α 24‐ and 48‐h after the treatment. The iRPE cells supplemented with 0.1% DMSO in the culture media were used as the control. Actin was used as the loading control. HIF1α (post‐translationally modified) was predicted to be ~ 100 kDa; HIF2α (post translationally modified) was predicted to be ~ 120 kDa.
- B
iRPE cells treated with DFO were lysed and fractionated by centrifugation to measure the expression of HIF1α and HIF2α in the nuclei 24‐ and 48‐h after the treatment. Untreated iRPE cells were used as the normal control. Histone H3 was used as the loading control.
- C–G
The transcripts of HIFα‐regulated genes were determined by qPCR with iRPE cells subject to DFO treatment for 24‐h as the template. The cDNA transcript extracted from untreated iRPE was included as the control. The expression of each transcript was normalized to ACTB as the housekeeping gene. (C) Measurement of the HIF1α and HIF2α transcripts. The statistics are analyzed by one‐way ANOVA with the Tukey test. The results are presented as mean ± S.E.M., n = 3 iRPE lines for each group. ***P < 0.001. (D) Measurement of cell‐survival‐related transcripts regulated by HIFα. (E) Measurement of apoptosis‐related transcript regulated by HIFα. (F) Measurement of glycolysis‐related transcript regulated by HIFα. (G) Measurement of iron‐transport‐related transcript regulated by HIFα.

- A–D
The iRPE cells were treated with DFO for different time points at 100 μM.
- E–H
The iRPE cells were treated with DFO for different time points at 1 mM.
- I–L
The iRPE cells were treated with DFO for different time points at 10 mM.

- A–E
The HIFα‐regulated transcripts were determined by qPCR with iRPE cells subject to DFO treatment for 48‐h. The cDNA transcript extracted from the untreated iRPE was included as the control. The level of each transcript was normalized to ACTB. (A) Measurement of the HIF1α and HIF2α transcripts. The statistics are analyzed by one‐way ANOVA with the Tukey test. The results are presented as mean ± S.E.M., n = 4 iRPE lines for each group. (B) Measurement of cell‐survival‐related transcripts regulated by HIFα. (C) Measurement of apoptosis‐related transcript regulated by HIFα. (D) Measurement of glycolysis‐related transcript regulated by HIFα. (E) Measurement of iron‐transport‐related transcript regulated by HIFα.
- F
RPE lysate from the one‐year‐old mice subject to 10‐month DFO treatment with or without concomitant supplementation of AKG was used for immunoblotting against HIF1α. The RPE harvested from the age‐matched untreated mice was included as the control. HIF1α (degraded) was predicted to be 40–80 kDa. Actin was used as the loading control.
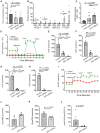
- A
Ferrous iron was measured. The statistics are analyzed by one‐way ANOVA with the Tukey test. The results are presented as mean ± S.E.M., n = 3 iRPE lines for each group. *P < 0.05.
- B
The transcripts of ferroptosis‐associated markers were determined by qPCR using iRPE cells as the template. The RNA extract from untreated iRPE was included as the control. The level of each transcript was normalized to ACTB. The statistics are analyzed by ratio paired Student's t‐test for each target gene. The results are presented as mean ± S.E.M., n = 3 iRPE lines for each group. *P < 0.05; **P < 0.01. Round dots: untreated iRPE; square dots: DFO‐treated iRPE.
- C
The level of ROS was measured. The statistics are analyzed by one‐way ANOVA with the Tukey test. The results are presented as mean ± S.E.M., n = 6 iRPE lines for each group. *P < 0.05, **P < 0.01. DHE: Dihydroethidium.
- D
Mitochondrial respiration of the iRPE cells with DFO treatment was determined by seahorse extracellular flux assay. OCR was determined over a course of time. Each data point is shown as mean ± S.E.M., n = 4 iRPE lines for each group. OCR: oxygen consumption rate; FCCP: carbonyl cyanide 4‐(trifluoromethoxy) phenylhydrazone; Rot: rotenone; AA: antimycin A.
- E–H
Basal respiration (E), ATP production (F), maximal respiration (G) and spare mitochondrial capacity (H) were calculated based on OCR tracing readout. The statistics are analyzed by one‐way ANOVA with the Tukey test. The results are presented as mean ± S.E.M., n = 4 iRPE lines for each group. *P < 0.05, **P < 0.01.
- I
Glycolytic stress of the iRPE cells in the presence of DFO was determined by Seahorse extracellular flux assay. ECAR was determined over a course of time. Each data point is shown as mean ± S.E.M., n = 4 iRPE lines for each group. ECAR: extracellular acidification rate.
- J–L
Basal glycolysis (J), compensatory glycolysis (K) and the ratio between mitochondrial OCR and glycolysis (L) were determined based on the ECAR tracing readout. The results are presented as mean ± S.E.M., n = 4 iRPE lines for each group. *P < 0.05, **P < 0.01.
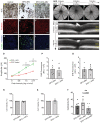
- A–C
Light microscopy of morphological protection of AKG against DFO toxicity on iRPE. The cells were treated with DFO at 100 mM for 48 h (B). AKG was supplemented at 10 mM simultaneously (C). The control group was supplemented with 0.1% DMSO (A). Scale bar: 100 μm.
- D–F
The DFO‐treated iRPE cells with or without AKG supplementation were subject to phalloidin staining (E and F). The iRPE cells treated with 0.1% DMSO‐containing media were included as the controls (D). The images were captured at 40× magnification. Scale bar: 30 μm.
- G–I
Detection of cell death in the DFO‐treated iRPE cells with or without AKG supplementation by TUNEL staining. Hoechst was used for nuclear staining. The images were captured at 40× magnification. Scale bar: 30 μm.
- J–L
SW‐AF was performed longitudinally on the mice treated with DFO for up to 10 months in conjunction with supplementation of AKG for seven months.
- M, N
SD‐OCT was performed on the DFO‐treated mice with AKG supplementation at three and seven months, respectively. ONL: outer nuclear layer; RPE: retinal pigment epithelium.
- O
The c‐wave ERG was performed on the mice treated by DFO (seven months) with AKG (six months). DFO‐treated mice without AKG supplementation were included as the controls. The statistics associated with each flash intensity are analyzed by unpaired Student's t‐test. The results are presented as mean ± S.E.M., n = 4 mice for each group. *P < 0.05.
- P–T
The iRPE cells treated with DFO (100 mM) with or without supplementation of AKG (10 mM) were collected for the following assays: (P, Q) The level of ROS was measured by the dihydroethidium (DHE) fluorometric assay. The statistics are analyzed by paired Student's t‐test. The results are presented as mean ± S.E.M., n = 6 iRPE lines for each group. (R, S) The cell viability was determined by the MTT assay 24 and 48 h post treatment. The colorimetric values were normalized to the control group. The statistics are analyzed by paired Student's t‐test. The results are presented as mean ± S.E.M., n = 4 iRPE lines for each group. (T) Cytotoxicity in iRPE cells was tested by the colorimetric LDH cytotoxicity assay. The statistics are analyzed by one‐way ANOVA with the Tukey test. The results are presented as mean ± S.E.M., n = 5 iRPE lines for each group. **P < 0.01.
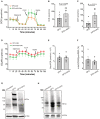
- A
Mitochondrial respiration of the DFO‐treated (100 mM) iRPE cells with AKG supplementation (10 mM) for 24 h was determined by seahorse extracellular flux assay. OCR was measured over a course of time. Each dot is shown as mean ± S.E.M., n = 5 iRPE lines for each group. OCR: oxygen consumption rate; FCCP: carbonyl cyanide 4‐(trifluoromethoxy) phenylhydrazone; Rot: rotenone; AA: antimycin A.
- B, C
Maximal (B) and spare capacity (C) of mitochondrial respiration were determined based on the OCR tracing readout. The statistics are analyzed by paired Student's t‐test. The results are presented as mean ± S.E.M., n = 5 iRPE lines for each group. *P < 0.05.
- D
Glycolytic stress of the DFO‐treated (100 mM) iRPE cells with AKG supplementation (10 mM) for 24 h was determined by seahorse extracellular flux assay. ECAR was measured over a course of time. Each dot is shown as mean ± S.E.M., n = 5 iRPE lines for each group. ECAR: extracellular acidification rate.
- E, F
The basal (E) and the ratio (F) between mitochondrial OCR and glycolysis were determined based on the ECAR tracing readout. The statistics are analyzed by paired Student's t‐test. The results are presented as mean ± S.E.M., n = 5 iRPE lines for each group.
- G
The DFO‐treated (100 mM) iRPE cells supplemented with AKG (10 mM) for 48 h were lysed for immunoblotting against HIF2α. The iRPE cells supplemented with 0.1% DMSO in the culture media were used as the controls. HIF2α (post translationally modified) was predicted to be ~120 kDa. Actin was included as the loading control.
- H
RPE lysate from the one‐year‐old mice subject to 10‐month DFO treatment with or without concomitant supplementation of AKG was used for immunoblotting against HIF2α. The RPE of the age‐matched untreated mice was included as the control. HIF2α (degraded) was predicted to be 40–80 kDa. Actin was used as the loading control.
Comment in
-
Lifting the iron curtain of vision.EMBO Mol Med. 2023 Feb 8;15(2):e17259. doi: 10.15252/emmm.202217259. Epub 2023 Jan 30. EMBO Mol Med. 2023. PMID: 36715217 Free PMC article.
References
-
- Anderson LJ, Holden S, Davis B, Prescott E, Charrier CC, Bunce NH, Firmin DN, Wonke B, Porter J, Walker JM et al (2001) Cardiovascular T2‐star (T2*) magnetic resonance for the early diagnosis of myocardial iron overload. Eur Heart J 22: 2171–2179 - PubMed
-
- Baath JS, Lam WC, Kirby M, Chun A (2008) Deferoxamine‐related ocular toxicity: incidence and outcome in a pediatric population. Retina 28: 894–899 - PubMed
-
- Borgna‐Pignatti C, Rugolotto S, De Stefano P, Zhao H, Cappellini MD, Del Vecchio GC, Romeo MA, Forni GL, Gamberini MR, Ghilardi R et al (2004) Survival and complications in patients with thalassemia major treated with transfusion and deferoxamine. Haematologica 89: 1187–1193 - PubMed
Publication types
MeSH terms
Substances
Grants and funding
- R24 EY028758/EY/NEI NIH HHS/United States
- R01 EY024698/EY/NEI NIH HHS/United States
- R01 EY026682/EY/NEI NIH HHS/United States
- R01 EY018213/EY/NEI NIH HHS/United States
- R01 EY028131/EY/NEI NIH HHS/United States
- P30 CA013696/CA/NCI NIH HHS/United States
- R01 EY033770/EY/NEI NIH HHS/United States
- U01 EY034590/EY/NEI NIH HHS/United States
- S10 OD028637/OD/NIH HHS/United States
- U01 EY030580/EY/NEI NIH HHS/United States
- R24 EY027285/EY/NEI NIH HHS/United States
- U54 OD020351/OD/NIH HHS/United States
- R21 AG050437/AG/NIA NIH HHS/United States
- P30 EY019007/EY/NEI NIH HHS/United States
LinkOut - more resources
Full Text Sources
Medical

