. 2023 Dec;45(1):2162419.
doi: 10.1080/0886022X.2022.2162419.

Inositol 1,4,5-trisphosphate receptor type 2 is associated with the bone-vessel axis in chronic kidney disease-mineral bone disorder

Affiliations

Inositol 1,4,5-trisphosphate receptor type 2 is associated with the bone-vessel axis in chronic kidney disease-mineral bone disorder

Qiong Xiao et al. Ren Fail. 2023 Dec.

Abstract

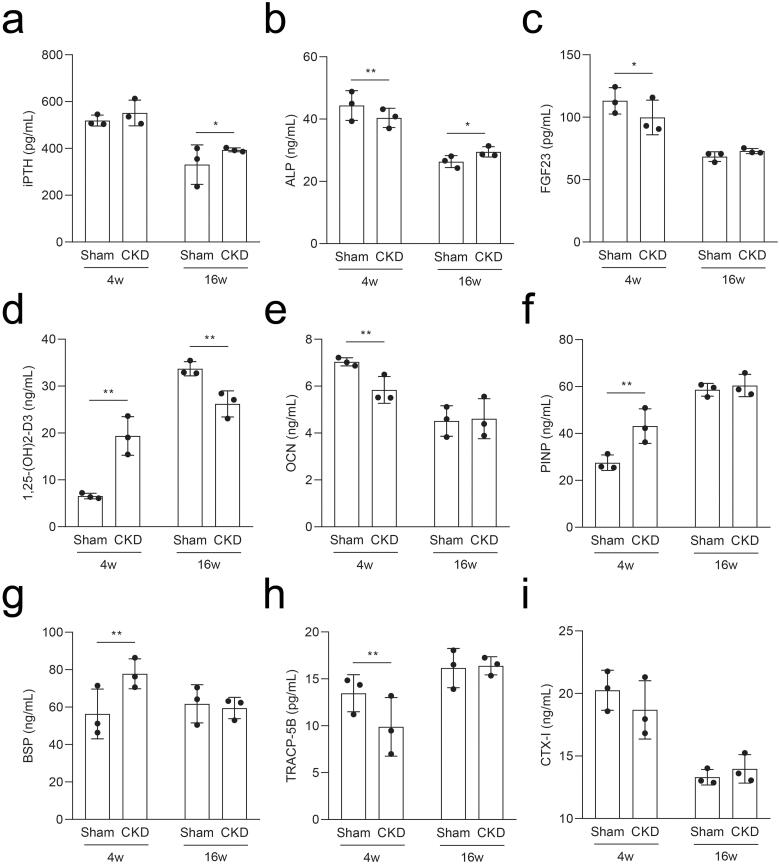
Objective: The pathogenesis of renal osteopathy and cardiovascular disease suggests the disordered bone-vessel axis in chronic kidney disease-mineral bone disorder (CKD-MBD). However, the mechanism of the bone-vessel axis in CKD-MBD remains unclear.Methods: We established a CKD-MBD rat model to observe the pathophysiological phenotype of the bone-vessel axis and performed RNA sequencing of aortas to identify novel targets of the bone-vessel axis in CKD-MBD.Results: The microarchitecture of the femoral trabecular bone deteriorated and alveolar bone loss was aggravated in CKD-MBD rats. The intact parathyroid hormone and alkaline phosphatase levels increased, 1,25-dihydroxyvitamin D3 levels decreased, and intact fibroblast growth factor-23 levels did not increase in CKD-MBD rats at 16 weeks; other bone metabolic parameters in the serum demonstrated dynamic characteristics. With calcium deposition in the abdominal aortas of CKD-MBD rats, RNA sequencing of the aortas revealed a significant decrease in inositol 1,4,5-trisphosphate receptor type 2 (ITPR2) gene levels in CKD-MBD rats. A similar trend was observed in rat aortic smooth muscle cells. As a secretory protein, ITPR2 serum levels decreased at 4 weeks and slightly increased without statistical differences at 16 weeks in CKD-MBD rats. ITPR2 serum levels were significantly increased in patients with vascular calcification, negatively correlated with blood urea nitrogen levels, and positively correlated with serum tartrate-resistant acid phosphatase 5b levels.Conclusion: These findings provide preliminary insights into the role of ITPR2 in the bone-vessel axis in CKD-MBD. Thus, ITPR2 may be a potential target of the bone-vessel axis in CKD-MBD.

Keywords: Bone–vessel axis; chronic kidney disease–mineral bone disorder; clinical relevance; inositol 1,4,5-trisphosphate receptor type 2; vascular calcification.


Conflict of interest statement

An early version of this article was uploaded to a noncommercial preprint server. The following URL is linked to the preprint page: http://ssrn.com/abstract=4155291.

Figures

Figure 1.
Figure 1.
Illustration of the study workflow. a, Schematic overview of potential targets in chronic kidney disease–mineral bone disorder (CKD–MBD) progression. b, A two-step nephrectomy was performed with left-sided uninephrectomy from 1 to 6 and right-sided subtotal nephrectomy from 7 to 13. c, Sham surgery in the sham group, 5/6 nephrectomy in the CKD group. The experimental time points were selected at 4 and 16 weeks, respectively, after surgery with phosphorus diet to mimic the clinical disease status. N = 5 for each group.
Figure 2.
Figure 2.
The 5/6 nephrectomy rat model with high phosphorus facilitated the progression of CKD–MBD in CKD. a, Hematoxylin–eosin (HE) staining and periodic acid-Schiff (PAS) staining in rat kidneys in the CKD and sham groups. b and c, Serum biochemical measurements: serum creatinine (CRE) and blood urea nitrogen (BUN) levels in the CKD and sham groups. d–f, Urine biochemical measurements: albuminuria (Alb), urine creatinine (UCr), and albuminuria/urine creatinine (ACR) levels in the CKD and sham groups. N = 5 for each group. *p < .05, **p < .01. The scale bar corresponds to 20 μm. The magnification of the microscope was ×400.
Figure 3.
Figure 3.
Effects of CKD–MBD on the femoral and alveolar bones of rats by micro-CT scanning in the CKD and sham groups at 4 and 16 weeks. a, The region of interest (ROI) and representative three-dimensional reconstruction images in the femur. An area of 1 mm below the growth plate where the growth plate had disappeared was scanned as the starting point. The scanning field continued for 1 mm as the endpoint of the ROI. b, The representative microarchitecture images of trabecular bone in femur in the CKD and sham groups. c, The representative microarchitecture images of cortical bone in femur in the CKD and sham groups. d, The representative images of alveolar bone on cementoenamel junction (CEJ) to the alveolar bone crest (ABC) distance in the distal of the mandibular first molars in the CKD and sham groups. N = 3 for each group. The scale bar ranges from 500 μm to 1 mm.
Figure 4.
Figure 4.
Serum levels of the rats in the CKD and sham groups were analyzed by ELISA at 4 and 16 weeks. a–i, The serum levels of intact parathyroid hormone (iPTH), alkaline phosphatase (ALP), intact fibroblast growth factor 23 (FGF23), 1,25-dihydroxyvitamin D3 (1,25-(OH)2-D3), osteocalcin (OCN), procollagen type I N-terminal propeptide (PINP), bone sialoprotein (BSP), tartrate-resistant acid phosphatase 5b (TRACP-5B), and C-terminal telopeptide of type I collagen (CTX-I). *p < .05, **p < .01, n = 3 for each group, each point represents the average value of the three vice wells.
Figure 5.
Figure 5.
RNA sequencing identified differentially expressed genes in the aortas of CKD–MBD rats at 4 and 16 weeks. a, Alizarin red S staining of rat abdominal aortas. The scale bar ranges from 20 μm to 100 μm. b, Principal component analysis plot of the mRNA expression profiles. c, Venn chart of the numbers of differentially expressed genes. d and e, Volcano plot analysis of differentially expressed genes at 4 and 16 weeks, |Log2FC| > 1 and p < .05. N = 3 for each group.
Figure 6.
Figure 6.
RNA sequencing identified inositol 1,4,5-trisphosphate receptor type 2 (ITPR2) significantly downregulated in the aortas of CKD–MBD rats. a and b, Gene Ontology (GO) databases analysis representatively on the differentially expressed genes at 4 and 16 weeks. c, Description of GO databases analysis representatively. d and e, Clustering heatmap of 46 differentially expressed genes between the CKD and sham groups at 4 and 16 weeks. The experiment was conducted in triplicates, |Fold change| ≥ 2, p < .05.
Figure 7.
Figure 7.
Differential expression of ITPR2 in vitro and in vivo. a, Alizarin red S staining detected calcium deposition in rat aortic smooth muscle cells (RASMCs) with and without high-phosphorus medium for seven days, denoted as the calcification group (CAL) and the non-calcification group (CTRL), respectively. b, Expression levels of ITPR2 in RASMCs, as assayed by real-time PCR. N = 3 for each group. c, Serum levels of ITPR2 were determined by ELISA in rats in the CKD and sham groups. Each point represents the average value of the three vice wells. d, Point-fold line chart in serum ITPR2 levels by ELISA in rats in the CKD and sham groups. *p < .05, **p < .01, n = 3 for each group.
Figure 8.
Figure 8.
Flowchart of the trial describing the participant selection process.
Figure 9.
Figure 9.
Serum levels of participants were analyzed by ELISA and correlation analyses of the patients undergoing maintenance hemodialysis with vascular calcification were performed. a–c, Serum 1,25-(OH)2-D3, TRACP-5B, and ITPR2 levels in patients undergoing maintenance hemodialysis with vascular calcification (CAL), without vascular calcification (non-CAL), and healthy participants (CTRL). d, Correlation analysis between VINTAGE and PINP. e, Correlation analysis between BUN and ITPR2. f, Correlation analysis between TRACP-5B and ITPR2. *p < .05, **p < .01.
Figure 10.
Figure 10.
ITPR2 in the potential association of the bone–vessel axis in CKD–MBD. The arrow colors indicate the following: orange, upregulated; blue, downregulated; green, promoted; and red, prevented. Vascular smooth muscle cell (VSMC).

References

    1. GBD, Collaboration; CKD. Global, regional, and national burden of chronic kidney disease, 1990-2017: a systematic analysis for the global burden of disease study 2017. Lancet. 2020;395(10225):709–733. - PMC - PubMed
    1. Zhang L, Wang F, Wang L, et al. . Prevalence of chronic kidney disease in China: a cross-sectional survey. Lancet. 2012;379(9818):815–822. - PubMed
    1. Moe S, Drüeke T, Cunningham J, et al. . Definition, evaluation, and classification of renal osteodystrophy: a position statement from kidney disease: improving global outcomes (KDIGO). Kidney Int. 2006;69(11):1945–1953. - PubMed
    1. Cheng X, Nayyar S, Wang M, et al. . Mortality rates among prevalent hemodialysis patients in Beijing: a comparison with USRDS data. Nephrol Dial Transplant. 2013;28(3):724–732. - PubMed
    1. de Jager DJ, Grootendorst DC, Jager KJ, et al. . Cardiovascular and noncardiovascular mortality among patients starting dialysis. JAMA. 2009;302(16):1782–1789. - PubMed