. 2023 Feb 28;14(1):e0345522.
doi: 10.1128/mbio.03455-22. Epub 2023 Jan 16.

PhyloPlus: a Universal Tool for Phylogenetic Interrogation of Metagenomic Communities

Affiliations

PhyloPlus: a Universal Tool for Phylogenetic Interrogation of Metagenomic Communities

Xinyang Huang et al. mBio. .

Abstract

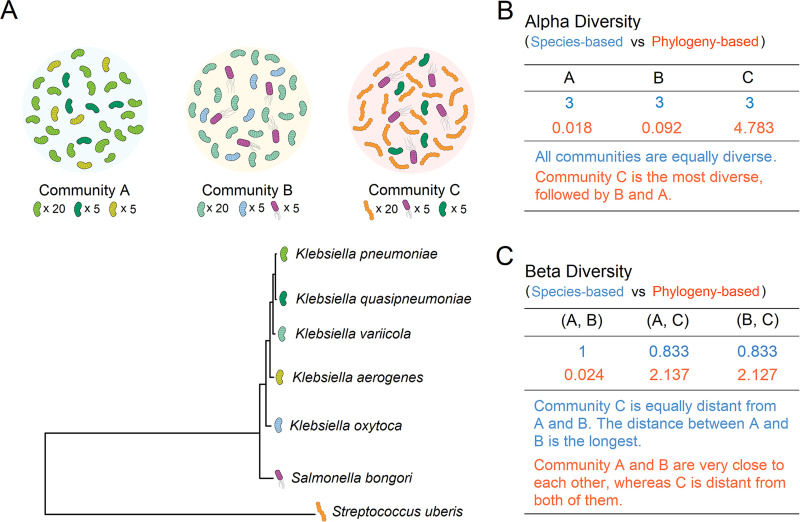
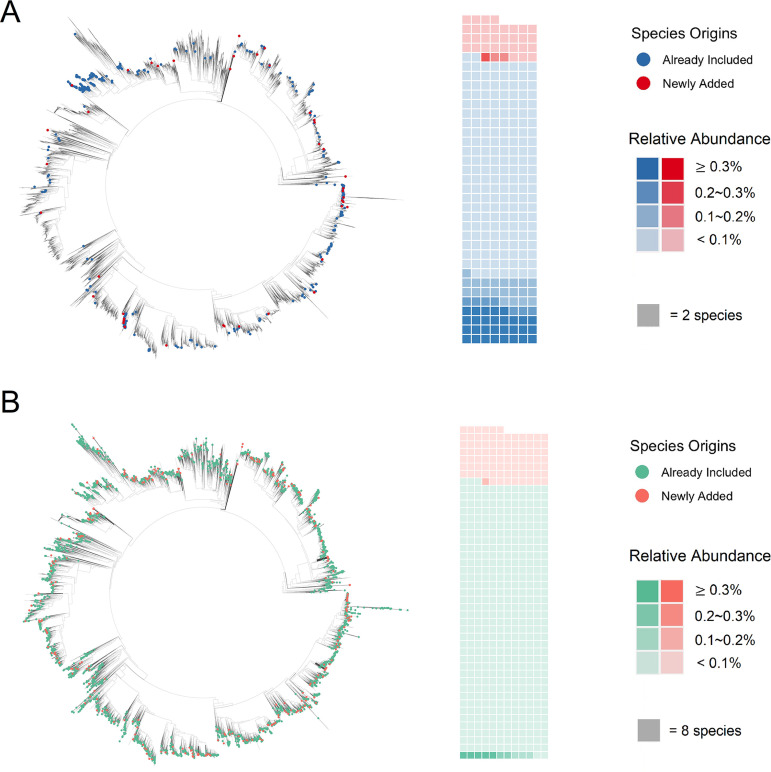
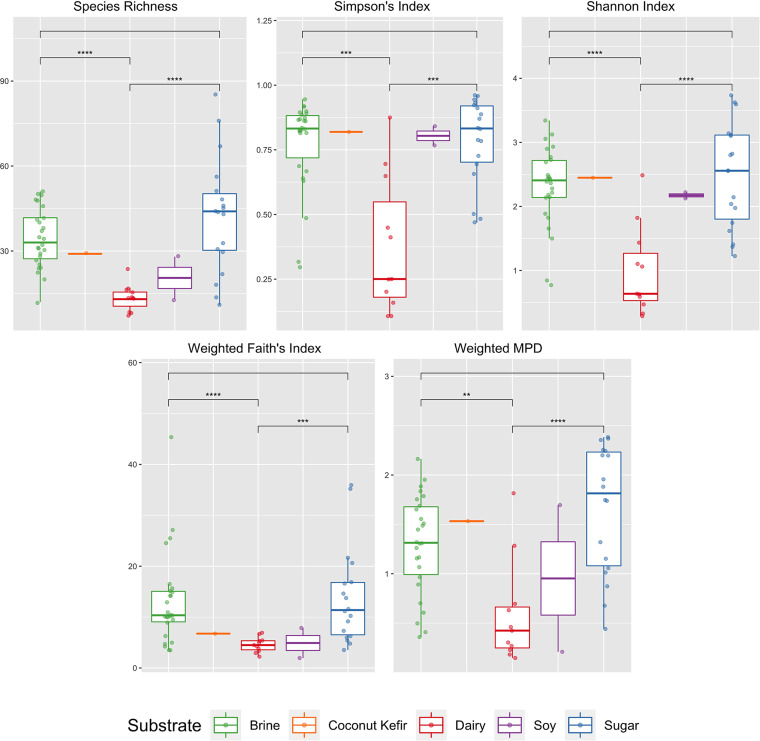
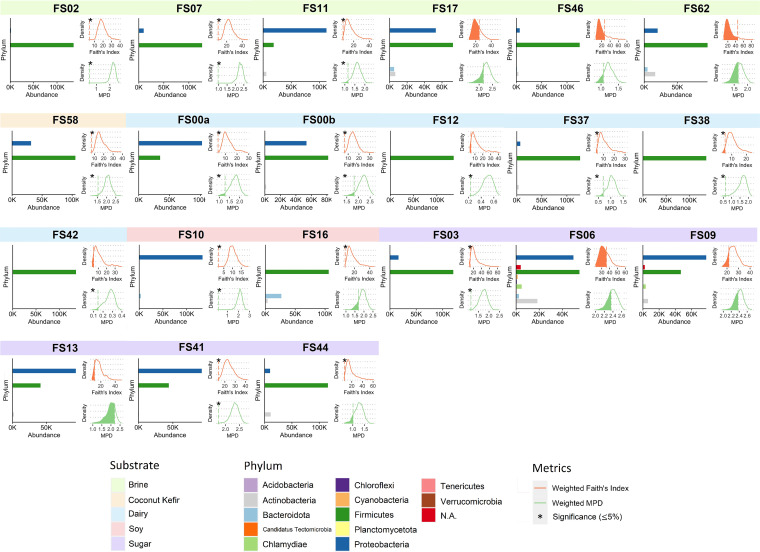
Phylogeny is a powerful tool that can be incorporated into quantitative descriptions of community diversity, yet its use has been limited largely due to the difficulty in constructing phylogenies which incorporate the wide genomic diversity of microbial communities. Here, we describe the development of a web portal, PhyloPlus, which enables users to generate customized phylogenies that may be applied to any bacterial or archaeal communities. We demonstrate the power of phylogeny by comparing metrics that employ phylogeny with those that do not when applied to data sets from two metagenomic studies (fermented food, n = 58; human microbiome, n = 60). This example shows how inclusion of all bacterial species identified by taxonomic classifiers (Kraken2 and Kaiju) made the phylogeny perfectly congruent to the corresponding classification outputs. Our phylogeny-based approach also enabled the construction of more constrained null models which (i) shed light into community structure and (ii) minimize potential inflation of type I errors. Construction of such null models allowed for the observation of under-dispersion in 44 (75.86%) food samples, with the metacommunity defined as bacteria that were found in different food matrices. We also observed that closely related species with high abundance and uneven distribution across different sites could potentially exaggerate the dissimilarity between phylogenetically similar communities if they were measured using traditional species-based metrics (Padj. = 0.003), whereas this effect was mitigated by incorporating phylogeny (Padj. = 1). In summary, our tool can provide additional insights into microbial communities of interest and facilitate the use of phylogeny-based approaches in metagenomic analyses. IMPORTANCE There has been an explosion of interest in how microbial diversity affects human health, food safety, and environmental functions among many other processes. Accurately measuring the diversity and structure of those communities is central to understanding their effects. Here, we describe the development of a freely available online tool, PhyloPlus, which allows users to generate custom phylogenies that may be applied to any data set, thereby removing a major obstacle to the application of phylogeny to metagenomic data analysis. We demonstrate that the genetic relatedness of the organisms within those communities is a critical feature of their overall diversity, and that using a phylogeny which captures and quantifies this diversity allows for much more accurate descriptions while preventing misleading conclusions based on estimates that ignore evolutionary relationships.

Keywords: diversity; metagenomics; microbial genomics; microbiome; phylogeny.


Conflict of interest statement

The authors declare no conflict of interest.

Figures

FIG 1
FIG 1
Alpha and beta diversity of three mock communities. (A) Three mock communities containing different bacterial species, with a phylogenetic tree showing their evolutionary relatedness. Species in community A share the same genus, species in community B share the same family, and species in community C share the same superkingdom. (B) Measuring the alpha diversity within these mock communities: example diversity metrics are species richness (species-based) and weighted Faith’s index (phylogeny-based). (C) Measuring the beta diversity between these mock communities: example diversity metrics are weighted Bray-Curtis (species-based) and weighted UniFrac (phylogeny-based). Whether or not phylogeny is incorporated into diversity analysis can lead to different conclusions.
FIG 2
FIG 2
Insertion places and overall relative abundance for identified bacterial species. (A) Species identified in fermented food samples. (B) Species identified in human microbiome samples. In the final expanded phylogeny, the identified bacterial species could have already been included in the original phylogeny or have been newly added, and they are marked with different colors accordingly.
FIG 3
FIG 3
Alpha diversity for fermented food by different substrates. First row presents species-based metrics that were also used in the original study; second row presents phylogeny-based metrics. Pairwise t tests were performed to determine whether these alpha diversity metrics differed significantly between different substrate types; significant differences are shown by asterisks. *, P ≤ 0.05; **, P ≤ 0.01; ***, P ≤ 0.001; ****, P ≤ 0.0001. Coconut kefir and soy food had insufficient sample sizes for pairwise comparisons.
FIG 4
FIG 4
Phylum-level taxonomic composition and alpha diversity null distributions for selected fermented food samples. For each subplot: left, relative abundance of different phyla; upper right, null distribution of weighted Faith’s index; lower right, null distribution of weighted mean pairwise distance (MPD). Null distributions were generated by random shuffling phylogenetic tip labels; area under the curve shows the percentile in which the observed value ranked among the permuted values. Asterisks indicate that the percentile was less than or equal to 5%, suggesting phylogenetic under-dispersion of the bacterial community.
FIG 5
FIG 5
Bacterial diversity in human microbiome communities used in this study. Center: phylogenetic tree for bacterial species that were present in the communities, extracted from the expanded phylogeny. The tips are colored according to their phylum. Middle ring: relative abundance of a species compared across different body sources, color opacity represents the percentage of the species identified in each source. Outer ring: bar plot showing the total abundance of each species. Abundance data have been transformed into log2 scale, and bars are colored by phylum.
FIG 6
FIG 6
Beta diversity nonmetric multidimensional scaling (NMDS) plots. (A) NMDS plots showing separation among communities from different body sources using different beta diversity metrics. (B and C) Results of fitting significant (P ≤ 0.05) taxon abundance vectors (phylum and species, respectively) on weighted Bray-Curtis and weighted UniFrac NMDS plots, rescaled so that the vector length equals the corresponding correlation coefficient (R). Only species with an abundance of ≥50,000 are plotted in panel C. Black numbers represent example species belonging to phylum Bacteroidetes which show strong correlation (R > 0.7) in both subplots; red numbers represent example species which only show strong correlation when weighted Bray-Curtis distances are applied.

References

    1. Human Microbiome Project Consortium. 2012. Structure, function and diversity of the healthy human microbiome. Nature 486:207–214. doi:10.1038/nature11234. - DOI - PMC - PubMed
    1. Caputo M, Zoch-Lesniak B, Karch A, Vital M, Meyer F, Klawonn F, Baillot A, Pieper DH, Mikolajczyk RT. 2019. Bacterial community structure and effects of picornavirus infection on the anterior nares microbiome in early childhood. BMC Microbiol 19:1. doi:10.1186/s12866-018-1372-8. - DOI - PMC - PubMed
    1. Mostafa HH, Fissel JA, Fanelli B, Bergman Y, Gniazdowski V, Dadlani M, Carroll KC, Colwell RR, Simner PJ. 2020. Metagenomic next-generation sequencing of nasopharyngeal specimens collected from confirmed and suspect COVID-19 patients. mBio 11:e01969-20. doi:10.1128/mBio.01969-20. - DOI - PMC - PubMed
    1. Patin NV, Peña-Gonzalez A, Hatt JK, Moe C, Kirby A, Konstantinidis KT. 2020. The role of the gut microbiome in resisting norovirus infection as revealed by a human challenge study. mBio 11:e02634-20. doi:10.1128/mBio.02634-20. - DOI - PMC - PubMed
    1. Li K, Bihan M, Yooseph S, Methé BA. 2012. Analyses of the microbial diversity across the human microbiome. PLoS One 7:e32118. doi:10.1371/journal.pone.0032118. - DOI - PMC - PubMed

Publication types

Substances

LinkOut - more resources