. 2023 Feb 16;91(2):e0051322.
doi: 10.1128/iai.00513-22. Epub 2023 Jan 16.

Tryptophan Availability during Persistence of Chlamydia trachomatis Directly Impacts Expression of Chlamydial Cell Division Proteins

Affiliations

Tryptophan Availability during Persistence of Chlamydia trachomatis Directly Impacts Expression of Chlamydial Cell Division Proteins

Camille M Riffaud et al. Infect Immun. .

Abstract

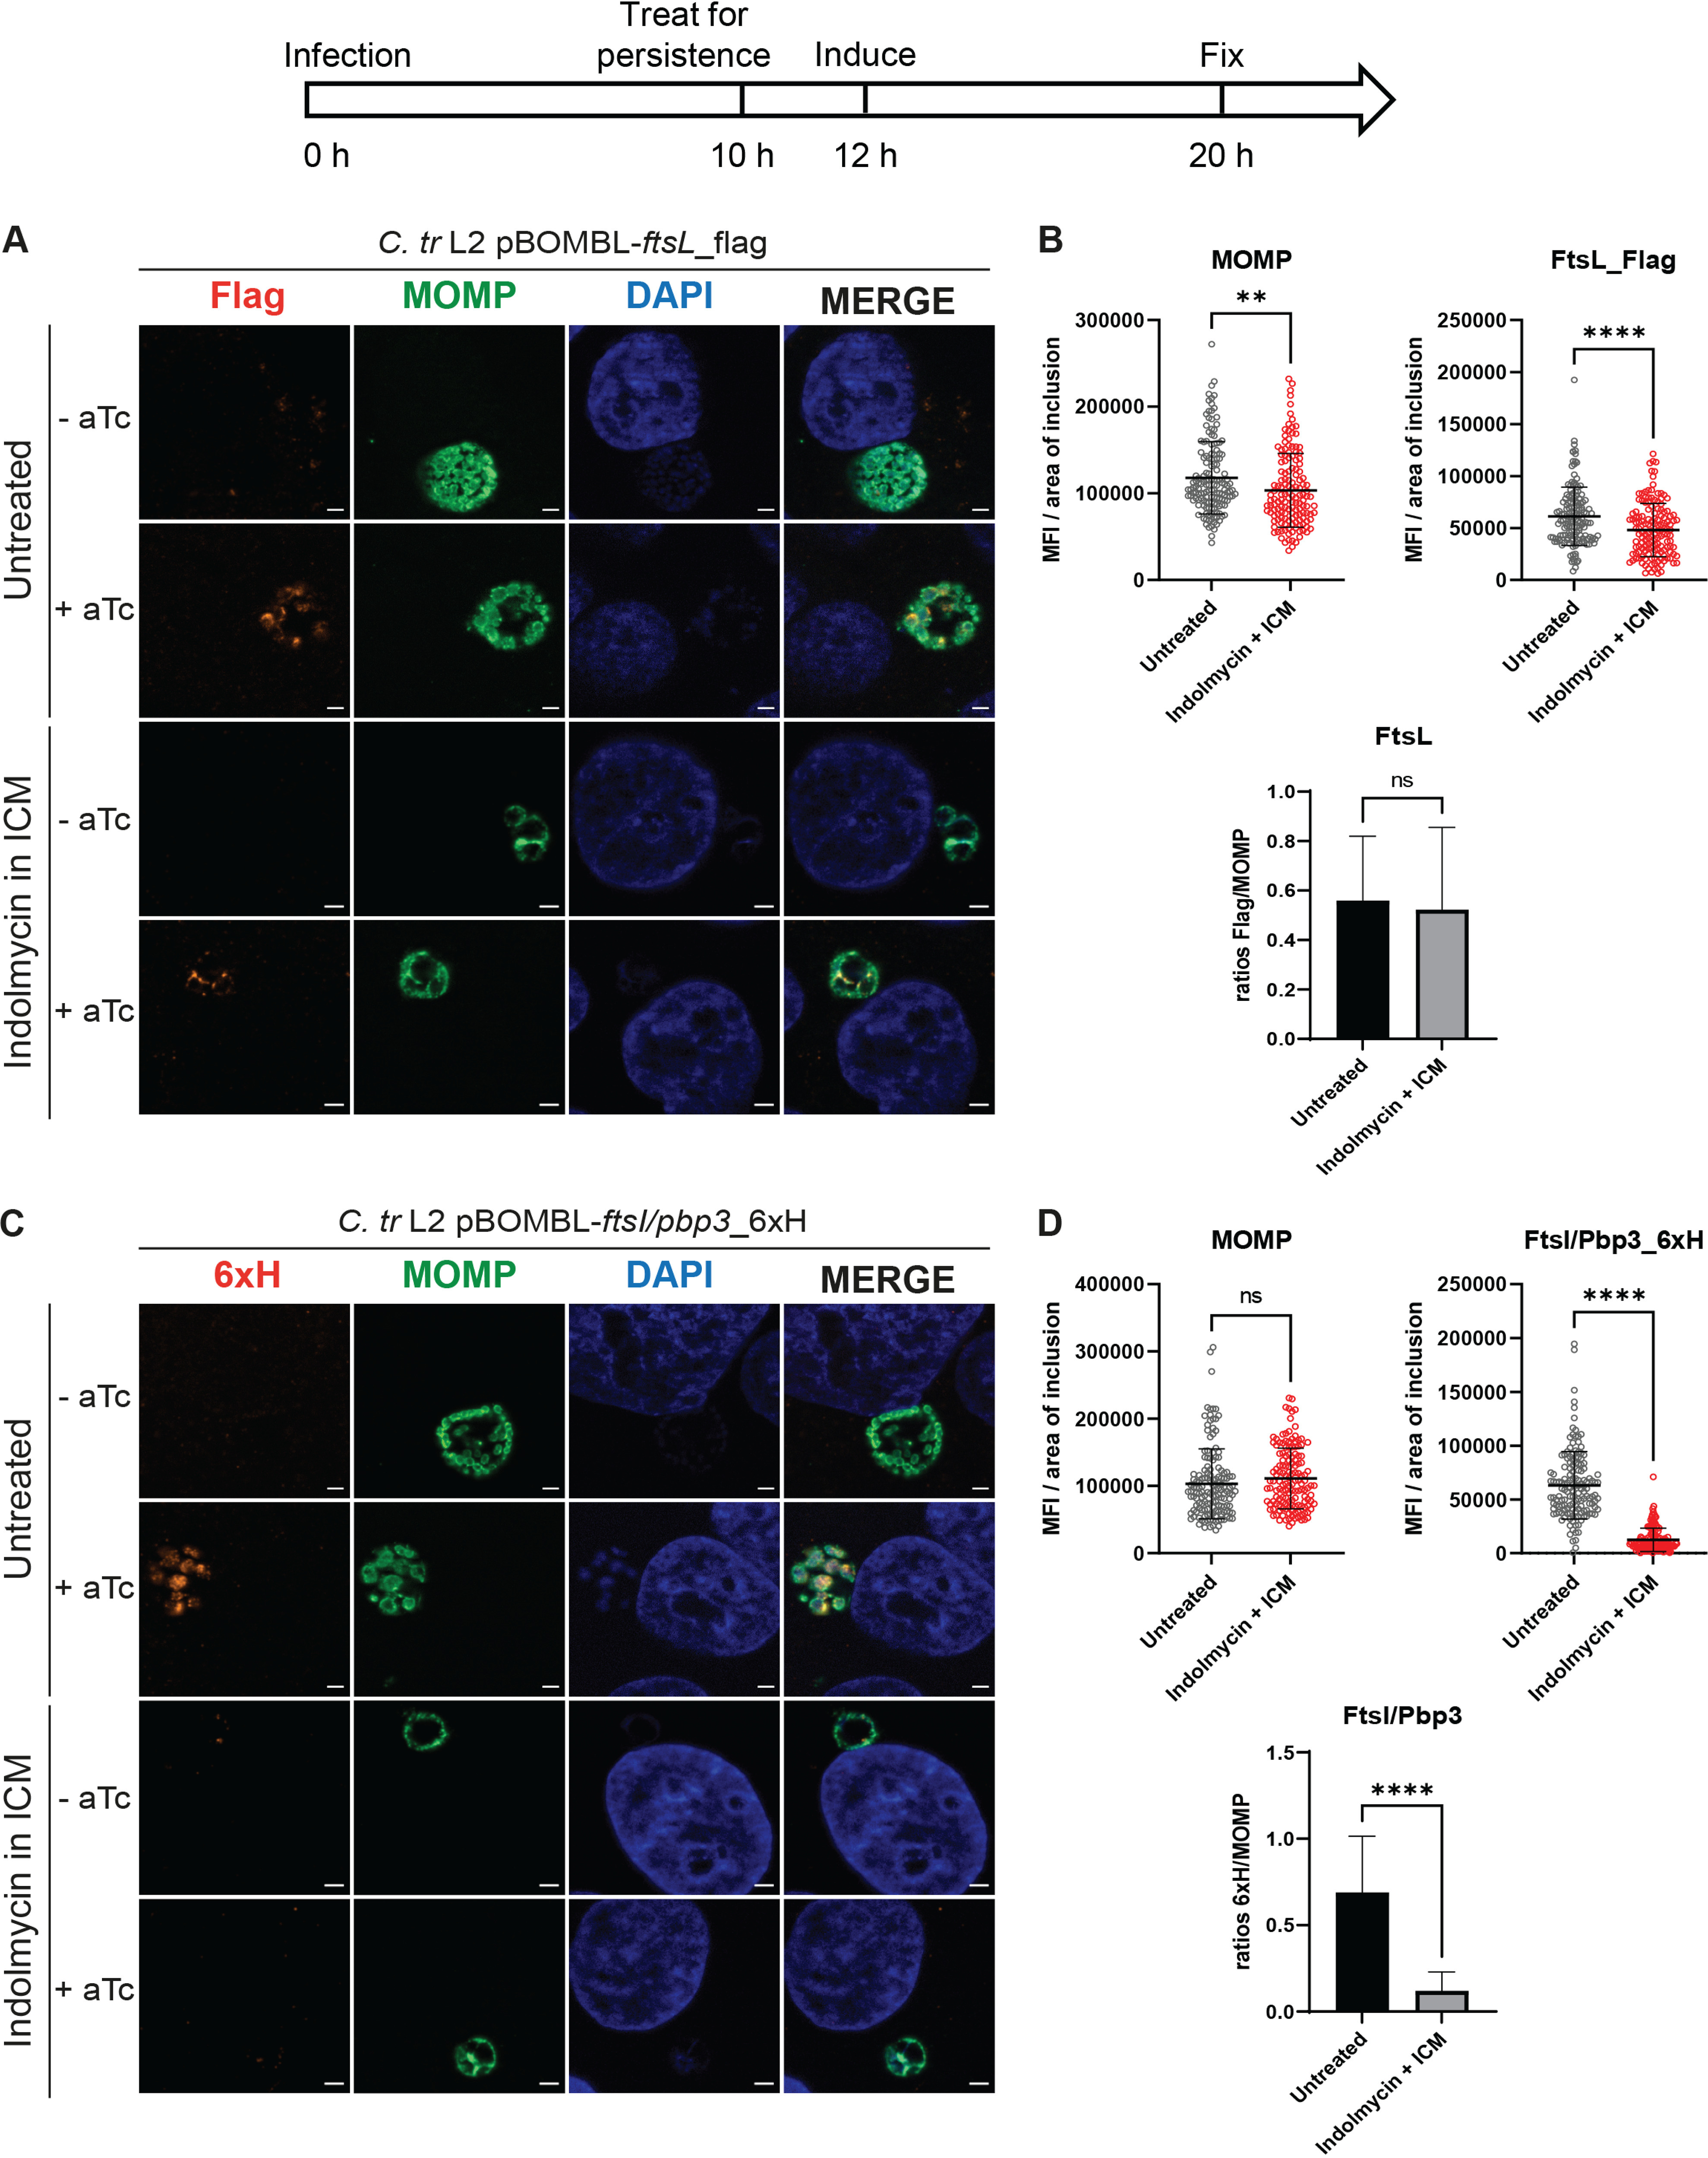
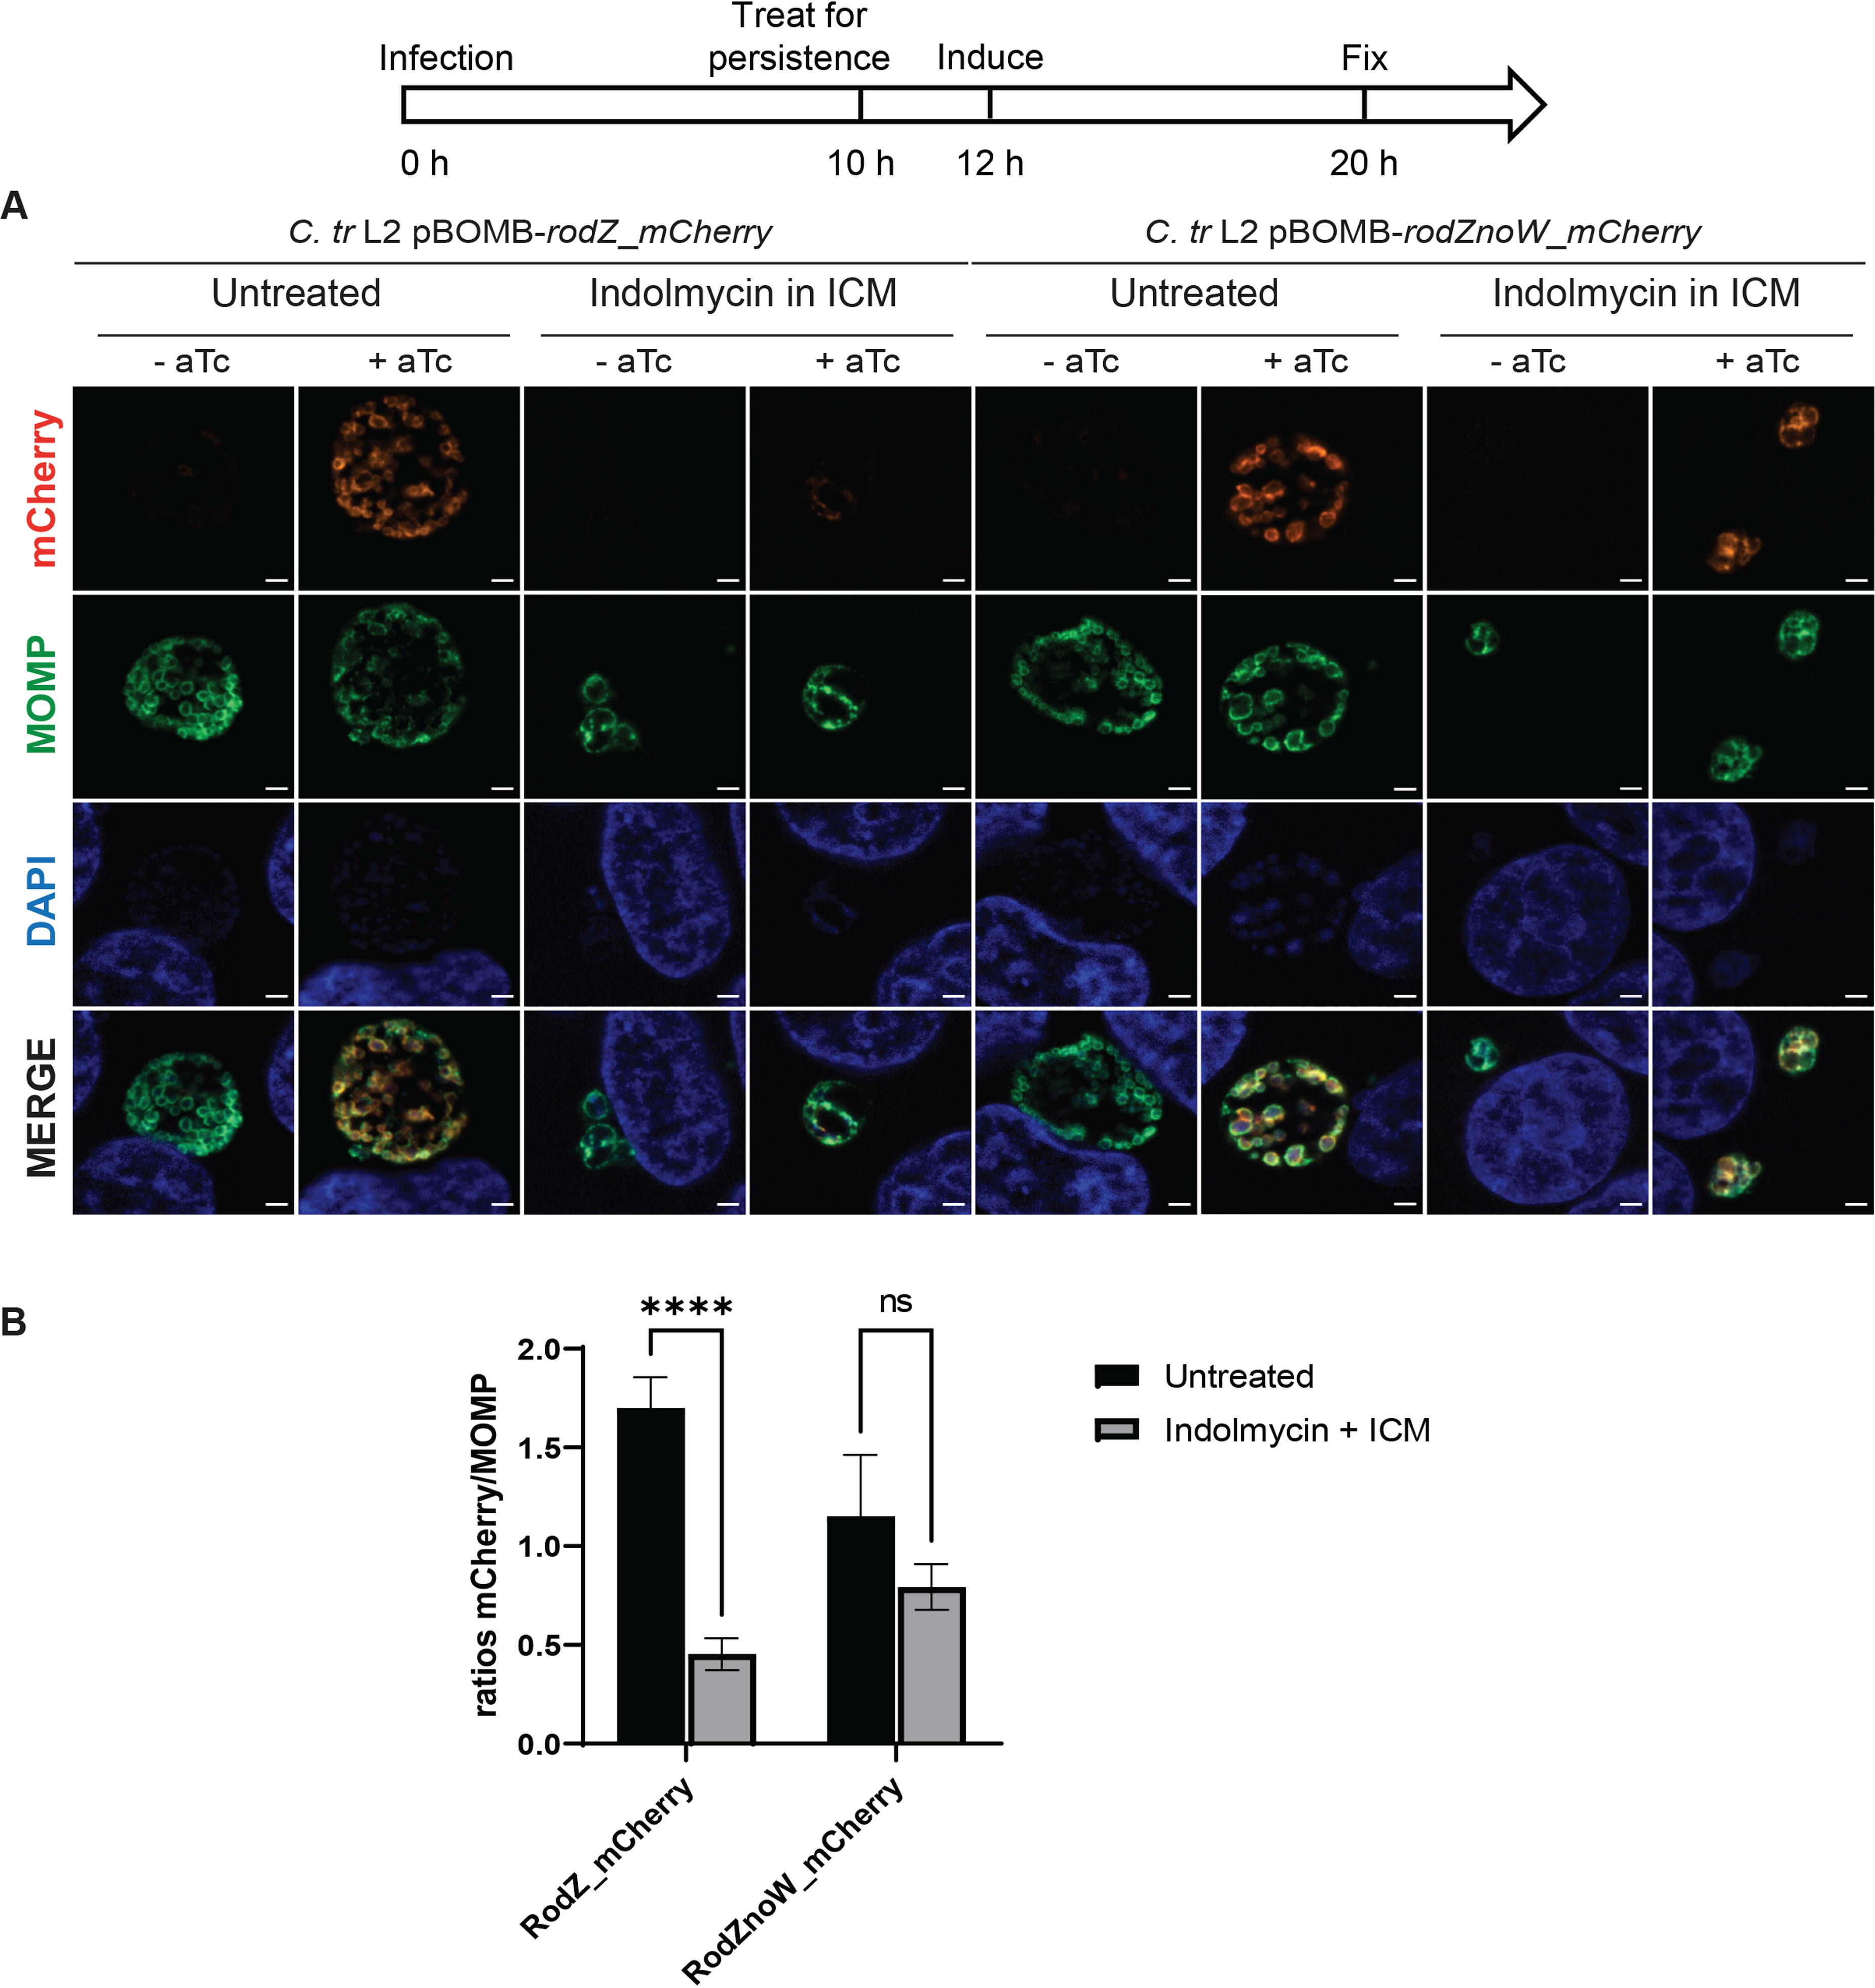
Chlamydia is an obligate intracellular pathogen with a highly reduced genome devoid of major stress response genes like relA and spoT, which mediate the stringent response. Interestingly, as an intracellular bacterium dependent on its host for nutrients and as a tryptophan (Trp) auxotroph, Chlamydia is very sensitive to Trp starvation, which is induced in vivo by the host cytokine interferon-γ. In response to Trp starvation, Chlamydia enters a viable but nonreplicating state called persistence. A major characteristic of chlamydial persistence is a block in cell division. We hypothesized that cell division is blocked during persistence by the inability to translate Trp-rich cell division proteins. To test this, we first investigated the translation of various cell division proteins under Trp starvation conditions using inducible expression strains. We observed that the Trp-poor protein MurG and the Trp-neutral protein FtsL were still expressed during persistence, while the expression of the Trp-rich proteins Pbp2, RodA, FtsI/Pbp3, and MraY was significantly reduced. As proof of concept for our hypothesis, we compared expression of a wild-type and mutant isoform of RodZ in which its four Trp codons were mutated. These experiments demonstrated that decreased expression of RodZ during persistence was reversed when no Trp was present in the protein, thus directly linking its expression to its Trp content. Together, these experiments indicate that specific cell division proteins are not produced during persistence. For the first time, our data provide a mechanism that explains the inhibition of cell division during chlamydial persistence mediated by Trp starvation.

Keywords: Chlamydia; cell division; peptidoglycan; persistence; persister; tryptophan.


Conflict of interest statement

The authors declare no conflict of interest.

Figures

FIG 1
FIG 1
Indolmycin induces morphological changes in C. trachomatis L2. Treatment with indolmycin in IFN-γ-conditioned medium (ICM) results in C. trachomatis L2 persistence. Representative images of HEp-2 cells infected with C. trachomatis L2 and treated or not as indicated and outlined by the diagram are shown. Cells were fixed at 10 hpi or 24 hpi and stained using primary antibodies to the major outer membrane protein (MOMP; green) followed by the appropriate secondary antibody. Nuclear DNA was stained with DAPI (blue). All images were acquired on a Zeiss AxioImager.Z2 equipped with an Apotome2 using a 100× lens objective. Scale bar = 2 μm Treatment of 120 μM indolmycin given at 10 hpi resulted in smaller inclusions and morphologically aberrant organisms.
FIG 2
FIG 2
Pbp2_6×H and RodA_6×H expression is inhibited by persistence mediated by indolmycin in ICM. HEp-2 cells were infected at an MOI of 1 and treated or not as indicated in the diagram. 2 nM aTc was added to induce Pbp2_6×H and RodA_6×H expression. (A and C) Samples were fixed at 20 hpi and processed for immunofluorescence to detect 6×His (red), MOMP (green), and DNA (blue). Scale bar = 2 μm. (B and D) Immunofluorescence images were quantified using Fiji/ImageJ software to determine mean fluorescence intensity (MFI) of MOMP or epitope-tagged protein per area of inclusion and results were graphed and statistically analyzed using GraphPad Prism. Horizontal lines indicate mean and vertical lines indicate standard deviation. Statistical significance was determined by unpaired Student's t test. ns, nonsignificant; ****, P < 0.0001. Data are also expressed as average 6×His/MOMP ratios for both conditions with standard deviation between three independent experiments. Statistical significance was determined by unpaired Student's t test. ****, P < 0.0001.
FIG 3
FIG 3
FtsL_flag expression is unaffected by persistence mediated by indolmycin in ICM while FtsI/Pbp3_6×H expression is inhibited. A diagram representing the experimental design and highlighting important time points is shown. HEp-2 cells were infected at an MOI of 1. Two or 1 nM aTc was added to induce FtsL_flag and FtsI/Pbp3_6×H expression, respectively. (A and C) Samples were fixed at 20 hpi and processed for immunofluorescence to detect flag (FtsL construct; red), 6×His (FtsI/Pbp3 construct, red), MOMP (green), and DNA (blue). Scalebar = 2 μm. (B and D) Immunofluorescence images were quantified using Fiji/ImageJ software to determine MFI of MOMP or epitope-tagged protein per area of inclusion and results were graphed and statistically analyzed using GraphPad Prism. Horizontal lines indicate mean and vertical lines indicate standard deviation. Statistical significance was determined by unpaired Student's t test. ns, nonsignificant; **, P < 0.01; ****, P < 0.0001. Data are also expressed as average flag/MOMP and 6×His/MOMP ratios for both conditions with standard deviation between three independent experiments. Statistical significance was determined by unpaired Student's t test. ns, nonsignificant; ****, P < 0.0001.
FIG 4
FIG 4
Expression of the WW-containing protein MraY_6×H is inhibited by indolmycin-mediated persistence while the expression of the Trp-poor protein MurG_6×H is maintained. A diagram representing the experimental design and highlighting important time points is shown. HEp-2 cells were infected at an MOI of 1. Two or 1 nM aTc was added to induce MraY_6×H and MurG_6×H expression, respectively. (A and C) Samples were fixed at 20 hpi and processed for immunofluorescence to detect 6×His (red), MOMP (green), and DNA (blue). Scale bar = 2 μm. (B and D) Immunofluorescent images were quantified using Fiji/ImageJ software to determine MFI of MOMP or epitope-tagged protein per area of inclusion and results were graphed and statistically analyzed using GraphPad Prism. Horizontal lines indicate mean and vertical lines indicate standard deviation. Statistical significance was determined by unpaired Student's t test. ns, nonsignificant; ****, P < 0.0001. Data are also expressed as average 6×His/MOMP ratios for both conditions with standard deviation between three independent experiments. Statistical significance was determined by unpaired Student's t test. ns, nonsignificant; ****, P < 0.0001.
FIG 5
FIG 5
Expression of RodZ upon Trp starvation mediated by indolmycin is dependent on the Trp content of RodZ. A diagram representing the experimental design and highlighting important time points is shown. HEp-2 cells were infected at an MOI of 1. A total of 0.5 nM aTc was added to induce RodZ_mCherry and RodZnoW_mCherry expression. (A) Samples were fixed at 20 hpi and processed for immunofluorescence to detect mCherry (red), MOMP (green), and DNA (blue). Scale bar = 2 μm. (B) Immunofluorescent images were quantified using Fiji/ImageJ software to determine MFI of MOMP or mCherry fused protein per area of inclusion and results were graphed and statistically analyzed using GraphPad Prism. Data are expressed as average mCherry/MOMP ratios for both conditions with standard deviation between three independent experiments. Statistical significance was determined by two-way ANOVA test with multiple comparisons. ns, nonsignificant; ****, P < 0.0001.
FIG 6
FIG 6
Polarity of Cls localization is maintained during persistence. The diagram represents the experimental design, including important time points at which Cls_6×H expression was induced relative to treatment with indolmycin. Representative images are shown of HEp-2 cells infected with C. trachomatis L2 transformed with pBOMB-cls_6×H and treated or not as indicated. Cls_6×H expression was induced at 4 hpi (t1) or 12 hpi (t2) with 5 nM aTc. Cells were fixed at 16 hpi and processed for immunofluorescence to detect 6×His (red), MOMP (green), and DNA (blue). Scale bar = 2 μm.
FIG 7
FIG 7
Model of Trp-dependent chlamydial division inhibition during persistence mediated by Trp starvation. (Left) Under normal growth, when Trp is available in the environment, ribosomes are able to translate the chlamydial divisome components (53) and the PG synthesis proteins necessary to chlamydial division and growth. (Right) Under Trp starvation mediated by indolmycin, the ribosome stalling at the WW (or WAW) motifs and the reduced translation affect the translation of the chlamydial cell division and PG synthesis proteins depending on their overall Trp content. In this scenario, only MurG and FtsL are made. Further based on our supporting data, we hypothesize that FtsB (putative), MurJ, and MreC expression would also be decreased during persistence. Similarly, we predict that the low Trp content of FtsQ, FtsW, FtsK, and MreB proteins suggest that these proteins would be expressed during persistence. Overall, the inability to produce key divisome components and PG synthesis proteins leads to a block of chlamydial division during Trp starvation-induced persistence. Some elements in this figure were adapted from (53).

References

    1. Balaban NQ, Helaine S, Lewis K, Ackermann M, Aldridge B, Andersson DI, Brynildsen MP, Bumann D, Camilli A, Collins JJ, Dehio C, Fortune S, Ghigo J-M, Hardt W-D, Harms A, Heinemann M, Hung DT, Jenal U, Levin BR, Michiels J, Storz G, Tan M-W, Tenson T, Van Melderen L, Zinkernagel A. 2019. Definitions and guidelines for research on antibiotic persistence. Nat Rev Microbiol 17:441–448. 10.1038/s41579-019-0196-3. - DOI - PMC - PubMed
    1. Ward ME. 1983. Chlamydial classification, development and structure. Br Med Bull 39:109–115. 10.1093/oxfordjournals.bmb.a071800. - DOI - PubMed
    1. Hatch TP, Allan I, Pearce JH. 1984. Structural and polypeptide differences between envelopes of infective and reproductive life cycle forms of Chlamydia spp. J Bacteriol 157:13–20. 10.1128/jb.157.1.13-20.1984. - DOI - PMC - PubMed
    1. Hackstadt T, Baehr W, Ying Y. 1991. Chlamydia trachomatis developmentally regulated protein is homologous to eukaryotic histone H1. Proc Natl Acad Sci USA 88:3937–3941. 10.1073/pnas.88.9.3937. - DOI - PMC - PubMed
    1. AbdelRahman YM, Belland RJ. 2005. The chlamydial developmental cycle. FEMS Microbiol Rev 29:949–959. 10.1016/j.femsre.2005.03.002. - DOI - PubMed

Publication types