. 2023 Jan 16:12:e81779.
doi: 10.7554/eLife.81779.

MCT1-dependent energetic failure and neuroinflammation underlie optic nerve degeneration in Wolfram syndrome mice

Affiliations

MCT1-dependent energetic failure and neuroinflammation underlie optic nerve degeneration in Wolfram syndrome mice

Greta Rossi et al. Elife. .

Abstract

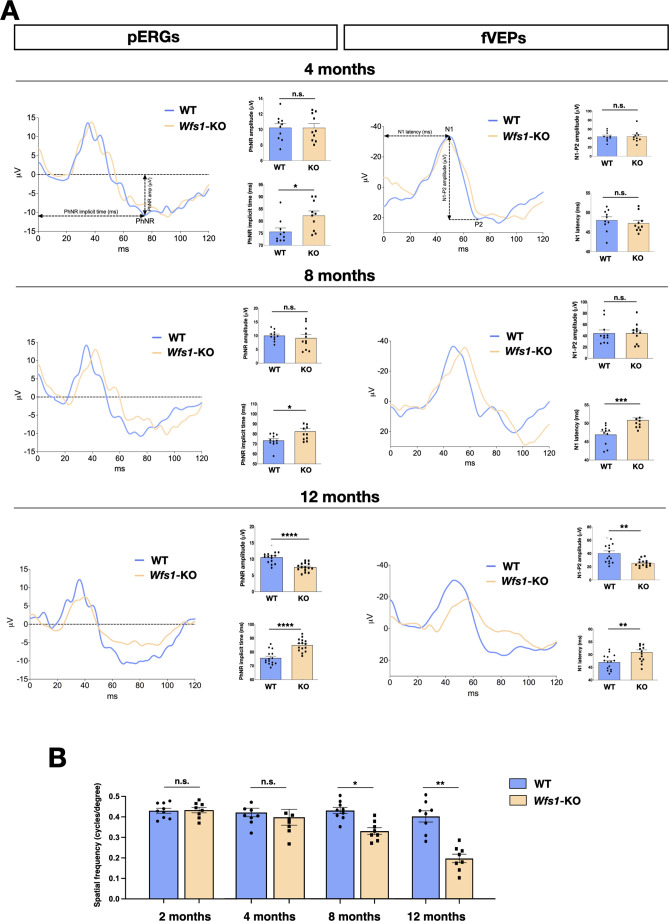
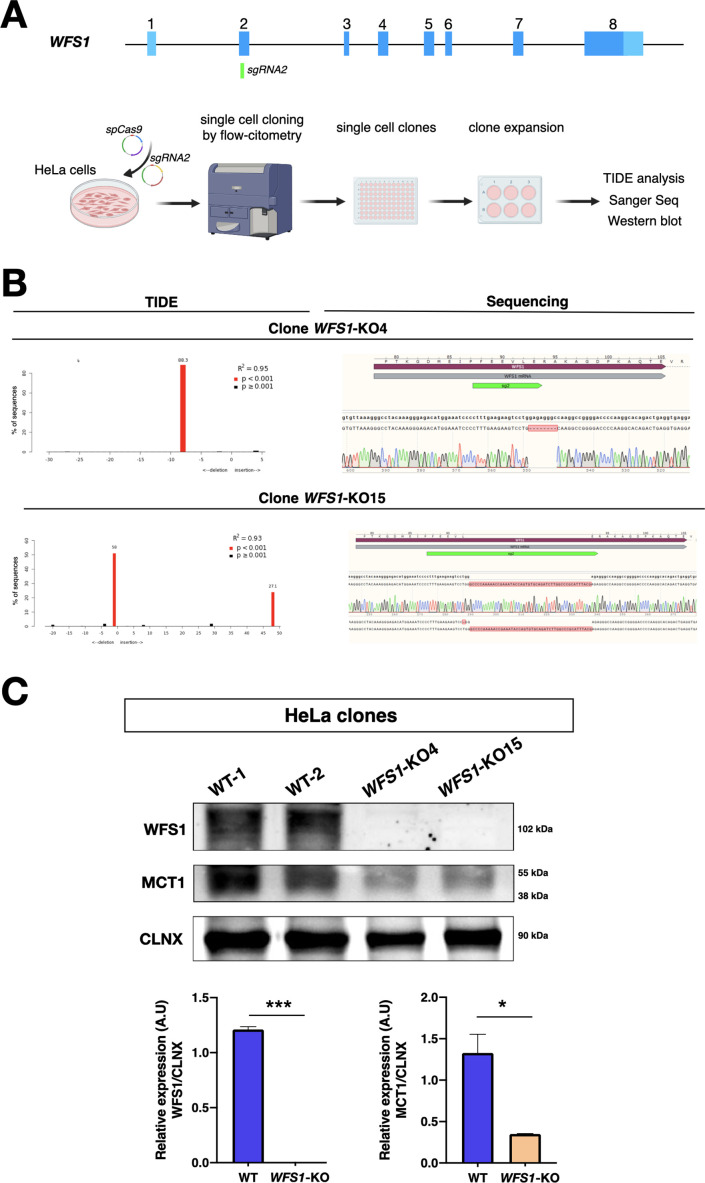
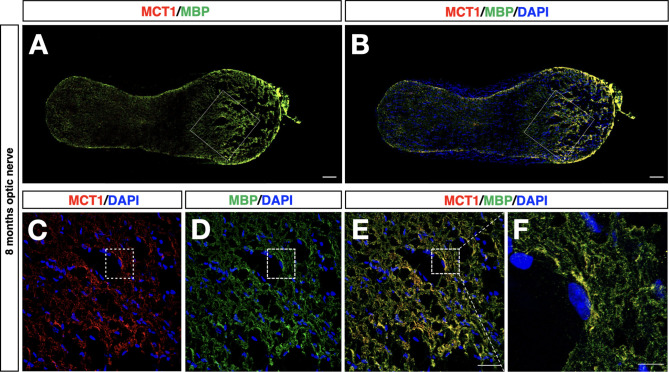
Wolfram syndrome 1 (WS1) is a rare genetic disorder caused by mutations in the WFS1 gene leading to a wide spectrum of clinical dysfunctions, among which blindness, diabetes, and neurological deficits are the most prominent. WFS1 encodes for the endoplasmic reticulum (ER) resident transmembrane protein wolframin with multiple functions in ER processes. However, the WFS1-dependent etiopathology in retinal cells is unknown. Herein, we showed that Wfs1 mutant mice developed early retinal electrophysiological impairments followed by marked visual loss. Interestingly, axons and myelin disruption in the optic nerve preceded the degeneration of the retinal ganglion cell bodies in the retina. Transcriptomics at pre-degenerative stage revealed the STAT3-dependent activation of proinflammatory glial markers with reduction of the homeostatic and pro-survival factors glutamine synthetase and BDNF. Furthermore, label-free comparative proteomics identified a significant reduction of the monocarboxylate transport isoform 1 (MCT1) and its partner basigin that are highly enriched on retinal glia and myelin-forming oligodendrocytes in optic nerve together with wolframin. Loss of MCT1 caused a failure in lactate transfer from glial to neuronal cell bodies and axons leading to a chronic hypometabolic state. Thus, this bioenergetic impairment is occurring concurrently both within the axonal regions and cell bodies of the retinal ganglion cells, selectively endangering their survival while impacting less on other retinal cells. This metabolic dysfunction occurs months before the frank RGC degeneration suggesting an extended time-window for intervening with new therapeutic strategies focused on boosting retinal and optic nerve bioenergetics in WS1.

Keywords: astrocytes; developmental biology; eye; glial cell; mouse; retinal development.


Conflict of interest statement

GR, GO, NV, VC, AI, DD, EB, LB, SG, ML, SM, LL, PM, VB No competing interests declared

Figures

Figure 1.
Figure 1.. Wfs1 mutant mice show progressive and severe impairment of visual activity.
(A) Representative pERG and fVEP waveforms at 4, 8, and 12 months of age in wild-type (WT) and Wfs1 mutant (KO) animals. PhNR amplitude and implicit time are quantified by ERG measurements (n=15, *p<0.05; **p<0.01; ***p<0.001, Student t-test). Data are presented as mean ± SEM. N1 latency and N1-P2 amplitude quantifications are calculated from the fVEP traces (n=15, *p<0.05; **p<0.01; ***p<0.001, Welch’s t-test for N1-P2 amplitude and Student t-test for N1 latency). Data are presented as mean ± SEM. (B) Quantification of visual acuity measuring the opto-motor reflex expressed as cycles per degree in 2, 4, 8, and 12 months old wild-type (WT) and Wfs1 mutant (KO) mice (n=8, *p<0.05; **p<0.01; **p<0.001; ****p<0.0001). Data are presented as mean ± SEM.
Figure 1—figure supplement 1.
Figure 1—figure supplement 1.. Characterization of eye morphology in Wfs1 mutant mice.
(A,B) Representative images from fundus oculi, OCT, layer analysis and fluorescein angiography (FA) in wild-type (WT) and Wfs1 mutant mice at 8 months of age. (C) Quantification of RNFL thickness expressed in μm in 8 month (n=12, p=0.73, unpaired t-test, top) or 12 month (n=3, p=0.90, unpaired t-test, bottom) old animals. (D) Representative image of Wfs1 mutant mouse eye with diffuse cataract and corneal haze.
Figure 2.
Figure 2.. Progressive demyelination in the Wfs1 mutant optic nerves.
(A) Representative EM images of optic nerve cross-sections of wild-type (WT) and Wfs1 mutant mice at 8 months of age showing increased space among the axons (red asterisks). Quantifications of the g-ratio (n=193, *p<0.05, unpaired t-test), total number of axons (n=34), myelin (n=29) and empty areas (n=29) normalized by total area (n=29) (**p<0.01; ***p<0.001, two-way ANOVA with Bonferroni’s post-hoc test). Data are presented as mean ± SEM. (B) Representative EM images of optic nerve cross-sections of wild-type (WT) and Wfs1 mutant mice at 12 months of age showing dramatic expansion of space among the axons (red asterisks). Quantifications of the g-ratio (n=192, *p<0.05, unpaired t-test), total number of axons (n=29), myelin (n=27) and empty areas (n=27) normalized by total area (n=27) (***p<0.001, two-way ANOVA with Bonferroni’s post-hoc test). Data are presented as mean ± SEM. (C) Representative immunohistochemical images of retinal cross-sections of wild-type (WT) and Wfs1 mutant (KO) animals at 8 and 12 months of age with RBPMS and DAPI staining in purple and blue, respectively. Relative quantification of RBPMS positive cells over total cell number in the GCL at 8 months (n=9, p=0.39, two-tails unpaired t-test) and at 12 months (n=8, **p<0.01, two-tails unpaired t-test). Scale bar: 50 µm.
Figure 3.
Figure 3.. Transcriptome analysis of Wfs1 mutant and control retinas.
(A) Whole-transcriptome analysis using the t-Distributed Stochastic Neighbor Embedding (t-SNE) analysis with a view of the sample distribution along the first two dimensions. (B) Significantly up- (red) and down- (blue) regulated genes among the transcriptomic profiles of the samples, shown as highlighted dots in the MA plots. Number of differentially expressed genes (DEGs) (up = 218; down = 178). (C) GO-term categories relative to transcriptional analysis, as in RNA-seq dataset calculated in the list of genes downregulated in Wfs1 mutant retinas. (D) Heatmap showing genes normalized count RPKM associated with inflammatory pathways. (E) Boxplot depicting the distribution of gene expression levels, confirming their trends in RNAseq. (n=3 *p<0.05; **p<0.01; ***p<0.001, Student t-test).
Figure 4.
Figure 4.. Representative immunohistochemical analysis in wild-type and Wfs1 mutant retinal tissues at 8 and 12 months of age.
(A) Representative images and relative quantification of ATF6 and CHOP immunofluorescence signal in wild-type (WT) and Wfs1 mutant (KO) retinas at 8 months of age. On the right, quantification of the signal (n=5, ATF6; n=12, CHOP, **p<0.01, Student t-test). Data are presented as mean ± SEM. Scale bar: 100 µm. (B) Representative images of GFAP immunofluorescence in 8- and 12-month-old retinas. On the right, quantification of the signal (n=5, 8 months; n=13, 12 months, **p<0.01, Student t-test). Data are presented as mean ± SEM. Scale bar: 100 µm. (C) Representative images of Vimentin (VIM) immunofluorescence in 8- and 12-month-old retinas. On the right, quantification of the signal intensity of VIM in wild-type (WT) and Wfs1 mutant (KO) retinas. (n=5, *p<0,05, **p<0.01, Student t-test). Data are presented as mean ± SEM. Scale bar: 100 µm. (D) Representative images and relative quantification of the glutamine synthetase (GS) immunofluorescence signal in wild-type (WT) and Wfs1 mutant (KO) retinas at 8 and 12 months. Data are presented as mean ± SEM. (n=3, **p<0.01, Student t-test). Scale bar: 100 µm.
Figure 5.
Figure 5.. Impaired signal transducer and activator of transcription 3 (STAT3) signaling in Wfs1 mutant mice.
(A) Representative immunoblotting of pSTAT3 and total STAT3 endogenous protein levels in adult retinae from WT and Wfs1 KO mice at 12 months of age. The ratio of p-STAT3 versus total signal transducer and activator of transcription 3 (STAT3) is shown in the graph after normalization over the respective protein load (actin). Quantification of pSTAT3/STAT3 protein signal intensity was performed in 12 months mice retinae (eyes from n=3 animals, *p<0.05; **p<0.01, Student t-test). Data are presented as mean ± SEM. (B) Boxplot depicting the distribution of expression levels of STAT3 regulated genes (p<0.05; **p<0.01; ***p<0.001, Student t-test).
Figure 6.
Figure 6.. Wfs1 mutant retinas show altered MCT1, MCT2 and basigin protein levels.
(A) Schematic representation of the label-free LC-MS comparative proteomics approach used to analyze three set of retinae tissue samples from WT and Wfs1 mutant mice at 8 months of age. Proteomics analysis of biological replicates for each of biological conditions identified 2046 total proteins. (B) Differentially expressed proteins comparing wild-type (WT) and Wfs1 mutant (KO) mice at 8 months with p-value more significant than 0.05. The positive/red and negative/blue values indicate proteins with levels higher in KO or WT conditions, respectively. (C) Representative Western blot images and analysis of basigin, MCT1 and MCT2 signals in 5- and 8 months mice WT and Wsf1 KO retinas with their relative quantifications. Calnexin (CLNX) was used as loading control. Data are presented as mean ± SEM (Student t-test, *p<0.05; **p<0.01). (D) Representative immunoblots and their relative quantifications for MCT1 protein levels in brain cortical and striatal samples in 8 months old wild-type (WT) and Wfs1-KO animals. Calnexin (CLNX) was used as loading control. Data are presented as mean ± SEM (Student t-test, *p<0.05). (E) Representative IP analysis from HEK293T transfected cells with the indicated constructs: Wfs1-mCherry and Mct1-V5. RFP-immunoprecipitation was performed, and blot revealed for RFP and V5, showing the proposed interaction between wolframin and MCT1 in co-transfected condition.
Figure 6—figure supplement 1.
Figure 6—figure supplement 1.. General analysis of the proteomics output and identified proteins.
(A) Virtual 2D maps, based on theroretical MW and pI of proteins. Color/shape code is assigned to each protein according to the corresponding PSM value; PSM = 1,>1 and<5, and >5 are depicted in yellow/triangle, blue/square, and red/circles, respectively. (B) Venn diagram of identified protein in wild-type (WT) and Wfs1 mutant (KO) retinal samples. The area of intersection is related to shared proteins.
Figure 6—figure supplement 2.
Figure 6—figure supplement 2.. MCT1 protein loss in WFS1 mutant HeLa cell clones.
(A) Top: illustration of the human WFS1 genomic locus and relative position of the sgRNA2. Bottom: schematic outline of the strategy for targeting exon 2 of the WFS1 gene in HeLa cells by CRISPR/Cas9. (B) Tide analysis and relative Sanger sequencing of the two WFS1 mutant HeLa cell clones (KO4 and KO15). (C) Representative western blot images of WFS1 and MCT1 protein levels in WFS1 mutant and control HeLa cell lines and their relative quantifications. Data are presented as mean ± SEM (Student t-test, *p<0.05; ***p<0.001, Student t-test).
Figure 7.
Figure 7.. Metabolic alterations in Wfs1 mutant retinas and optic nerves caused by MCT1 downregulation.
(A) Umap of the GSE153673 dataset of scRNA-seq of wild-type (WT) mouse retina showing in the first panel the main cell type composition colored by cluster followed by feature plots colored by expression level of the genes of interest (log2 expression). (B) Representative western blot showing wolframin and MCT1 protein levels in wild-type (WT) murine retinal, optic nerve, and brain lysates. Actin was used as loading control. (C) Representative image of colocalization of WFS1 (red) and MBP1 (green) in WT mice optic nerve section. Scale bar: 10 µm. (D, E) Quantification of lactate (D) and ATP (E) in WT and Wfs1 KO mice retinae and optic nerve shows an increase of lactate level and a reduction of ATP level in Wfs1 KO mice, respectively. Data are presented as mean ± SEM. (*p<0.05; **p<0.01, Student t-test). (F) Illustration of the key role of wolframin in maintaining physiological levels of MCT1 on glial cells to support the correct transfer of energy metabolites in retina and optic nerve. In Wfs1 mutant retina and optic nerve, MCT1 loss results in a concomitant accumulation of lactate and loss of ATP with compensatory increased levels of MCT2 on neuronal cell bodies and axons.
Figure 7—figure supplement 1.
Figure 7—figure supplement 1.. MCT1 protein localization in the mouse optic nerve.
(A,B) Low-magnification images of adult mouse optic nerve longitudinal sections immunostained for MCT1 and MBP. Scale bars: 100 µm. (C–F) High-power images of adult mouse optic nerve tissue immunodecorated for MCT1 and MPB showing a significant co-localization between the two stainings. Image in F is a higher magnification image of the dashed squares in C-E for highlighting MCT1 and MBP intracellular co-localization. Scale bars: (C–E) 50 µm; (F), 10 µm.

References

    1. Andres Benito P, Dominguez Gonzalez M, Ferrer I. Altered gene transcription linked to astrocytes and oligodendrocytes in frontal cortex in Creutzfeldt-Jakob disease. Prion. 2018;12:216–225. doi: 10.1080/19336896.2018.1500076. - DOI - PMC - PubMed
    1. Angebault C, Fauconnier J, Patergnani S, Rieusset J, Danese A, Affortit CA, Jagodzinska J, Mégy C, Quiles M, Cazevieille C, Korchagina J, Bonnet-Wersinger D, Milea D, Hamel C, Pinton P, Thiry M, Lacampagne A, Delprat B, Delettre C. ER-mitochondria cross-talk is regulated by the ca2+ sensor NCS1 and is impaired in wolfram syndrome. Science Signaling. 2018;11:eaaq1380. doi: 10.1126/scisignal.aaq1380. - DOI - PubMed
    1. Barboni P, Amore G, Cascavilla ML, Battista M, Frontino G, Romagnoli M, Caporali L, Baldoli C, Gramegna LL, Sessagesimi E, Bonfanti R, Romagnoli A, Scotti R, Brambati M, Carbonelli M, Starace V, Fiorini C, Panebianco R, Parisi V, Tonon C, Bandello F, Carelli V, La Morgia C. The pattern of retinal ganglion cell loss in Wolfram syndrome is distinct from mitochondrial optic neuropathies. American Journal of Ophthalmology. 2022;241:206–216. doi: 10.1016/j.ajo.2022.03.019. - DOI - PubMed
    1. Barrett TG, Bundey SE, Macleod AF. Neurodegeneration and diabetes: UK nationwide study of wolfram (DIDMOAD) syndrome. Lancet. 1995;346:1458–1463. doi: 10.1016/s0140-6736(95)92473-6. - DOI - PubMed
    1. Beard E, Lengacher S, Dias S, Magistretti PJ, Finsterwald C. Astrocytes as key regulators of brain energy metabolism: new therapeutic perspectives. Frontiers in Physiology. 2022;12:825816. doi: 10.3389/fphys.2021.825816. - DOI - PMC - PubMed

Publication types

Substances

Associated data

Grants and funding

LinkOut - more resources