. 2023 Jan 16:12:e83639.
doi: 10.7554/eLife.83639.

A hierarchy of cell death pathways confers layered resistance to shigellosis in mice

Affiliations

A hierarchy of cell death pathways confers layered resistance to shigellosis in mice

Justin L Roncaioli et al. Elife. .

Abstract

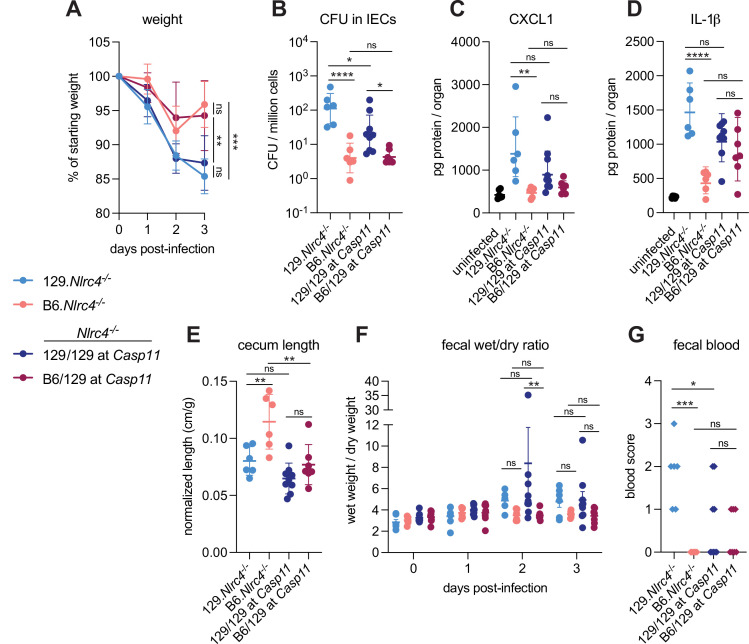
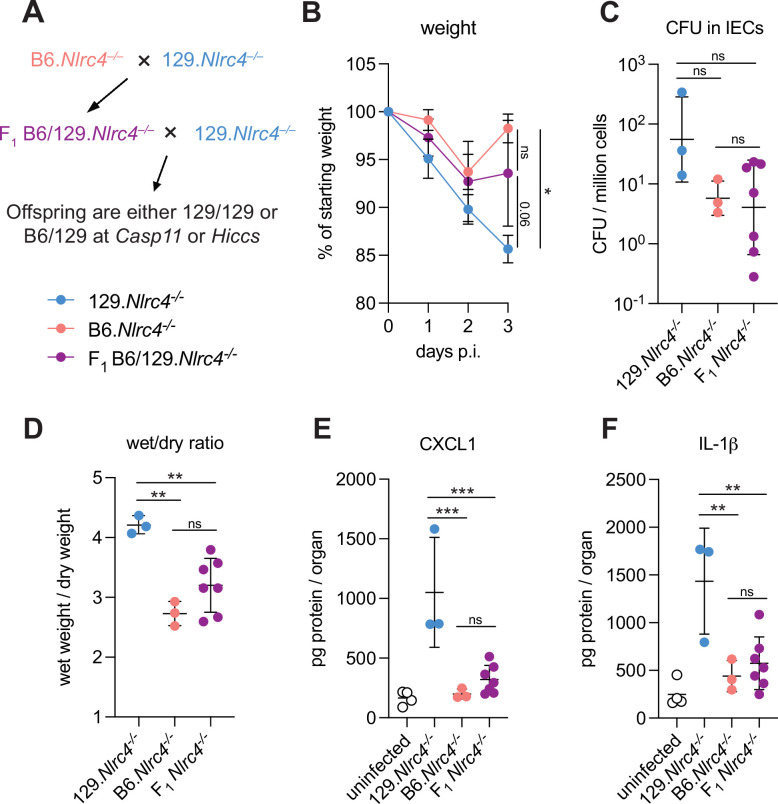
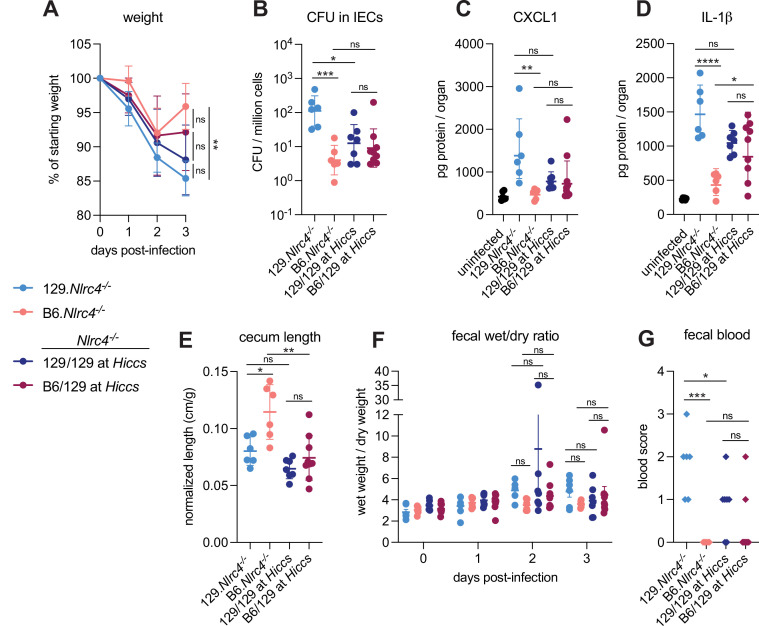
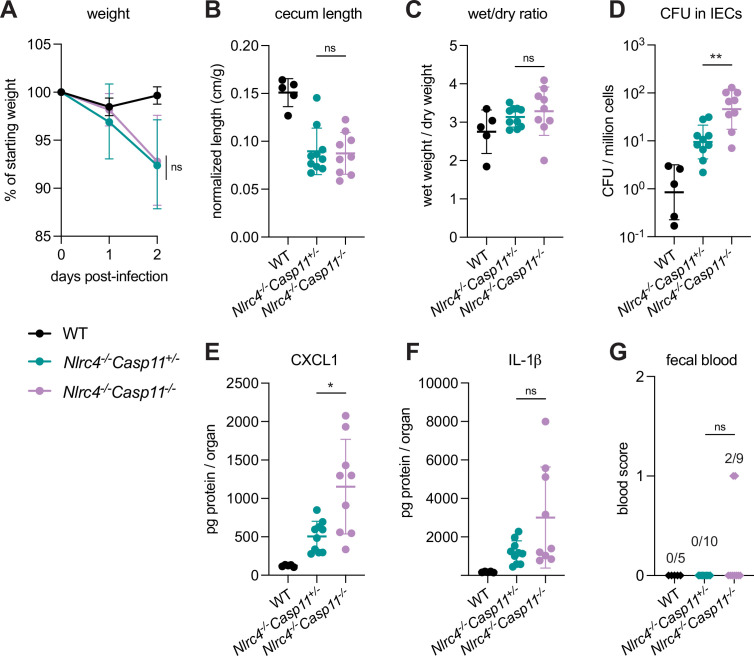
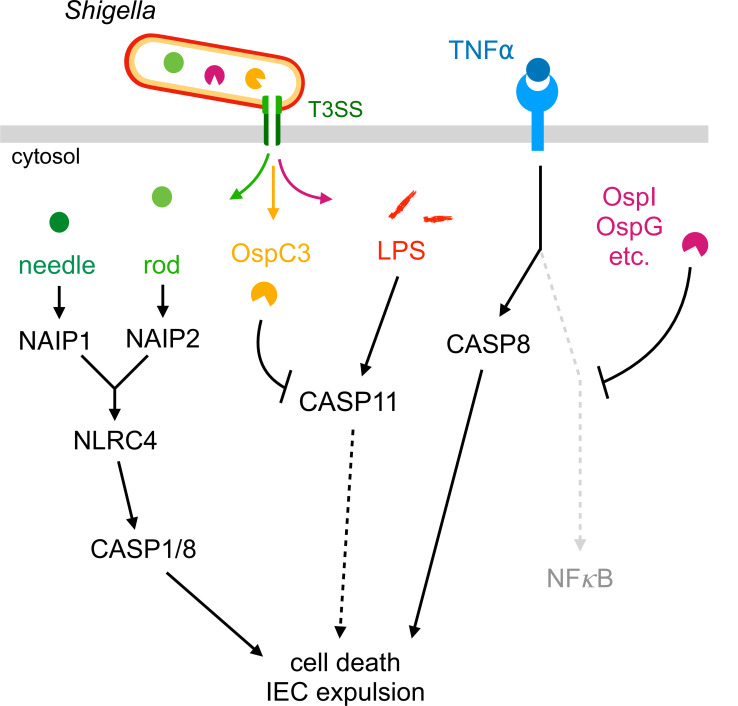
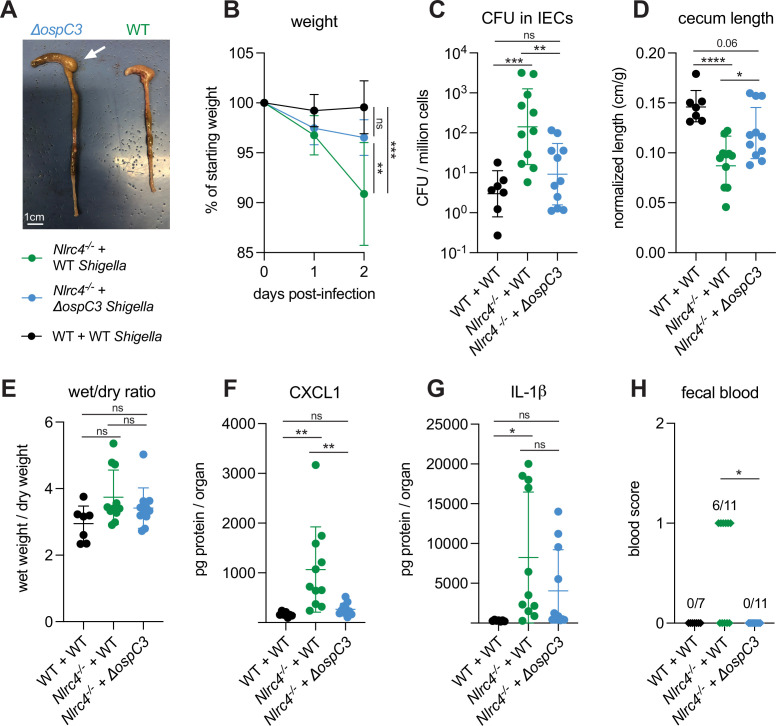
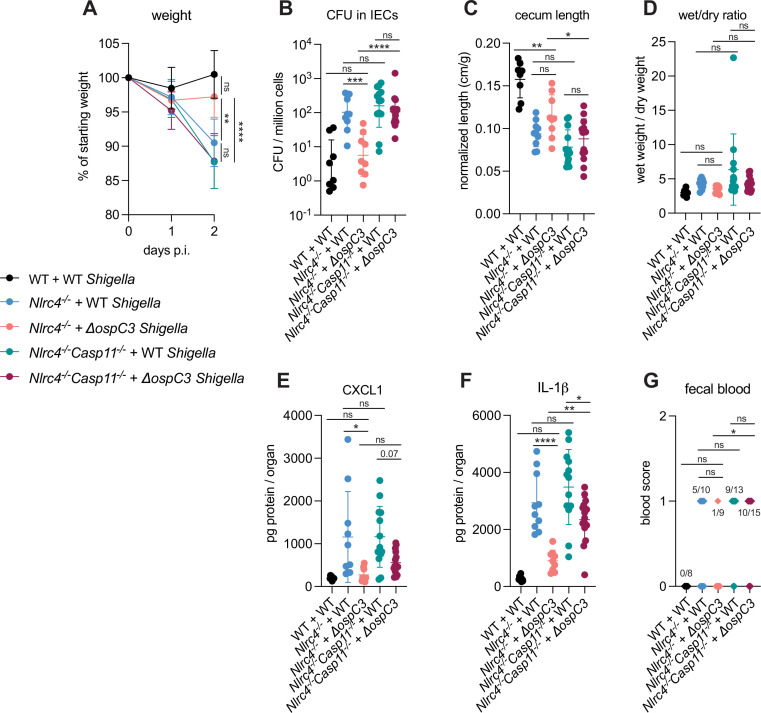
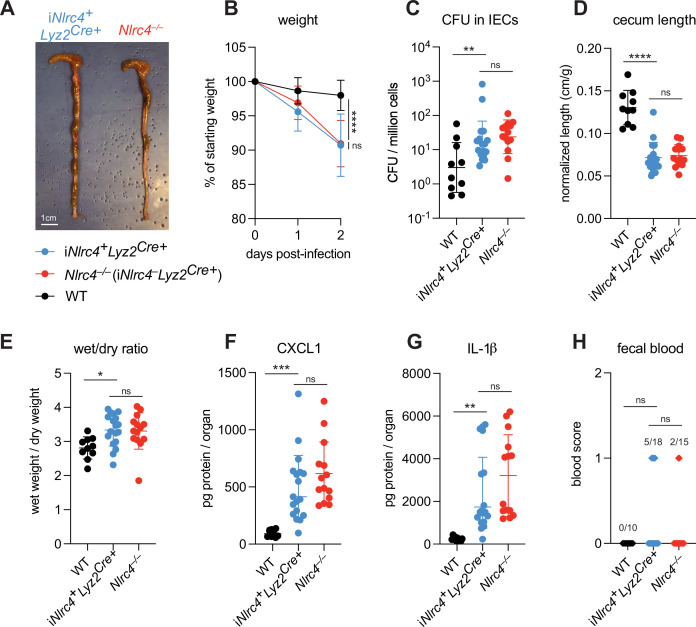
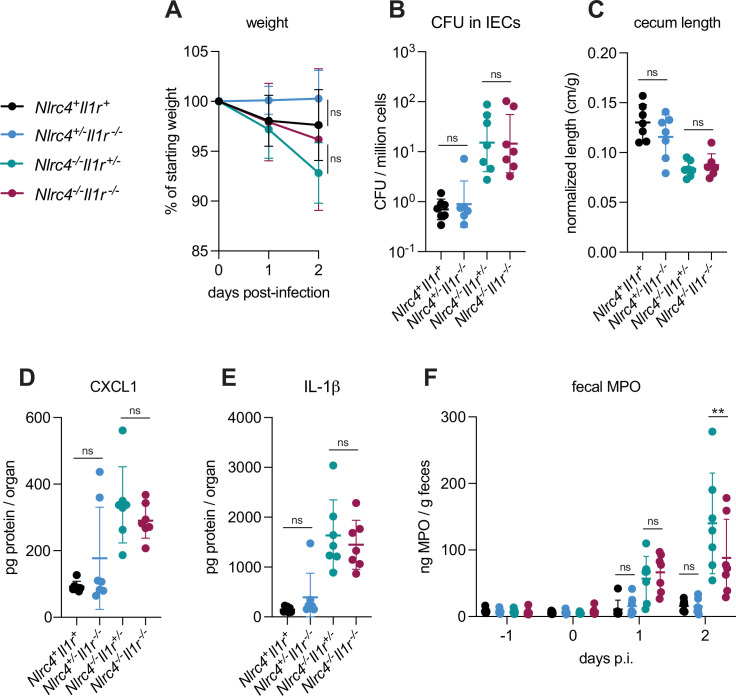
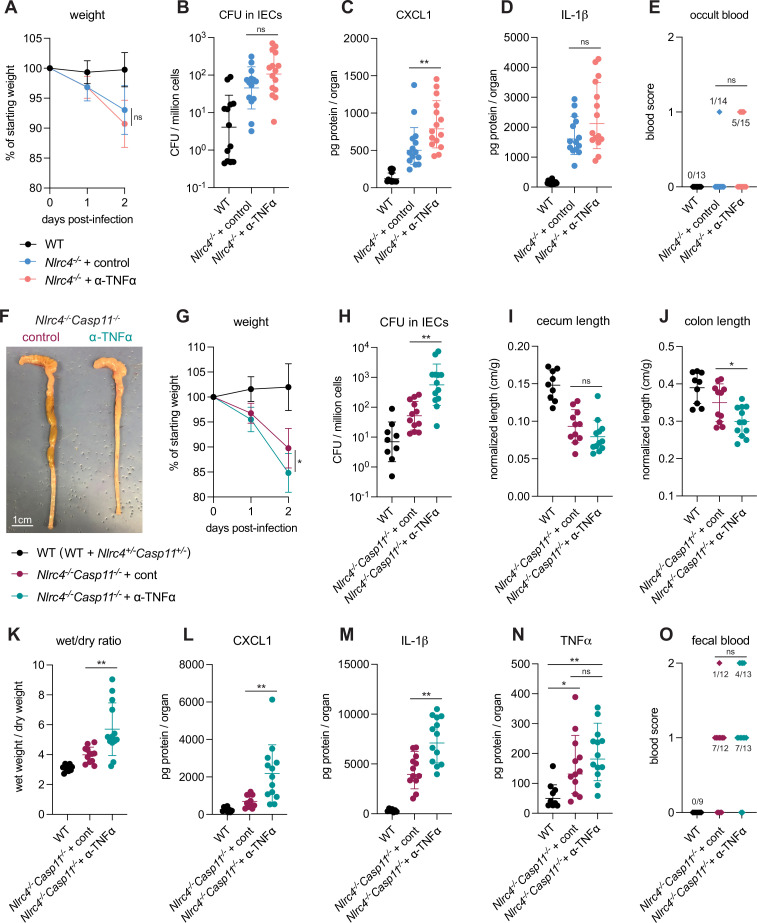
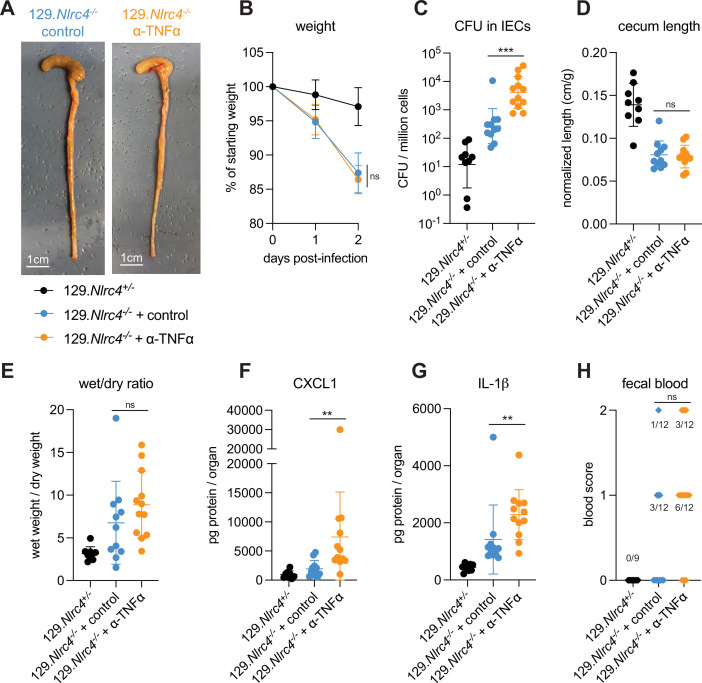
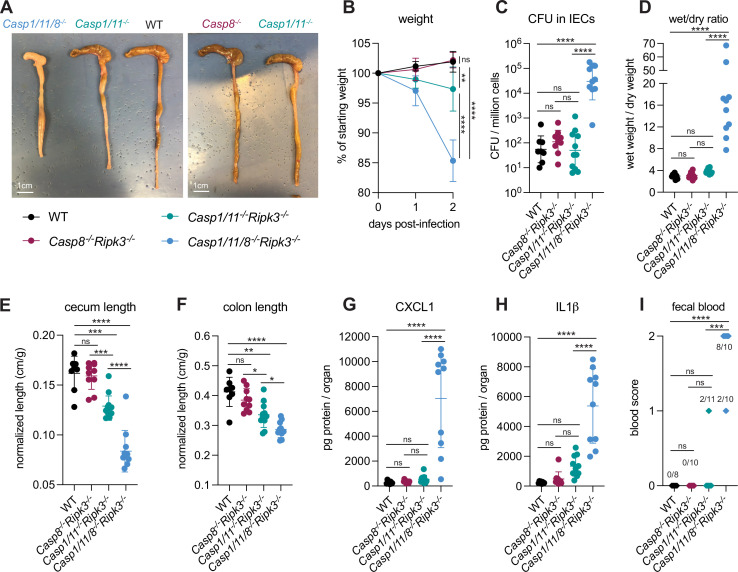
Bacteria of the genus Shigella cause shigellosis, a severe gastrointestinal disease driven by bacterial colonization of colonic intestinal epithelial cells. Vertebrates have evolved programmed cell death pathways that sense invasive enteric pathogens and eliminate their intracellular niche. Previously we reported that genetic removal of one such pathway, the NAIP-NLRC4 inflammasome, is sufficient to convert mice from resistant to susceptible to oral Shigella flexneri challenge (Mitchell et al., 2020). Here, we investigate the protective role of additional cell death pathways during oral mouse Shigella infection. We find that the Caspase-11 inflammasome, which senses Shigella LPS, restricts Shigella colonization of the intestinal epithelium in the absence of NAIP-NLRC4. However, this protection is limited when Shigella expresses OspC3, an effector that antagonizes Caspase-11 activity. TNFα, a cytokine that activates Caspase-8-dependent apoptosis, also provides potent protection from Shigella colonization of the intestinal epithelium when mice lack both NAIP-NLRC4 and Caspase-11. The combined genetic removal of Caspases-1, -11, and -8 renders mice hyper-susceptible to oral Shigella infection. Our findings uncover a layered hierarchy of cell death pathways that limit the ability of an invasive gastrointestinal pathogen to cause disease.

Keywords: Shigella; immunology; infectious disease; inflammation; intestine; microbiology; mouse; pathogenesis.


Conflict of interest statement

JR, JB, RC, FL, ET, AL, CL No competing interests declared, RV Reviewing editor, eLife

Figures

Figure 1.
Figure 1.. CASP11 contributes to resistance of B6 versus 129 Nlrc4–/– mice to shigellosis.
(A–G) B6.Nlrc4–/– mice (pink, n=6), 129.Nlrc4–/– mice (light blue, n=6), and backcrossed littermates that are homozygous 129/129 at Casp11 (dark blue, n=9) or heterozygous B6/129 at Casp11 (maroon, n=7) were co-housed for 3 weeks, treated orally with 25 mg streptomycin sulfate in water, and orally challenged the next day with 107 colony forming units (CFUs) of wild-type (WT) Shigella flexneri. Mice were sacrificed at 3 days post-infection. (A) Mouse weights from 0 through 3 days post-infection. Each symbol represents the mean for all mice of the indicated genotype. (B) Shigella CFUs per million cells from the combined intestinal epithelial cell (IEC) enriched fraction of gentamicin-treated cecum and colon tissue. (C, D) CXCL1 and IL-1β levels measured by ELISA from homogenized cecum and colon tissue of infected mice. (E) Quantification of cecum lengths normalized to mouse weight prior to infection; cecum length (cm)/mouse weight (g). (F) The ratio of fecal pellet weight when wet (fresh) divided by the fecal pellet weight after overnight drying. A larger wet/dry ratio indicates increased diarrhea. Pellets were collected daily from 0 to 3 days post-infection. (G) Additive blood scores from feces collected at 2 and 3 days post-infection. 1=occult blood, 2=macroscopic blood for a given day, maximum score is 4. (B–G) Each symbol represents one mouse. Data collected from one experiment. Mean ± SD is shown in (A, C– E). Geometric mean ± SD is shown in (B). Mean ± SEM is shown in (F). Statistical significance was calculated by one-way ANOVA with Tukey’s multiple comparison test (A (day 3), B, C, D, E, and G) and by two-way ANOVA with Tukey’s multiple comparison test (F). Data were log-transformed prior to calculations in (B) and (F) to achieve normality. *p<0.05, **p<0.01, ***p<0.001, ****p<0.0001, ns = not significant (p>0.05).
Figure 1—figure supplement 1.
Figure 1—figure supplement 1.. B6/129.Nlrc4–/– F1 hybrids are modestly susceptible to Shigella.
Crossing scheme to generate B6/129.Nlrc4–/– F1 mice and backcrossed Nlrc4–/– mice that are heterozygous B6/129 or homozygous 129/129 at Casp11 or Hiccs. (B–E) 129.Nlrc4–/– (light blue, n=3), B6.Nlrc4–/– (pink, n=3), and 129/B6.Nlrc4–/– F1 (plum, n=7) mice were treated orally with 25 mg streptomycin sulfate in water and orally challenged the next day with 107 colony forming units (CFUs) of wild-type (WT) Shigella flexneri. Mice were sacrificed at 3 days post-infection. (B) Mouse weights from 0 through 3 days post-infection. Each symbol represents the mean for all mice of the indicated group. (C) Shigella CFUs per million cells from the combined intestinal epithelial cell (IEC) enriched fraction of gentamicin-treated cecum and colon tissue. (D) The ratio of fecal pellet weight when wet (fresh) divided by the fecal pellet weight after overnight drying. A larger wet/dry ratio indicates increased diarrhea. Pellets were collected at day 2 post-infection. (E, F) CXCL1 and IL-1β levels measured by ELISA from homogenized cecum and colon tissue of infected mice. (C–F) Each symbol represents one mouse. Data collected from one experiment. Mean ± SD is shown in (B, D–F). Geometric mean ± SD is shown in (C). Statistical significance was calculated by one-way ANOVA with Tukey’s multiple comparison test (B (day 3), C–F). Data were log-transformed prior to calculations in (C) to achieve normality. *p<0.05, **p<0.01, ***p<0.001, ****p<0.0001, ns = not significant (p>0.05).
Figure 1—figure supplement 2.
Figure 1—figure supplement 2.. Hiccs does not contribute to resistance of B6 versus 129 Nlrc4–/– mice to shigellosis.
(A–G) Backcrossed Nlrc4–/– littermates from Figure 1 were genotyped at Hiccs to determine whether they were 129/129 (dark blue, n=7) or B6/129 (maroon, n=9) at this locus. Data originally generated in Figure 1 were stratified by Hiccs locus genotype for each backcrossed mouse and compared to the original parental B6.Nlrc4–/– (pink), 129.Nlrc4–/– (light blue) mice. Refer to the Figure 1 legend for experimental details. (A) Mouse weights from 0 through 3 days post-infection. Each symbol represents the mean for all mice of the indicated genotype. (B) Shigella colony forming units (CFUs) per million cells from the combined intestinal epithelial cell (IEC) enriched fraction of gentamicin-treated cecum and colon tissue. (C, D) CXCL1 and IL-1β levels measured by ELISA from homogenized cecum and colon tissue of infected mice. (E) Quantification of cecum lengths normalized to mouse weight prior to infection; cecum length (cm)/mouse weight (g). (F) The ratio of fecal pellet weight when wet (fresh) divided by the fecal pellet weight after overnight drying. A larger wet/dry ratio indicates increased diarrhea. Pellets were collected daily from 0 to 3 days post-infection. (G) Additive blood scores from feces collected at 2 and 3 days post-infection. 1=occult blood, 2=macroscopic blood for a given day. (B–G) Each symbol represents one mouse. Data collected from one experiment. Mean ± SD is shown in (A, C–E). Geometric mean ± SD is shown in (B). Mean ± SEM is show in (F). Statistical significance was calculated by one-way ANOVA with Tukey’s multiple comparison test (A (day 3), B, C, D, E, and G) and by two-way ANOVA with Tukey’s multiple comparison test (F). Data were log-transformed prior to calculations in (B) and (F) to achieve normality. *p<0.05, **p<0.01, ***p<0.001, ****p<0.0001, ns = not significant (p>0.05).
Figure 2.
Figure 2.. CASP11 modestly contributes to resistance of B6.Nlrc4–/– mice to shigellosis.
(A–G) B6.WT mice (co-housed B6.WT and B6.Nlrc4+/–Casp11+/–mice, black, n=5) and B6.Nlrc4–/–Casp11+/– (teal, n=10) and B6.Nlrc4–/–Casp11–/– (lavender, n=9) littermates were treated orally with 25 mg streptomycin sulfate in water and orally challenged the next day with 107 colony forming units (CFUs) of wild-type (WT) Shigella flexneri. Mice were sacrificed at 2 days post-infection. (A) Mouse weights from 0 through 2 days post-infection. Each symbol represents the mean for all mice of the indicated genotype. (B) Quantification of cecum lengths normalized to mouse weight prior to infection; cecum length (cm)/mouse weight (g). (C) The ratio of fecal pellet weight when wet (fresh) divided by the fecal pellet weight after overnight drying. Pellets were collected at day 2 post-infection. A larger wet/dry ratio indicates increased diarrhea. (D) Shigella CFUs per million cells from the combined intestinal epithelial cell (IEC) enriched fraction of gentamicin-treated cecum and colon tissue. (E, F) CXCL1 and IL-1β levels measured by ELISA from homogenized cecum and colon tissue of infected mice. (G) Blood scores from feces collected at 2 days post-infection. 1=occult blood, 2=macroscopic blood. (B–G) Each symbol represents one mouse. Data collected from two independent experiments. Mean ± SD is shown in (A–C, E, F). Geometric mean ± SD is shown in (D). Statistical significance was calculated by Mann-Whitney test in (A–F) and by Fisher’s exact test in (G) where data were stratified by presence (score = 1 or 2) or absence (score = 0) of blood. In (A) statistical analysis was performed at day 2. *p<0.05, **p<0.01, ***p<0.001, ****p<0.0001, ns = not significant (p>0.05).
Figure 2—figure supplement 1.
Figure 2—figure supplement 1.. B6.Nlrc4–/–Casp11–/– mice have a 13 bp deletion in Casp11 and loss of CASP11 protein.
(A) Endogenous B6.Casp11 gene with guide RNA sequence and PAM site (above) and resulting edited locus (below). Edited mice have a 13 bp deletion in Casp11 that results in a frameshift mutation. (B) Western blot of bone marrow-derived macrophage lysates from mice edited at Casp11 that are either heterozygous (left two lanes) or homozygous knockout (right two lanes). The absence of bands at ~38 and ~43 kD indicates loss of Caspase-11 protein in the Casp11–/– mice. For raw blots of (B) see Figure 2—figure supplement 1—source data 1.
Figure 2—figure supplement 2.
Figure 2—figure supplement 2.. Shigella activates mouse cell death pathways.
Mouse NAIP–NLRC4, CASP11, and CASP8 respond to Shigella pathogen-associated molecular patterns or activities to initiate cell death. NAIP1 and NAIP2 receptors bind cytosolic needle and rod proteins (green), respectively, that are secreted through the Shigella type three secretion system (T3SS) leading to NLRC4 inflammasome formation and CASP1- or CASP8-dependent pyroptosis. CASP11 recognizes cytosolic Shigella LPS (read), leading to non-canonical inflammasome formation and pyroptosis which is partially inhibited when Shigella expresses effector OspC3 (yellow). TNFα (blue) initiates CASP8-dependent apoptosis through TNFRI when NF-κB signaling is suppressed by Shigella effectors (magenta). All three pathways also lead to cell expulsion when activated in intestinal epithelial cells.
Figure 3.
Figure 3.. Shigella effector OspC3 is critical for virulence in oral Shigella infection.
(A–H) Mice were treated orally with 25 mg streptomycin sulfate in water and infected 1 day later. B6.WT mice (co-housed wild-type [WT] and B6.Nlrc4+/–Casp11+/–) were orally challenged with 107 colony forming units (CFUs) of WT Shigella flexneri (n=7) and B6.Nlrc4–/– mice (co-housed B6.Nlrc4–/– and B6.Nlrc4–/–Casp11+/–) were challenged with WT (green, n=11) or ΔospC3 S. flexneri (blue, n=11). Mice were sacrificed at 2 days post-infection. (A) Representative images of the cecum and colon from B6.Nlrc4–/– mice infected with WT or ΔospC3 S. flexneri. The white arrow indicates clear but reduced inflammation in mice infected with the ΔospC3 strain. (B) Mouse weights from 0 through 2 days post-infection. Each symbol represents the mean for all mice of the indicated genotype. (C) Shigella CFUs per million cells from the combined intestinal epithelial cell (IEC) enriched fraction of gentamicin-treated cecum and colon tissue. (D) Quantification of cecum lengths normalized to mouse weight prior to infection; cecum length (cm)/mouse weight (g). (E) The ratio of fecal pellet weight when wet (fresh) divided by the fecal pellet weight after overnight drying. Pellets were collected at day 2 post-infection. (F, G) CXCL1 and IL-1β levels measured by ELISA from homogenized cecum and colon tissue of infected mice. (H) Blood scores from feces collected at 2 days post-infection. 1=occult blood, 2=macroscopic blood. (C–H) Each symbol represents one mouse. Data collected from two independent experiments. Mean ± SD is shown in (B, D–G). Geometric mean ± SD is shown in (C). Statistical significance was calculated by one-way ANOVA with Tukey’s multiple comparison test (B (day 2), C–G) and by Fisher’s exact test in (H) where data were stratified by presence (score = 1 or 2) or absence (score = 0) of blood. Data were log-transformed prior to calculations in (C) to achieve normality. *p<0.05, **p<0.01, ***p<0.001, ****p<0.0001, ns = not significant (p>0.05).
Figure 4.
Figure 4.. OspC3-driven virulence in B6.Nlrc4–/– mice depends on Caspase-11.
(A–G) Mice were treated orally with 25 mg streptomycin sulfate in water and then infected 1 day later. B6.WT mice were orally challenged with 107 colony forming units (CFUs) of wild-type (WT) Shigella flexneri (black, n=8), B6.Nlrc4–/– (co-housed B6.Nlrc4–/–Casp11+/+ and B6.Nlrc4–/–Casp11+/–) mice were challenged with WT (blue, n=10) or ΔospC3 S. flexneri (pink, n=9), and B6.Nlrc4–/–Casp11–/– mice (littermates with the B6.Nlrc4–/–Casp11+/–) were challenged with WT (teal, n=13) or ΔospC3 S. flexneri (maroon, n=15). Mice were littermates or were co-housed for 3 weeks prior to infection and were sacrificed at 2 days post-infection. (A) Mouse weights from 0 through 2 days post-infection. Each symbol represents the mean for all mice of the indicated group. (B) Shigella CFUs per million cells from the combined intestinal epithelial cell (IEC) enriched fraction of gentamicin-treated cecum and colon tissue. (C) Quantification of cecum lengths normalized to mouse weight prior to infection; cecum length (cm)/mouse weight (g). (D) The ratio of fecal pellet weight when wet (fresh) divided by the fecal pellet weight after overnight drying. Pellets were collected at day 2 post-infection. (E, F) CXCL1 and IL-1β levels measured by ELISA from homogenized cecum and colon tissue of infected mice. (G) Blood scores from feces collected at 2 days post-infection. 1=occult blood, 2=macroscopic blood. (B–G) Each symbol represents one mouse. Data collected from two independent experiments. Mean ± SD is shown in (A, C–F). Geometric mean ± SD is shown in (B). Statistical significance was calculated by one-way ANOVA with Tukey’s multiple comparison test (A (day 2), B–F) and by Fisher’s exact test in (G) where data were stratified by presence (score = 1 or 2) or absence (score = 0) of blood. Data were log-transformed prior to calculations in (B, D) to achieve normality. *p<0.05, **p<0.01, ***p<0.001, ****p<0.0001, ns = not significant (p>0.05).
Figure 5.
Figure 5.. NLRC4 in myeloid-derived cells does not affect Shigella pathogenesis.
(A–H) B6.WT (black, n=10) mice were co-housed with B6.iNlrc4+Lyz2Cre+ (blue, n=18) and B6.Nlrc4–/– (iNlrc4Lyz2Cre+, red, n=15) littermates, treated orally with 25 mg streptomycin sulfate in water, and orally challenged the next day with 107 colony forming units (CFUs) of wild-type (WT) Shigella flexneri. Mice were sacrificed at 2 days post-infection. (A) Representative images of the cecum and colon from iNlrc4+Lyz2Cre+ and B6.Nlrc4–/– mice. Note the similarity in gross pathology between the two genotypes. (B) Mouse weights from 0 through 2 days post-infection. Each symbol represents the mean for all mice of the indicated group. (C) Shigella CFUs per million cells from the combined intestinal epithelial cell (IEC) enriched fraction of gentamicin-treated cecum and colon tissue. (D) Quantification of cecum lengths normalized to mouse weight prior to infection; cecum length (cm)/mouse weight (g). (E) The ratio of fecal pellet weight when wet (fresh) divided by the fecal pellet weight after overnight drying. Pellets were collected at day 2 post-infection. (F, G) CXCL1 and IL-1β levels measured by ELISA from homogenized cecum and colon tissue of infected mice. (H) Blood scores from feces collected at 2 days post-infection. 1=occult blood, 2=macroscopic blood. (C–H) Each symbol represents one mouse. Data collected from two independent experiments. Mean ± SD is shown in (B, D–G). Geometric mean ± SD is shown in (C). Statistical significance was calculated by one-way ANOVA with Tukey’s multiple comparison test (B (day 2), C–G) and by Fisher’s exact test in (H) where data were stratified by presence (score = 1 or 2) or absence (score = 0) of blood. Data were log-transformed prior to calculations in (C) to achieve normality. *p<0.05, **p<0.01, ***p<0.001, ****p<0.0001, ns = not significant (p>0.05).
Figure 6.
Figure 6.. IL-1 signaling does not affect Shigella pathogenesis.
(A–F) Nlrc4+Il1r1+mice (co-housed B6.WT and Nlrc4+/–Il1r1+/–, black, n=7), Nlrc4+/–Il1r1–/– (blue, n=7), Nlrc4–/–Il1r1+/– (teal, n=7), and Nlrc4–/–Il1r1–/– (maroon, n=7) littermates were treated orally with 25 mg streptomycin sulfate in water and orally challenged the next day with 107 colony forming units (CFUs) of wild-type (WT) Shigella flexneri. Mice were sacrificed at 2 days post-infection. (A) Mouse weights from 0 through 2 days post-infection. Each symbol represents the mean for all mice of the indicated group. (B) Shigella CFUs per million cells from the combined intestinal epithelial cell (IEC) enriched fraction of gentamicin-treated cecum and colon tissue. (C) Quantification of cecum lengths normalized to mouse weight prior to infection; cecum length (cm)/mouse weight (g). (D, E) CXCL1 and IL-1β levels measured by ELISA from homogenized cecum and colon tissue of infected mice. (F) Myeloperoxidase enzyme levels in mouse feces collected each day prior to and during infection and measured by ELISA. (B–F) Each symbol represents one mouse. Data were collected from one experiment but are representative of two independent experiments. Mean ± SD is shown in (A, C–F). Geometric mean ± SD is shown in (B). Statistical significance was calculated by one-way ANOVA with Tukey’s multiple comparison test (A (day 2), B–E) and two-way ANOVA with Tukey’s multiple comparison test (F). Data were log-transformed prior to calculations in (B) to achieve normality. *p<0.05, **p<0.01, ***p<0.001, ****p<0.0001, ns = not significant (p>0.05).
Figure 7.
Figure 7.. TNFα contributes to resistance to Shigella when mice lack NLRC4 and CASP11.
Wild-type (WT) (B6.WT, black, n=13 for (A–E), and both co-housed B6.WT and B6.Nlrc4+/–Casp11+/–, black, n=9 for (F–O)), B6.Nlrc4–/–, and B6.Nlrc4–/–Casp11–/– mice were treated orally with 25 mg streptomycin sulfate in water and orally challenged the next day with 107 colony forming units (CFUs) of WT Shigella flexneri. In (A–E), B6.Nlrc4–/– mice received 200 μg of either TNFα neutralizing antibody (pink, n=13) or isotype control antibody (light blue, n=14) by intraperitoneal injection daily from 1 day before infection through sacrifice at 2 days post-infection. In (F–O), B6.Nlrc4–/–Casp11–/– mice received 200 μg of either TNFα neutralizing antibody (teal, n=12) or isotype control antibody (maroon, n=13) by intraperitoneal injection daily from 1 day before infection through sacrifice at 2 days post-infection. (A, G) Mouse weights from 0 through 2 days post-infection. Each symbol represents the mean for all mice of the indicated group. (B, H) Shigella CFUs per million cells from the combined intestinal epithelial cell (IEC) enriched fraction of gentamicin-treated cecum and colon tissue. (C, D, L–N) CXCL1, IL-1β, and TNFα levels measured by ELISA from homogenized cecum and colon tissue of infected mice. (E, O) Blood scores from feces collected at 2 days post-infection. 1=occult blood, 2=macroscopic blood. (F) Representative images of the cecum and colon from B6.Nlrc4–/–Casp11–/– mice receiving either isotype control or TNFα neutralizing antibody. (I, J) Quantification of cecum and colon lengths normalized to mouse weight prior to infection; cecum or colon length (cm)/mouse weight (g). (K) The ratio of fecal pellet weight when wet (fresh) divided by the fecal pellet weight after overnight drying. Pellets were collected at day 2 post-infection. (B–E, H–O) Each symbol represents one mouse. Data collected from three independent experiments (A–E) and two independent experiments (F–O). Mean ± SD is shown in (A, C, D, G, I–N). Geometric mean ± SD is shown in (B, H). Statistical significance was calculated by Mann-Whitney test in (A (day 2), B–D, G (day 2), H–M), by one-way ANOVA with Tukey’s multiple comparison test in (N), and by Fisher’s exact test in (E, O) where data were stratified by presence (score = 1 or 2) or absence (score = 0) of blood. *p<0.05, **p<0.01, ***p<0.001, ****p<0.0001, ns = not significant (p>0.05).
Figure 7—figure supplement 1.
Figure 7—figure supplement 1.. TNFα neutralization renders 129.Nlrc4–/– mice more susceptible to Shigella.
(A–H) 129.Nlrc4+/– (black, n=9) and 129.Nlrc4–/– mice were treated orally with 25 mg streptomycin sulfate in water and orally challenged the next day with 107 colony forming units (CFUs) of wild-type (WT) Shigella flexneri. 129.Nlrc4–/– mice also received 200 μg of either TNFα neutralizing antibody (orange, n=12) or isotype control antibody (blue, n=12) by intraperitoneal injection daily from 1 day before infection through sacrifice at 2 days post-infection. (A) Representative images of the cecum and colon from 129.Nlrc4–/– mice receiving either isotype control or TNFα neutralizing antibody. (B) Mouse weights from 0 through 2 days post-infection. Each symbol represents the mean for all mice of the indicated group. (C) Shigella CFUs per million cells from the combined intestinal epithelial cell (IEC) enriched fraction of gentamicin-treated cecum and colon tissue. (D) Quantification of cecum lengths normalized to mouse weight prior to infection; cecum length (cm)/mouse weight (g). (E) The ratio of fecal pellet weight when wet (fresh) divided by the fecal pellet weight after overnight drying. Pellets were collected at day 2 post-infection. (F, G) CXCL1 and IL-1β levels measured by ELISA from homogenized cecum and colon tissue of infected mice. (H) Blood scores from feces collected at 2 days post-infection. 1=occult blood, 2=macroscopic blood. (C–H) Each symbol represents one mouse. Data collected from two independent experiments. Mean ± SD is shown in (B, D–G). Geometric mean ± SD is shown in (C). Statistical significance was calculated by Mann-Whitney test in (B (day 2), C–G) and by Fisher’s exact test in (H) where data were stratified by presence (score = 1 or 2) or absence (score = 0) of blood. *p<0.05, **p<0.01, ***p<0.001, ****p<0.0001, ns = not significant (p>0.05).
Figure 8.
Figure 8.. Loss of multiple cell death pathways renders mice hyper-susceptible to Shigella.
(A–I) B6.WT mice (black, n=8) were co-housed with B6.Casp8–/–Ripk3–/– (B6. Casp1/11+/–Casp8–/–Ripk3–/–, maroon, n=10), B6.Casp1/11–/–Ripk3–/– (B6.Casp1/11–/–Casp8+/–Ripk3, teal, n=11), and B6.Casp1/11/8–/–Ripk3–/– (light blue, n=10) littermates and treated orally with 25 mg streptomycin sulfate in water and orally challenged the next day with 107 colony forming units (CFUs) of wild-type (WT) Shigella flexneri. Mice were sacrificed at 2 days post-infection. (A) Representative images of the cecum and colon of infected B6.WT, B6.Casp8–/–Ripk3–/–, B6.Casp1/11–/–Ripk3–/–, and Casp1/11/8–/–Ripk3–/– mice. Note the severe inflammation in the Casp1/11/8–/–Ripk3–/– mice (left-most organs). (B) Mouse weights from 0 through 2 days post-infection. Each symbol represents the mean for all mice of the indicated group. (C) Shigella CFUs per million cells from the combined intestinal epithelial cell (IEC) enriched fraction of gentamicin-treated cecum and colon tissue. (D) The ratio of fecal pellet weight when wet (fresh) divided by the fecal pellet weight after overnight drying. Pellets were collected at day 2 post-infection. (E, F) Quantification of cecum and colon lengths normalized to mouse weight prior to infection; cecum or colon length (cm)/mouse weight (g). (G, H) CXCL1 and IL-1β levels measured by ELISA from homogenized cecum and colon tissue of infected mice. (I) Blood scores from feces collected at 2 days post-infection. 1=occult blood, 2=macroscopic blood. (C–I) Each symbol represents one mouse. Data collected from two independent experiments. Mean ± SD is shown in (B, D–H). Geometric mean ± SD is shown in (C). Statistical significance was calculated by one-way ANOVA with Tukey’s multiple comparison test (B (day 2), C–H) and by Fisher’s exact test in (I) where data were stratified by presence (score = 1 or 2) or absence (score = 0) of blood. Data were log-transformed prior to calculations in (C, D) to achieve normality. *p<0.05, **p<0.01, ***p<0.001, ****p<0.0001, ns = not significant (p>0.05).

References

    1. Alphonse N, Wanford JJ, Voak AA, Gay J, Venkhaya S, Burroughs O, Mathew S, Lee T, Evans SL, Zhao W, Frowde K, Alrehaili A, Dickenson RE, Munk M, Panina S, Mahmood IF, Llorian M, Stanifer ML, Boulant S, Berchtold MW, Bergeron JRC, Wack A, Lesser CF, Odendall C. A family of conserved bacterial virulence factors dampens interferon responses by blocking calcium signaling. Cell. 2022;185:2354–2369. doi: 10.1016/j.cell.2022.04.028. - DOI - PMC - PubMed
    1. Arondel J, Singer M, Matsukawa A, Zychlinsky A, Sansonetti PJ. Increased interleukin-1 (IL-1) and imbalance between IL-1 and IL-1 receptor antagonist during acute inflammation in experimental shigellosis. Infection and Immunity. 1999;67:6056–6066. doi: 10.1128/IAI.67.11.6056-6066.1999. - DOI - PMC - PubMed
    1. Ashida H, Kim M, Schmidt-Supprian M, Ma A, Ogawa M, Sasakawa C. A bacterial E3 ubiquitin ligase ipah9.8 targets NEMO/ikkgamma to dampen the host NF-kappab-mediated inflammatory response. Nature Cell Biology. 2010;12:66–73. doi: 10.1038/ncb2006. - DOI - PMC - PubMed
    1. Ashida H, Nakano H, Sasakawa C. Shigella ipah0722 E3 ubiquitin ligase effector targets TRAF2 to inhibit PKC-NF-κB activity in invaded epithelial cells. PLOS Pathogens. 2013;9:e1003409. doi: 10.1371/journal.ppat.1003409. - DOI - PMC - PubMed
    1. Ashida H, Mimuro H, Sasakawa C. Shigella manipulates host immune responses by delivering effector proteins with specific roles. Frontiers in Immunology. 2015;6:219. doi: 10.3389/fimmu.2015.00219. - DOI - PMC - PubMed

Publication types