. 2023 Mar;615(7952):482-489.
doi: 10.1038/s41586-023-05715-3. Epub 2023 Jan 16.

Molecular fate-mapping of serum antibody responses to repeat immunization

Affiliations

Molecular fate-mapping of serum antibody responses to repeat immunization

Ariën Schiepers et al. Nature. 2023 Mar.

Abstract

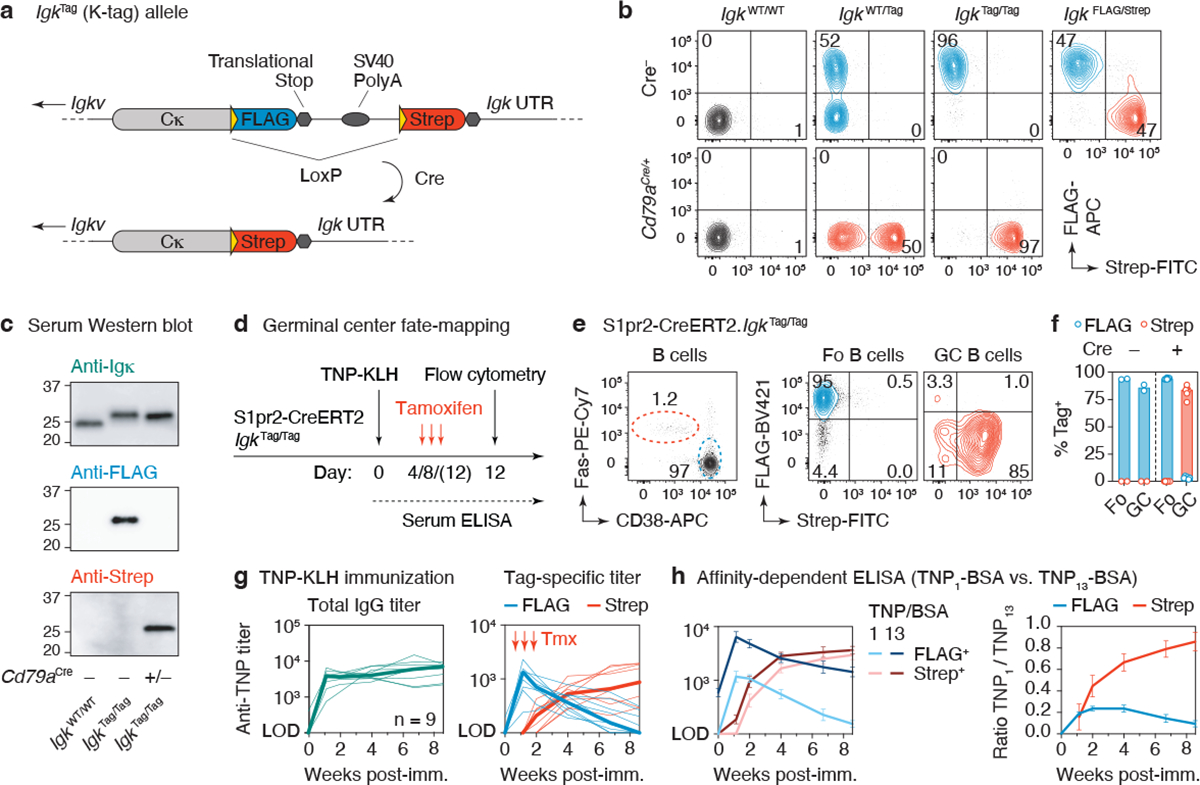
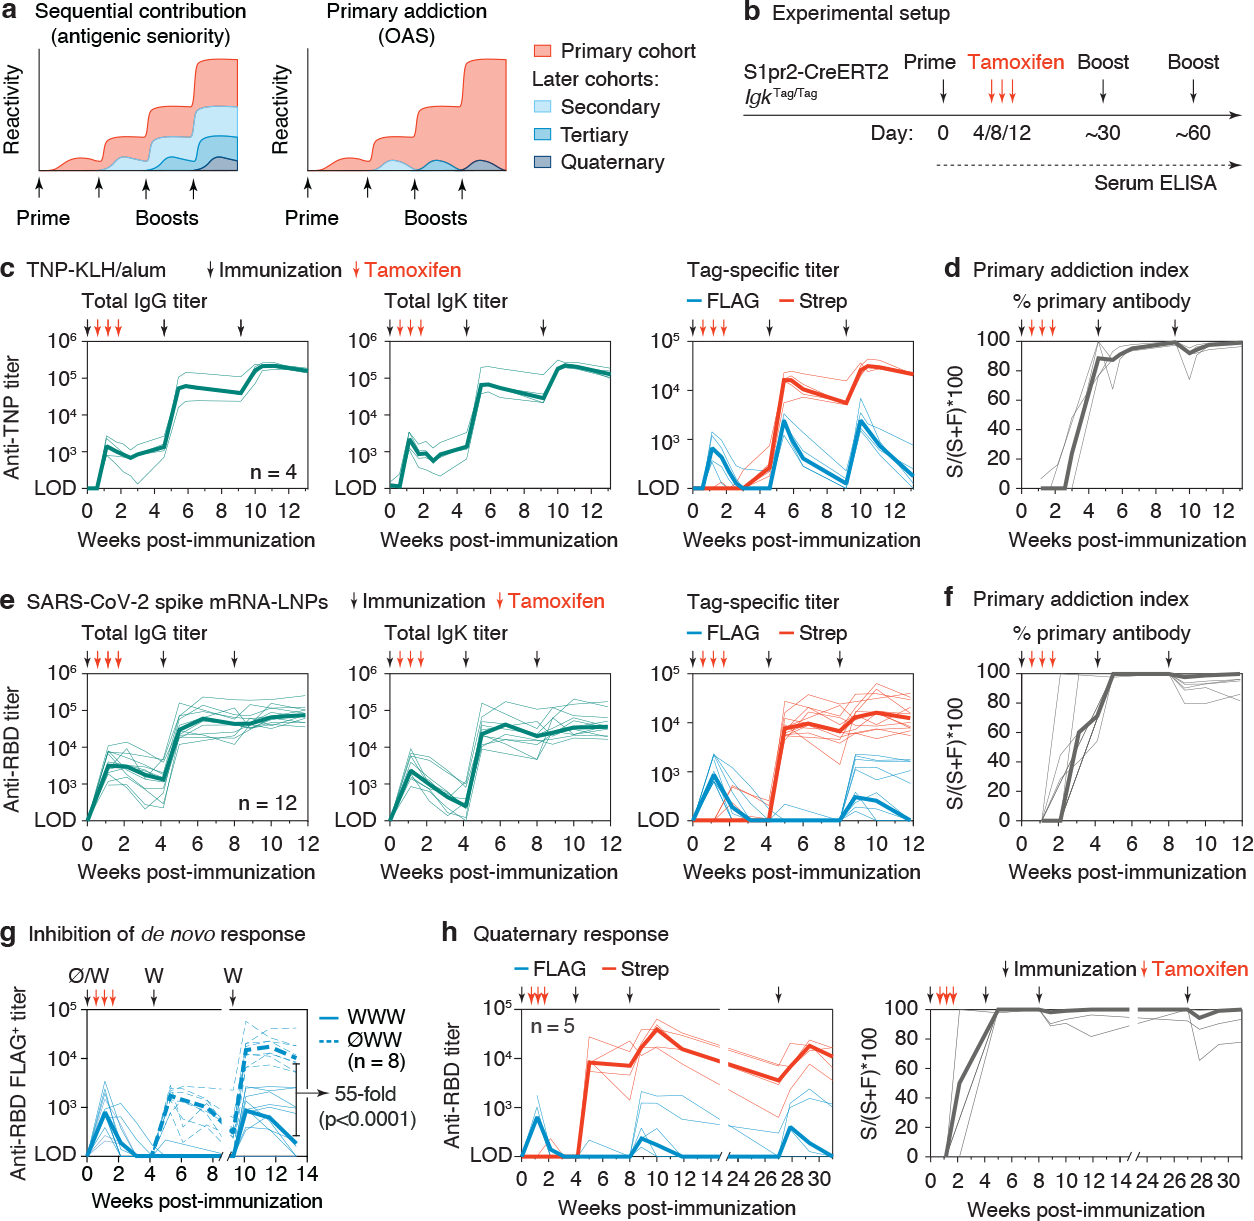
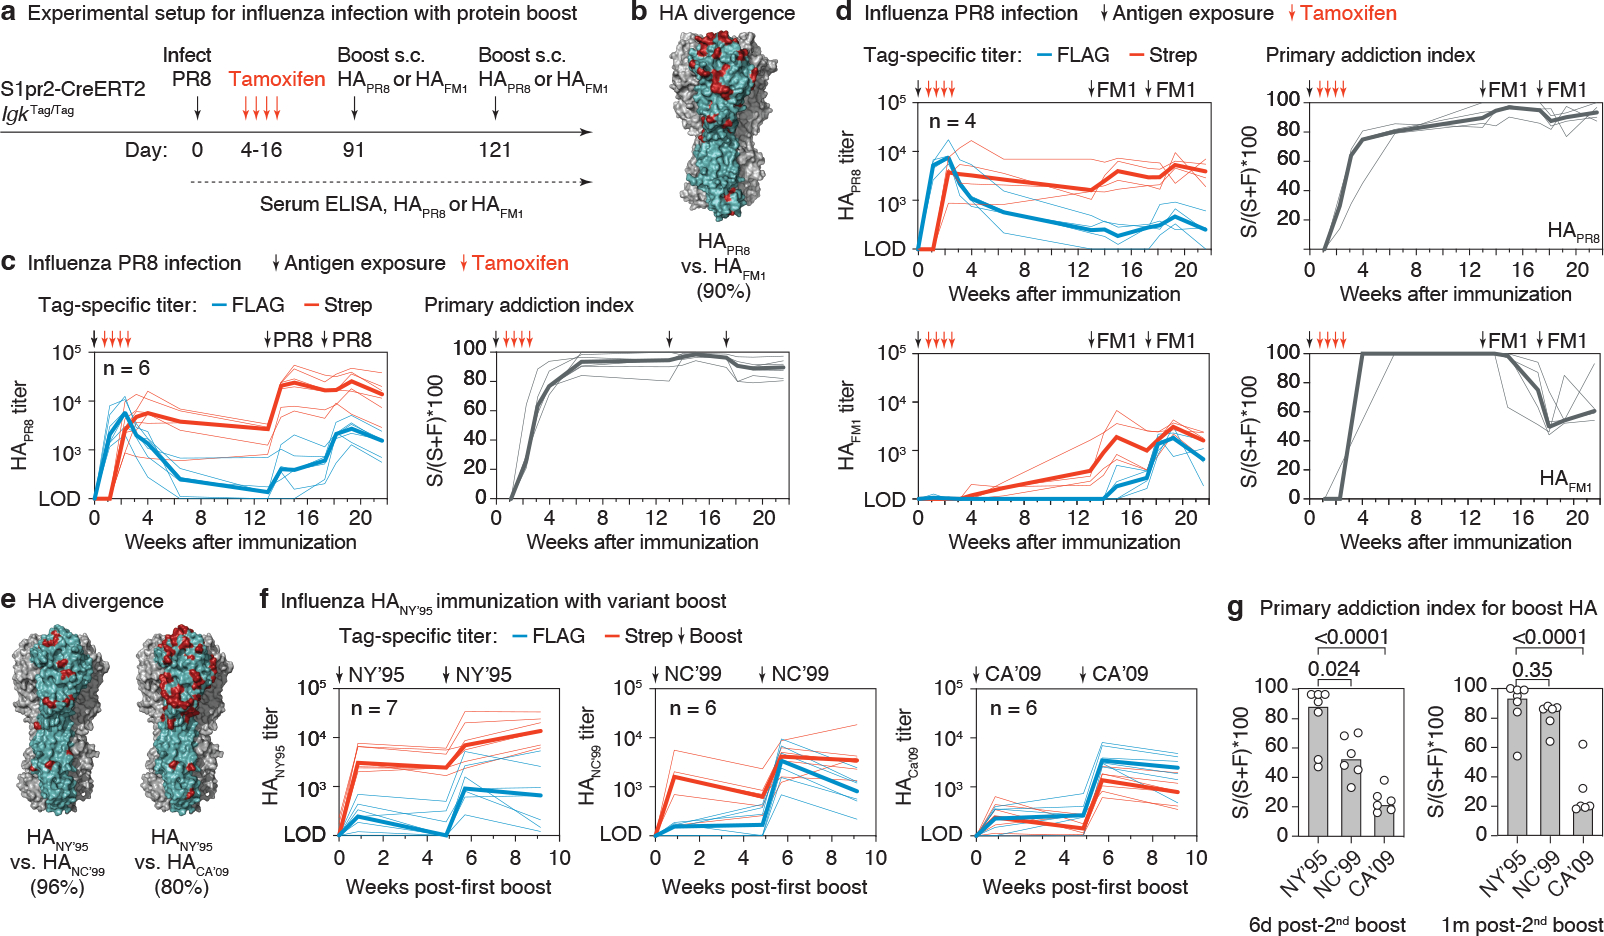
The protective efficacy of serum antibodies results from the interplay of antigen-specific B cell clones of different affinities and specificities. These cellular dynamics underlie serum-level phenomena such as original antigenic sin (OAS)-a proposed propensity of the immune system to rely repeatedly on the first cohort of B cells engaged by an antigenic stimulus when encountering related antigens, in detriment to the induction of de novo responses1-5. OAS-type suppression of new, variant-specific antibodies may pose a barrier to vaccination against rapidly evolving viruses such as influenza and SARS-CoV-26,7. Precise measurement of OAS-type suppression is challenging because cellular and temporal origins cannot readily be ascribed to antibodies in circulation; its effect on subsequent antibody responses therefore remains unclear5,8. Here we introduce a molecular fate-mapping approach with which serum antibodies derived from specific cohorts of B cells can be differentially detected. We show that serum responses to sequential homologous boosting derive overwhelmingly from primary cohort B cells, while later induction of new antibody responses from naive B cells is strongly suppressed. Such 'primary addiction' decreases sharply as a function of antigenic distance, allowing reimmunization with divergent viral glycoproteins to produce de novo antibody responses targeting epitopes that are absent from the priming variant. Our findings have implications for the understanding of OAS and for the design and testing of vaccines against evolving pathogens.


Conflict of interest statement

Competing interests

N.P. is named on a patent describing the use of nucleoside-modified mRNA in lipid nanoparticles as a vaccine platform. He has disclosed those interests fully to the University of Pennsylvania and has an approved plan in place for managing any potential conflicts arising from the licensing of that patent. Paulo J.C. Lin and Ying K. Tam are employees of Acuitas Therapeutics, a company involved in the development of mRNA-LNP therapeutics. Ying K. Tam is named on patents that describe lipid nanoparticles for the delivery of nucleic acid therapeutics, including mRNA, and the use of modified mRNA in lipid nanoparticles as a vaccine platform. P.D.B. has done consulting work in the area of COVID vaccines for Pfizer Inc.. J.D.B. consults or has recently consulted for Apriori Bio, Oncorus, Merck, and Moderna on topics related to viruses, vaccines, and viral evolution. J.D.B, T.N.S., and A.J.G. are inventors on Fred Hutch licensed patents related to viral deep mutational scanning. G.D.V. and J.D.B. are advisors for the Vaccine Company, Inc..

Figures

Extended Data Figure 1 |
Extended Data Figure 1 |. Design of the K-tag allele.
Nucleotide sequence of the 522 bp DNA template used to generate the IgkTag allele, with amino acid translations given for all coding sequences (bold font). Nucleotide numbers are given for each line. Amino acid translation is positioned below the center nucleotide of each codon.
Extended Data Figure 2 |
Extended Data Figure 2 |. Characterization of the K-tag system.
(a) Representative flow cytometry plots of peripheral B cells (gated: B220+CD4CD8CD138) obtained from the blood of WT and IgkTag/Tag mice, stained for surface expression of Igλ and FLAG-tagged immunoglobulins. (b) Total IgG concentration in the serum of WT, IgkTag/Tag, and Cd79aCre/+.IgkTag/Tag mice as determined by ELISA. Differences were not significant by one-way ANOVA (p<0.05). (c) Flow cytometry of steady-state bone marrow plasma cells (PCs) obtained from adult (6-week old) IgkFLAG/Strep mice. Gating strategy for PCs is shown in the left panel (pre-gated on non-CD4/CD8 T cells), for surface IgA+ and Igλ PCs in the middle panel, and for FLAG/Strep in the right panel. Quantification across 9 mice from 3 independent experiments is shown in the rightmost panel (each dot represents an individual IgkFLAG/Strep mouse, line represents the median). (d) ELISA standard curves with monoclonal antibody (mAb)-FLAG and mAb-Strep detected at dilutions of the respective HRP antibodies where the curves overlap. The mAb concentration at which the curves crossed the absorbance background threshold (indicated by the dotted lines) was used to calculate the endpoint titer, as described in the methods section. (e) Tag-specific anti-TNP titers in IgkFLAG/Strep mice immunized and boosted i.p. with TNP-KLH/alum at the timepoints indicated by black arrows. Results are from 14 mice from 2 independent experiments. The day 7 timepoint was not collected for the first cohort. Thin lines represent individual mice, thick lines link medians of log transformed titer values at each time point. (f) Flow cytometry of S1pr2-IgkWT/Tag mice as in Fig. 1d, e. with quantification in (g), cre and no tamoxifen control groups are included. Data points are from 6–13 popliteal lymph nodes per group from at least 2 independent experiments. (h) Anti-TNP ELISA reactivity for S1pr2-IgkTag/Tag mice immunized as in Fig. 1d. Serum was obtained at 47 d.p.i from 6 mice that received tamoxifen and 4 that did not receive tamoxifen. IgG (left), FLAG (middle) and Strep (right) ELISA absorbance is shown. Samples were diluted 1:100.
Extended Data Figure 3 |
Extended Data Figure 3 |. Recall antibodies and GCs.
(a) Flow cytometry of secondary GCs in the spleen of 3 TNP-KLH i.p. primed and boosted S1pr2-IgkTag/Tag mice, with tamoxifen labeling at 4, 8, and 12 d.p.i.. Gated on GC B cells (FAS+CD38B220+CD4CD8CD138) expressing FLAG or Strep-tag as in Fig. 1e. (b) Total IgM concentrations of serum samples pre and post IgM-depletion via immunoprecipitation, measured by ELISA. Data are from 8 serum samples, from the same 4 mice as in Fig. 2c. (c) Tag-specific anti-TNP titers before and after IgM depletion for samples collected 6 days after the first and second boost with TNP-KLH (same samples as in (b) and Fig. 2c). Bars represent the means of log transformed titers and the error bars are SEM. P-values are for two-tailed, paired T-test, only statistically significant (p < 0.05) values are shown. (d) Background Strep+ anti-RBD titers in S1pr2-IgkTag/Tag control mice immunized as in Fig. 2b,e, but not treated with tamoxifen. Graphs show median percentage of the anti-RBD titer that is Strep+ ((S/(S+F)*100)) in the absence of tamoxifen at the pre-boost time point and two weeks after the second and third immunizations. This represents the median percentage by which FLAG+ titers in recall responses are likely to be underestimated by spontaneous recombination by the S1pr2-CreERT2 driver. Data are from 8 mice from 2 independent experiments. (e) Comparison of primary addiction data shown in Fig. 2e,f, stratified by cohort and ipsilateral versus contralateral boost. The 4th cohort of mice is the homologously boosted group shown in Fig. 4b–e, depicted here by open circles. Bars represent the mean of log transformed titers, error bars are SEM. Data are from 16 mice from 4 independent cohorts. (f) Comparison of primary addiction between 3rd and 4th responses in 9 mice from 2 cohorts, based on data from Fig. 2e,f,h. Bars represent the mean of log transformed titers, error bars are SEM.
Extended Data Figure 4 |
Extended Data Figure 4 |. Primary cohort recall upon heterologous HA protein boosting.
(a) Comparison of de novo FLAG+ antibody responses to HAFM1 in the presence or absence of primary infection with influenza virus PR8. PR8>FM1>FM1 data are for the same samples as in Fig. 3d, re-measured in the same assay as Ø>FM1>FM1. (b) Schematic representation of HA prime-boost strategy. S1pr2-IgkTag/Tag mice were primed i.p. with HANY’95 in alhydrogel and boosted homologously or heterologously with HANC’99 or HACA’09 in alhydrogel as indicated. (c) Full time course of anti-HA tag-specific ELISA reactivity (optical density at 1:100 dilution) of the same mice shown in Fig. 3f. Anti-HANY’95 (top), HANC’99 (middle) and HACA’09 (bottom) ELISAs are shown, with Strep (left) and FLAG (right) detection. (d) Relationship between primary addiction and antigenic distance for infection and immunization experiments. Graph compiles primary addiction indices from Figs. 3d and 3g. Bars are ordered by amino acid identity between the priming and boosting HAs. P-values are for one-way ANOVA, with % identity as a categorical variable, or Pearson correlation, with (100 – % identity) as a linear variable.
Extended Data Figure 5 |
Extended Data Figure 5 |. Neutralization of WH1 and BA.1 pseudoviruses by serum antibody fractions from BA.1 boosted mice.
(a) Efficiency of serum fractionation into FLAG and Strep-depleted fractions, as measured by anti-RBD ELISA of input vs. post-depletion samples. Serum was obtained from heterologously immunized mice two weeks after the 3rd immunization, Fig. 4d (8 mice from 2 independent experiments). (b) Neutralization of WH1 (left) and BA.1 (right) SARS-CoV-2 S-expressing pseudotyped HIV-1 virus by serum fractions shown in (a). Mean values of technical duplicates are shown. (c) WH1 S pseudovirus NT50 titers for samples in (b). Post-depletion NT50s were normalized to input serum based on the BA.1 RBD ELISA titers (a), by applying a correction equalizing the anti-RBD Strep-titer of the FLAG-depleted fraction to the input, and the anti-RBD FLAG-titer of the Strep-depleted fraction to the input. P-values are for one-tailed paired T test. FC, fold-change. (d) Estimating the contribution of de novo vs. memory-derived antibodies to excess BA.1 neutralization by the WBB regimen. The contribution of secondary affinity maturation or preferential selection of crossreactive memory B cells by BA.1 boosting, μS, is calculated as the difference between Strep+ WBB and total WWW BA.1 neutralization titers (the latter are assumed to be all FLAG+). The contribution of BA.1-specific antibodies induced de novo by BA.1 boosting, F, is given as the FLAG+ WBB titer. Percent contribution of F to the improved BA.1 neutralization in WBB is calculated as (F/(F+μS))*100. Bars and dotted lines represent the medians for each condition, which were used to calculate F and μS. The upper dotted line (4.) represents the median neutralization of total WBB antibodies and is shown for reference purposes only. Data in groups 1 and 4 are reproduced from Fig. 4b, data in group 2 and 3 from Fig. 4h.
Extended Data Figure 6 |
Extended Data Figure 6 |. Yeast-displayed deep mutational scanning to map mutations that reduce binding of immunized mouse serum.
(a) Top: Representative plots of nested FACS gating strategy used for all experiments to select for single yeast cells. Bottom: Gating strategy to select for RBD-expressing single cells (FITC-A vs. FSC-A). (b) FACS gating strategy for one of two independent libraries to select cells expressing BA.1 or WH1 RBD mutants with reduced Strep or FLAG antibody binding (cells in blue), as measured by secondary staining with APC-conjugated streptavidin or APC-conjugated anti-FLAG antibody, respectively. Gates were set manually for each sample to capture cells that have a reduced amount of tagged antibody binding for their degree of RBD expression. FACS scatter plots were qualitatively similar between the two libraries. The mouse identifier (#1–4), DMS target library (WH1 or BA.1), and antibody tag (Strep or FLAG) are indicated above each plot. (c) Mutation (left)- and site (right)-level correlations of escape scores between two independent biological replicate libraries.
Extended Data Figure 7 |
Extended Data Figure 7 |. RBD serum-escape logo plots.
Deep mutational scanning results of serum collected from 4 heterologously immunized mice, 2 weeks after the 3rd dose (Fig. 4d). Each mutation’s “escape fraction” was measured, which ranges from 0 (no cells effect on antibody binding) to 1 (all cells with the mutation have decreased antibody binding). Mouse 4 is not shown in the main text as there were no interpretable peaks in antibody binding to BA.1 libraries for either antibody fraction. Logo plots show the antibody-escape fractions for individual amino-acid mutations at key sites of strong escape. Sites in which BA.1 differs from the WH1 sequence are shown in purple font. All escape scores are shown in Supplemental Spreadsheet 1 and are available online at https://github.com/jbloomlab/SARS-CoV-2-RBD_MAP_OAS/blob/main/results/supp_data/all_raw_data.csv.
Figure 1 |
Figure 1 |. The K-tag system for molecular fate-mapping of serum antibodies.
(a) Schematic representation of the IgkTag allele prior to and following cre-mediated recombination. (b) Flow cytometry of blood B cells showing expression of FLAG- and Strep-tagged B cell receptors on mice of the indicated genotype. (c) Western blotting of serum obtained from mice of the indicated genotype, stained for Igκ light chain or FLAG/Strep-tags. Representative of 2 experiments. (d) Schematic representation of the immunization strategy used to fate-map GC B cells and their antibody output. (e) Flow cytometry of popliteal lymph node 12 days after footpad immunization with TNP-KLH in alum adjuvant. Left panel shows B cells (B220+, CD4 CD8 CD138) stained for GC (FAS+ CD38) and follicular (Fo) B cell (FAS CD38+) markers. (f) Quantification of data in (e). Each dot represents an individual lymph node, bars represent the median. (g) Anti-TNP total IgG and tag-specific endpoint titers as determined by TNP4 -BSA ELISA in mice immunized i.p. with TNP-KLH in alhydrogel adjuvant. Thin lines represent individual mice, thick lines link medians of log transformed titer values at each time point. Results are from 9 mice from 2 independent experiments. (h) Relative affinity of anti-TNP FLAG+ and Strep+ antibodies of the same samples shown in (g) as estimated by ELISA using TNP1-BSA or TNP13-BSA as capture reagents. The means of the log transformed titer values are shown with error bars representing SEM. The ratio between anti-TNP1-BSA and anti-TNP13-BSA titers was calculated per sample, shown in the right panel.
Figure 2 |
Figure 2 |. Primary addiction upon homologous boosting.
(a) Schematic representation of the “sequential contribution” and “primary addiction” models of antigenic imprinting. (b) General immunization strategy used to measure primary addiction. S1pr2-IgkTag/Tag mice were immunized on the days indicated by black arrows with TNP-KLH in alum (c-d) or WH1 mRNA-LNP (e-g) and treated with tamoxifen at 4, 8 and 12 d.p.i. as indicated by the red arrows. (c) Anti-TNP serum IgG (left panel), Igκ (middle panel) and tag-specific titers (right panel) as measured using TNP4 -BSA by ELISA. Results are from 4 mice from 2 independent experiments. Thin lines represent individual mice, thick lines link medians of log transformed titer values at each time point. (d) The percentage of the TNP-titer derived from the primary cohort of B cells (the “primary addiction index”) was calculated by dividing the Strep+ titer of each individual sample by its total titer (Strep+ + FLAG+), multiplied by 100 (S/(S+F)*100). (e) Anti-WH1 RBD IgG (left panel), Igκ (middle panel), and tag-specific titers (right panel) as measured by ELISA. Results are from 12 mice from 3 independent experiments. (f) Primary addiction index calculated as in (d). (g) Comparison of de novo FLAG+ antibody responses in the presence or absence of primary immunization. WWW, three doses of WH1 S mRNA; ØWW, first dose and fate-mapping omitted. WWW data are for the same samples as in panel (e), re-measured in the same assay as ØWW. (h) Anti-WH1 RBD response (left) and primary addiction index (right) in mice receiving a 4th dose of mRNA-LNP at 133 days after the previous dose, for one of the cohorts shown in (e). Two of five mice were not sampled at day 0.
Figure 3 |
Figure 3 |. Primary addiction decreases with antigenic distance.
(a) Schematic representation of influenza infection and HA boosting strategy. S1pr2-IgkTag/Tag mice were infected intranasally with PR8 influenza and boosted subcutaneously (s.c.) with HAPR8 or HAFM1 in alhydrogel at the indicated time points. (b) Rendering of the HAPR8 trimer structure (PDB: 1RU7) with one monomer highlighted in teal and the amino acids that diverge between HAPR8 and HAFM1 in red. Percent amino acid identity is given in parentheses. (c) Anti-HAPR8 FLAG+ and Strep+ titers in S1pr2-IgkTag/Tag mice homologously boosted with HAPR8 (left) and quantification of the primary addiction index score (right). (d) Anti-HAPR8 (top) and anti-HAFM1 (bottom) ELISA reactivity in mice heterologously boosted with HAFM1. Tag-specific titers are shown in the left panels, and quantification of the primary addiction index is shown on the right. (e) Divergence between HANC’95 and HANC’99 or HACA’09, colored as in (b). Modeled on the structure of HACA’09 (PDB: 3LZG). (f) Anti-HA tag-specific titers in mice primed with HANY’95 protein, shown after the first boost with HANY’95 (homologous) or with variants HANC’99 or HACA’09 (heterologous), as outlined in Extended Data Fig. 4b. Antibody reactivity against the boosting antigen is shown. The full time-course and reactivities against all three HAs as measured by ELISA for the top serum dilution are shown in Extended Data Fig. 4c. (g) Primary addiction index for the boosting HA, 6 days (left) and 1 month (right) after the second boost (third dose). P-values are for two-tailed Student’s T test comparing the primary addiction index of the homologous to each heterologous boost. Thin lines represent individual mice, thick lines link medians of log transformed titer values at each time point. All results are from 2 independent experiments, with the number of mice in each group indicated in the graphs.
Figure 4 |
Figure 4 |. Subversion of primary addiction by heterologous SARS-CoV-2 boosting.
(a) Schematic representation of immunization strategies. (b) Anti-WH1 (left) and BA.1 RBD IgG titers (middle) and NT50 of BA.1 pseudovirus (right) 2 weeks after indicated dose in homologously (WWW) or heterologously (WBB) immunized S1pr2-IgkTag/Tag mice. P-value: 2-tailed T test. FC, fold-change. (c) Evolution of anti-WH1 and BA.1 RBD tag-specific titers. Thin lines represent individual mice, thick lines link medians of log transformed titer values. (d) Comparison of FLAG and Strep anti-RBD titers shown in (c) at 2 weeks after 3rd immunization (left) along with primary addiction index (right). P-values: 2-tailed T test. (e) Anti-full S tag-specific titers and primary addiction index for the same samples as in (d). Results in (b-d) are from 2 independent experiments, with the number of mice in each group indicated. (f) Comparison of de novo FLAG+ antibody responses in WBB mice versus mice in which the 1st dose and fate-mapping were omitted (ØBB). ØBB data are for 10 mice from 2 independent experiments. WBB data are from (c), remeasured in the same assay as ØBB. (g) Schematic representation of antibody fractionation. (h) BA.1 NT50 titers for WBB mice at the time point as in (d). Post-depletion NT50s normalized as described in Methods. P-values: 1-tailed paired T test. (i) Potency of anti-RBD BA.1 Strep+ (FLAG-depleted) and FLAG+ (Strep-depleted) fractions. Raw NT50 values for each fraction were divided by their respective RBD ELISA titers. P-values: 2-tailed paired T test. (j) WH1 RBD structure (PDB: 6MOJ) with amino acid changes in BA.1 highlighted in red. (k) DMS of serum samples obtained from 3 WBB mice 2 weeks after 3rd immunization (d). Antibody binding sites on RBD are shaded according to escape fraction. The positions most highly targeted by each serum fraction are indicated (BA.1-specific residues in parentheses).

Comment in

References

MAIN TEXT REFERENCES

    1. Francis T On the Doctrine of Original Antigenic Sin. Proceedings of the American Philosophical Society 104, 572–578 (1960).
    1. Fazekas de St. Groth S & Webster RG Disquisitions on Original Antigenic Sin. II. Proof in lower creatures. J Exp Med 124, 347–361 (1966). 10.1084/jem.124.3.347 - DOI - PMC - PubMed
    1. Cobey S & Hensley SE Immune history and influenza virus susceptibility. Curr Opin Virol 22, 105–111 (2017). 10.1016/j.coviro.2016.12.004 - DOI - PMC - PubMed
    1. Henry C, Palm AE, Krammer F & Wilson PC From Original Antigenic Sin to the Universal Influenza Virus Vaccine. Trends Immunol 39, 70–79 (2018). 10.1016/j.it.2017.08.003 - DOI - PMC - PubMed
    1. Yewdell JW & Santos JJS Original Antigenic Sin: How Original? How Sinful? Cold Spring Harb Perspect Med 11 (2021). 10.1101/cshperspect.a038786 - DOI - PMC - PubMed

ADDITIONAL REFERENCES

    1. Hobeika E et al. Testing gene function early in the B cell lineage in mb1-cre mice. Proc Natl Acad Sci U S A 103, 13789–13794 (2006). 10.1073/pnas.0605944103 - DOI - PMC - PubMed
    1. Quadros RM et al. Easi-CRISPR: a robust method for one-step generation of mice carrying conditional and insertion alleles using long ssDNA donors and CRISPR ribonucleoproteins. Genome biology 18, 92 (2017). 10.1186/s13059-017-1220-4 - DOI - PMC - PubMed
    1. Laczko D et al. A Single Immunization with Nucleoside-Modified mRNA Vaccines Elicits Strong Cellular and Humoral Immune Responses against SARS-CoV-2 in Mice. Immunity 53, 724–732 e727 (2020). 10.1016/j.immuni.2020.07.019 - DOI - PMC - PubMed
    1. Lee PS, Zhu X, Yu W & Wilson IA Design and Structure of an Engineered Disulfide-Stabilized Influenza Virus Hemagglutinin Trimer. J Virol 89, 7417–7420 (2015). 10.1128/JVI.00808-15 - DOI - PMC - PubMed
    1. Tas JM et al. Visualizing antibody affinity maturation in germinal centers. Science 351, 1048–1054 (2016). 10.1126/science.aad3439 - DOI - PMC - PubMed

Publication types