. 2023 Jan 16;14(1):30.
doi: 10.1038/s41419-023-05566-w.

Single-cell RNA-seq integrated with multi-omics reveals SERPINE2 as a target for metastasis in advanced renal cell carcinoma

Affiliations

Single-cell RNA-seq integrated with multi-omics reveals SERPINE2 as a target for metastasis in advanced renal cell carcinoma

Wen-Jin Chen et al. Cell Death Dis. .

Abstract

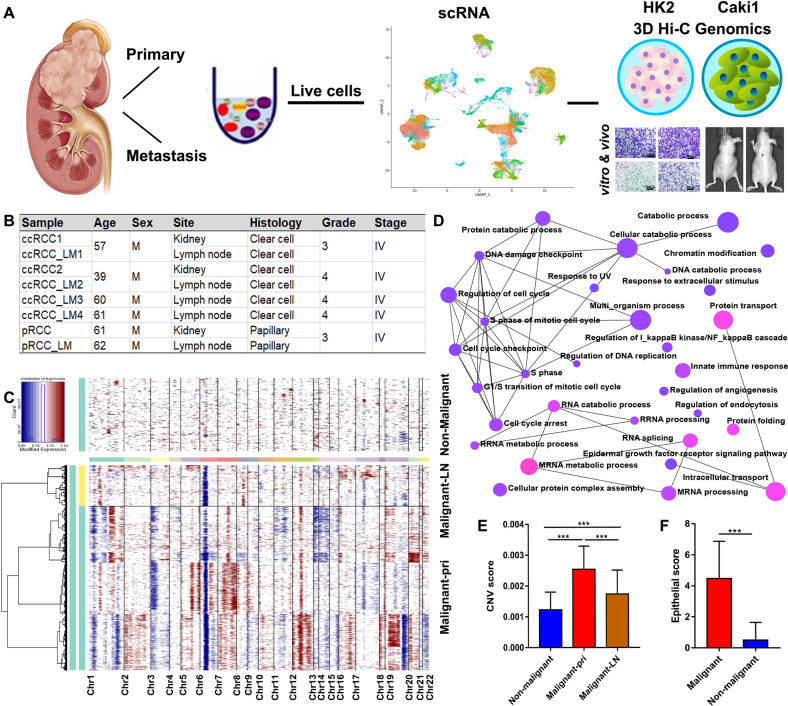
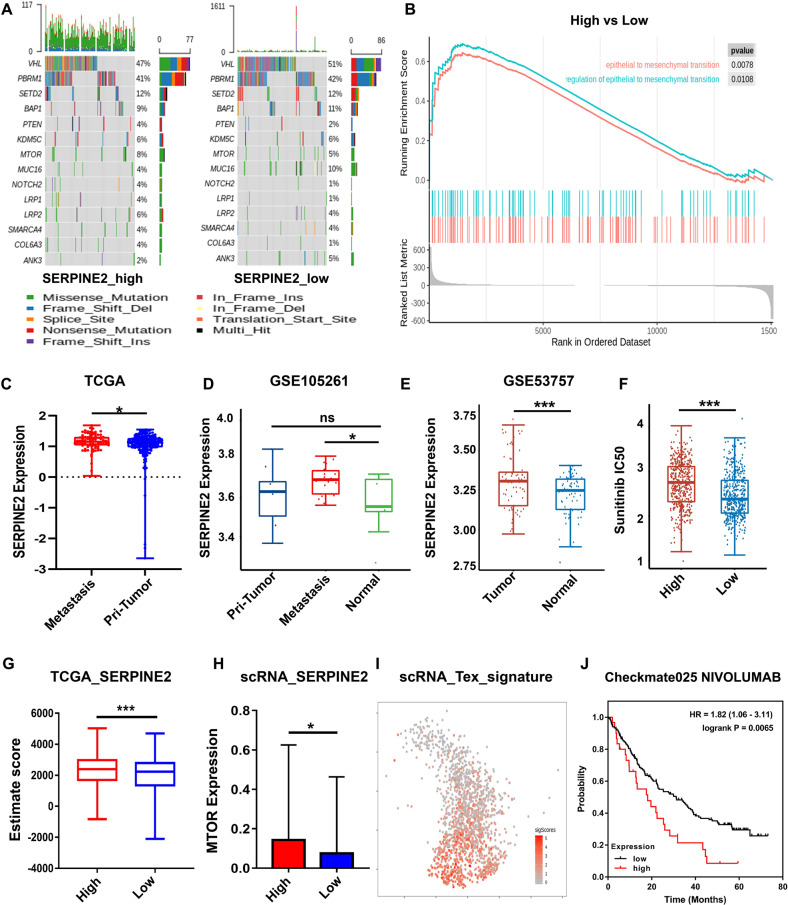
Tumor growth, metastasis and therapeutic response are believed to be regulated by the tumor and its microenvironment (TME) in advanced renal cell carcinoma (RCC). However, the mechanisms underlying genomic, transcriptomic and epigenetic alternations in RCC progression have not been completely defined. In this study, single-cell RNA-sequencing (scRNA-seq) data were obtained from eight tissue samples of RCC patients, including two matched pairs of primary and metastatic sites (lymph nodes), along with Hi-C, transposable accessible chromatin by high-throughput (ATAC-seq) and RNA-sequencing (RNA-seq) between RCC (Caki-1) and human renal tubular epithelial cell line (HK-2). The identified target was verified in clinical tissue samples (microarray of 407 RCC patients, TMA-30 and TMA-2020), whose function was further validated by in vitro and in vivo experiments through knockdown or overexpression. We profiled transcriptomes of 30514 malignant cells, and 14762 non-malignant cells. Comprehensive multi-omics analysis revealed that malignant cells and TME played a key role in RCC. The expression programs of stromal cells and immune cells were consistent among the samples, whereas malignant cells expressed distinct programs associated with hypoxia, cell cycle, epithelial differentiation, and two different metastasis patterns. Comparison of the hierarchical structure showed that SERPINE2 was related to these NNMF expression programs, and at the same time targeted the switched compartment. SERPINE2 was highly expressed in RCC tissues and lowly expressed in para-tumor tissues or HK-2 cell line. SERPINE2 knockdown markedly suppressed RCC cell growth and invasion, while SERPINE2 overexpression dramatically promoted RCC cell metastasis both in vitro and in vivo. In addition, SERPINE2 could activate the epithelial-mesenchymal transition pathway. The above findings demonstrated that the role of distinct expression patterns of malignant cells and TME played a distinct role in RCC progression. SERPINE2 was identified as a potential therapeutic target for inhibiting metastasis in advanced RCC.


Conflict of interest statement

The authors declare no competing interests.

Figures

Fig. 1
Fig. 1. RCC primary and metastatic tumors in scRNA-seq characterization.
A The workflow of the major genomics approach analysis, involving scRNA-seq and 3D Hi-C technique. B The information of patients and tissues for scRNA-seq, including primary tumors from six patients and matched LN metastasis from two of these patients. C The heatmap presents the whole CNVs for all individual cells from RCC primary and metastatic tumors, referenced by non-malignant cells. Red: amplifications; Blue: deletions. D CNV genes are shown as network with gene-set in GO: BP (https://dev.networkanalyst.ca/NetworkAnalyst). E CNV scores of primary (Malignant-pri) and metastatic (Malignant-LN) malignant cells by InferCNV in scRNA-seq analysis. F Bar plot presents the epithelial scores (a global epithelial signature) of distinguished as malignant or non-malignant cells according to CNVs. *p < 0.05; **p < 0.01; ***p < 0.001. RCC renal cell carcinoma.
Fig. 2
Fig. 2. RCC primary and metastatic tumors in scRNA-seq characterization.
A UMAP plot of non-malignant cells, including T cells, endothelial cells, macrophages, B/Plasma cells, NK cells and fibroblasts identified by maker annotations. B Zoomed in UMAP plot of T cell cluster with CD8+ T cells, CD4+ T cells, and Tregs. Marker gens were listed. C Zoomed in UMAP plot of Fibroblasts with CAFs and Myofib. Marker genes are listed. D UMAP plot of malignant cells shows the Malignant 1–6 subsets. E Bubble plot of top 10 genes expression in Malignant 1–6 subsets; the size of bubble represents the percent expressed of cells; the color represents the mean expression level of each gene in clusters: red means the high expression.
Fig. 3
Fig. 3. NNMF clustering characterizing heterogenic malignant cells and identifying metastasis program in RCC tumors.
A The heatmap presents DEGs (rows) identified by NMF, which are clustered by expression in each cell (column) of the representative Malignant 4. The gene signature was identified and indicated on the top. B The heatmap shows the correlations of 60 intratumoral procedures from six malignant subsets. The clustering identified six coherent expression programs across tumors. C The heatmap depicts genes scores by each sample (column) for genes (row) in the Metastasis-II program. D Venn plot shows the number of DEGs (malignant vs. non-malignant cells in scRNA profile) and the top genes in the NNMF program. E The KM survival curve of SERPINE2-high and SERPINE2-low group in TCGC KIRC (Left, n = 530); the SERPINE2 expression between tumor tissues (n = 530) and normal tissues (n = 72) in KIRC (Right). *p < 0.05; **p < 0.01; ***p < 0.001. F Violin plot shows the SERPINE2 expression among Malignant 1–6 subsets. G Violin plot shows the SERPINE2 expression among cells from primary and metastatic tumors and non-malignant subsets. H The comprehensive plot of Caki-1 and HK-2 cells shows the compartment status at the SERPINE2 locus B to A, and this locus at ATAC-seq presents an open status. The red bar represents A compartment; Blue bar represents B compartment. Merge bar represents the compartment status alternations. The Diff_BPM shows all the DEGs between the two cell lines in this chromatin region. I The TAD analysis shows TAD boundaries reforming/disappearing and insulation scores between HK-2 and Caki-1. Red line, for Caki-1; Green line, for HK2. Caki-1 shows lower insulation score than HK-2 do, and new boundary reforms compared with HK-2. DEGs differentially expressed genes.
Fig. 4
Fig. 4. SERPINE2 serves as a metastasis-associated oncogene in RCC and drug response.
A The Oncoprint of conventional marker genes of RCC with alterations in SERPINE2 high and low groups. Tumor mutation burden is represented for individual samples as a bar chart above the oncoprint. B The GSEA plot shows enrichment of EMT-related pathways in SERPINE2 high group in TCGA. FDR < 0.05 is considered as significantly enriched. C SERPINE2 expression between tumor tissues from patients with metastasis (positive N stage or M stage >0, n = 89) and from patients with no metastasis (N stage or M stage = 0, n = 199). Data seen in Table S10. D SERPINE2 expression among primary (n = 9), metastatic tumors (n = 26) and normal tissues (n = 9) in GSE105261. Data were obtained from https://www.aclbi.com/static/index.html#/geo. E SERPINE2 expression between tumors (n = 72) and normal tissues (n = 72) in GSE53757. Data were obtained from https://www.aclbi.com/static/index.html#/geo. F IC50 prediction of sunitinib for SERPINE2 high and low groups in TCGA, based on the GDSC database. G The estimate score of tumor tissues from SERPINE2 high and low groups, reflecting the immune infiltration. H MTOR expression from cells in scRNA-seq analysis (50%: 50%). I UMAP plot shows the terminally exhausted CD8+ T cell signature expression. J The KM survival curve of SERPINE2-high and SERPINE2-low groups in the cohort of clinical trials Checkmate025 with Nivolumab. *p < 0.05; **p < 0.01; ***p < 0.001.
Fig. 5
Fig. 5. SERPINE2 promotes ccRCC progression, accompanied by EMT.
A, B Representative images of transwell assay without or with Matrigel shows the migration and invasion abilities among shCtrl, shSERPINE2#1 and shSERPINE2#2 group in Caki-1 cells, relative change compared with shCtrl group. Scale bar = 100 μm. C, D Representative images of transwell assay without or with Matrigel shows the migration and invasion abilities between Vector, OE-SERPINE2 group in 786-O cell, relative change compared with Vector group. Scale bar = 100 μm. E The cell survival rate among shCtrl, shSERPINE2#1 and shSERPINE2#2 group in Caki-1 cells, relative change compared with shCtrl group. F The cell survival rate among Vector, OE-SERPINE2 group in 786-O cell, relative change compared with Vector group. G Whole body bioluminescence (photons/second) following tail vein injection of cells in mice. Differences occurred from day 7 time point (Green line). H The lung tissue of 786-O-OE-SERPINE2 or 786-O-NC-SERPINE2 of mice; the representative lung metastasis site by HE staining. Scale bar = 500 μm; Scale bar = 50 μm. The IHC results of CA9 and SERPINE2; Scale bar = 50 μm; Scale bar = 20 μm. EMT epithelial-mesenchymal transition.
Fig. 6
Fig. 6. SERPINE2 predicts poor survival and RCC metastasis in our clinical cohort.
A Representative IHC staining and H-score for SERPINE2 in RCC tissues and matched para-tumor tissues (scale bar = 50 μm). B IHC score between tumor tissues and matched para-tumor tissues. C IHC score between tumor tissues from patients with metastasis and no metastasis. D IHC score between patients with stage I, II and stage III, IV. E IHC score between patients with Fuhrman I, II and Fuhrman III, IV. F The ROC curve for SERPINE2 expression in 5-year OS (TMA30 cohort). G The KM curve for OS difference between SERPINE2 high and low groups. H The KM curve for PFS difference between SERPINE2 high and low groups. I The nomogram for 1-, 3- and 5-year OS. OS overall survival, PFS progression-free survival.

References

    1. Barata PC, Rini BI. Treatment of renal cell carcinoma: current status and future directions. CA Cancer J Clin. 2017;67:507–24.. doi: 10.3322/caac.21411. - DOI - PubMed
    1. Dabestani S, Marconi L, Hofmann F, Stewart F, Lam TBL, Canfield SE, et al. Local treatments for metastases of renal cell carcinoma: a systematic review. Lancet Oncol. 2014;15:e549–61.. doi: 10.1016/S1470-2045(14)70235-9. - DOI - PubMed
    1. Hsieh JJ, Purdue MP, Signoretti S, Swanton C, Albiges L, Schmidinger M, et al. Renal cell carcinoma. Nat Rev Dis Prim. 2017;3:17009. doi: 10.1038/nrdp.2017.9. - DOI - PMC - PubMed
    1. Riaz IB, He H, Ryu AJ, Siddiqi R, Naqvi SAA, Yao Y, et al. A living, interactive systematic review and network meta-analysis of first-line treatment of metastatic renal cell carcinoma. Eur Urol. 2021;80:712–23. doi: 10.1016/j.eururo.2021.03.016. - DOI - PubMed
    1. Satcher RL, Zhang XHF. Evolving cancer-niche interactions and therapeutic targets during bone metastasis. Nat Rev Cancer. 2022;22:85–101. doi: 10.1038/s41568-021-00406-5. - DOI - PMC - PubMed

Publication types