. 2023 Jan 16;14(1):246.
doi: 10.1038/s41467-022-35652-0.

Rapidly shifting immunologic landscape and severity of SARS-CoV-2 in the Omicron era in South Africa

Collaborators, Affiliations

Rapidly shifting immunologic landscape and severity of SARS-CoV-2 in the Omicron era in South Africa

Kaiyuan Sun et al. Nat Commun. .

Abstract

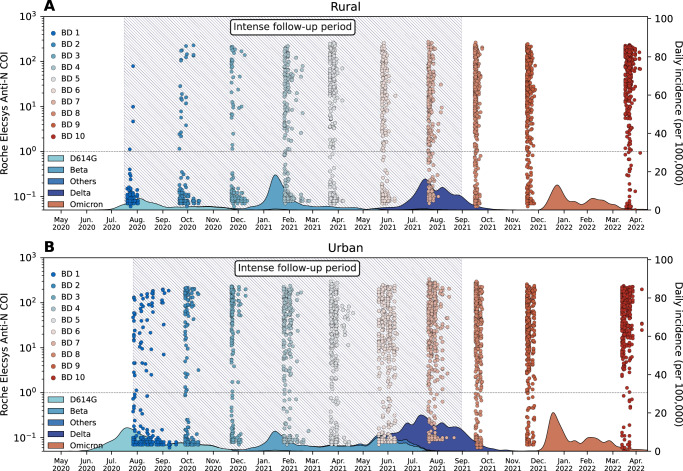
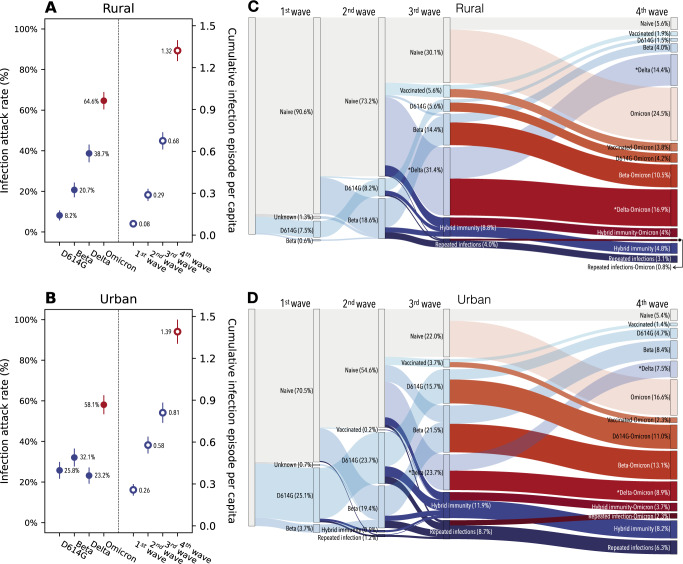
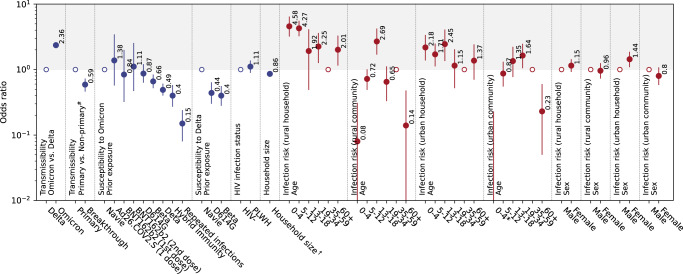
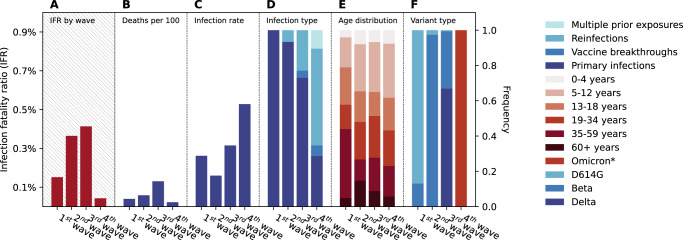
South Africa was among the first countries to detect the SARS-CoV-2 Omicron variant. However, the size of its Omicron BA.1 and BA.2 subvariants (BA.1/2) wave remains poorly understood. We analyzed sequential serum samples collected through a prospective cohort study before, during, and after the Omicron BA.1/2 wave to infer infection rates and monitor changes in the immune histories of participants over time. We found that the Omicron BA.1/2 wave infected more than half of the cohort population, with reinfections and vaccine breakthroughs accounting for > 60% of all infections in both rural and urban sites. After the Omicron BA.1/2 wave, we found few (< 6%) remained naïve to SARS-CoV-2 and the population immunologic landscape is fragmented with diverse infection/immunization histories. Prior infection with the ancestral strain, Beta, and Delta variants provided 13%, 34%, and 51% protection against Omicron BA.1/2 infection, respectively. Hybrid immunity and repeated prior infections reduced the risks of Omicron BA.1/2 infection by 60% and 85% respectively. Our study sheds light on a rapidly shifting landscape of population immunity in the Omicron era and provides context for anticipating the long-term circulation of SARS-CoV-2 in populations no longer naïve to the virus.


Conflict of interest statement

C.C. has received grant support from Sanofi Pasteur, Advanced Vaccine Initiative, and payment of travel costs from Parexel. Av.G. has received grant support from Sanofi Pasteur, Pfizer related to pneumococcal vaccine, C.D.C. and the Bill & Melinda Gates Foundation. N.W. reports grants from Sanofi Pasteur and the Bill & Melinda Gates Foundation. N.A.M. has received a grant to his institution from Pfizer to conduct research in patients with pneumonia and from Roche to collect specimens to assess a novel TB assay. J.M. has received grant support from Sanofi Pasteur. The remaining authors declare no competing interests.

Figures

Fig. 1
Fig. 1. PHIRST-C study June 2020 – April 2022, SARS-CoV-2 serology and epidemiologic curve in the two study sites.
A Serum samples and epidemiologic curve in the rural site. Dots represent the Roche Elecsys Anti-SARS-CoV-2 nucleocapsid assay cutoff index (COI) at different timepoints of the serum specimen collections; Each dot represents one serum specimen collection, with dot color denoting blood draw collection time, from blue (early) to red (late). The shaded curve at the bottom represents the daily incidence of SARS-CoV-2 cases in routine surveillance data collected from the Ehlanzeni District, Mpumalanga Province. Colors of the shaded curve represent different variant types. Here, blood draw (BD) 10 was collected at the end of the first Omicron wave. Since in South Africa, Omicron BA.4 and BA.5 only started to rise at April, 2022, we assume the Omicron wave prior to BD 10 were BA.1 and BA.2 subvariants. The hatched area represents the period of intense follow-up of the PHIRST-C cohort, when nasal swabs were collected and tested on rRT-PCR at twice-a-week frequency. B Same as (A) but for the urban site, with shaded curve at the bottom representing routine surveillance data collected from the Dr. Kenneth Kaunda District, North West Province. BD Blood draw.
Fig. 2
Fig. 2. SARS-CoV-2 infection attack rates and shifts in immunologic landscape.
A Infection attack rates in the rural site by variant type (left) and the cumulative number of infection episodes per capita after each epidemic wave (right), based on n = 905 participants. Dots and lines represent mean and 95% confidence intervals. The end of the 1st wave is marked by blood draw 2, 2nd wave is marked by blood draw 5, 3rd wave is marked by blood draw 8, 4th wave is marked by blood draw 10. B Same as (A) but for the urban site. C Sankey diagram demonstrating the distribution of different type of immunologic exposures (including vaccination and infection) in the population of the rural site after each epidemic wave and the transition of immunologic exposures in-between waves. In the Sankey diagram, rectangular nodes of the same color represent proportion of population of a given immunologic state: gray color represents SARS-CoV-2 immunologic naïve individuals; blue shades represent non-Omicron exposures; red shades represent Omicron exposures; darker colors represent repeat exposures while transparent shading represents primary exposures. Each column of nodes represented the distribution of immunologic state within the cohort population post a given epidemic wave. The vertical height of a node is proportional to the fraction of the population with the specific immunity. The band connecting nodes between waves represent the fraction of population (proportion to band width) transitioning from one immunologic state to another due to the impact of the epidemic wave of interest. D same as (C) but for the urban site. *In additional to Delta, here also includes other less frequent lineages including other lineages including Alpha and C.1.2 variants.
Fig. 3
Fig. 3. Risk factors associated with SARS-CoV-2 Omicron BA.1/2 and Delta infection.
Odds ratios (adjusted after controlling for other risk factors, see Methods Section 4 for details) were estimated by a chain-binomial model fitted to the infection outcome of n = 905 participants, where the Omicron BA.1/2 and Delta infections was inferred by the serologic approach. Empty circles are reference classes. Solid dots and lines represent maximum likelihood estimate and 95% confidence intervals. Abbreviation: PLWH: persons living with HIV. Category “Unknown” for “HIV infection status” and category “Rest” in “Prior exposure” (Table 1) were included in the model but omitted here due to small sample size in the strata. *0-4 age group have odds ratio point estimate less than 0.01, thus not shown in the figure. #Non-primary infections represent repeat/breakthrough infections. Household size denotes the number of household members within a household and is analyzed as a continuous variable.
Fig. 4
Fig. 4. The infection fatality ratios and the factors associated with SARS-CoV-2 disease severity for different epidemic waves in the urban site’s district.
A The estimated infection fatality ratio for each epidemic wave. B The mortality burden of each epidemic wave measured by the cumulative rate of in-hospital deaths per 100 individuals. C The infection attack rate of each epidemic wave in the North West based on the PHIRST-C urban cohort, assuming that the urban cohort population is representative of the population of the North West Province. D The wave-specific distribution of infection types based on prior exposure histories, including primary infection, vaccine breakthroughs (1 or 2 doses of vaccines), reinfections (infection after one prior infection), and multiple prior exposures (infection with two or more prior infections or a mixture of prior infection and vaccination). E The wave-specific age distribution of infections. F The wave-specific distribution of variant type among infections. BF Share the same axis on the right. *For the 4th wave, we could not confirm variant type by variant-specific rRT-PCR or sequencing, however, judging from the timing of emergence and dominance of Omicron in South Africa in late November 2021, we assumed here that all infections during the 4th wave were due to Omicron BA.1/2 variants.

Update of

References

    1. Tracking SARS-CoV-2 variants, (available at https://www.who.int/activities/tracking-SARS-CoV-2-variants).
    1. CoVariants, (available at https://covariants.org/).
    1. Obermeyer F, et al. Analysis of 6.4 million SARS-CoV-2 genomes identifies mutations associated with fitness. Science. 2022;376:1327–1332. doi: 10.1126/science.abm1208. - DOI - PMC - PubMed
    1. Telenti, A., Hodcroft, E. B., Robertson, D. L. The Evolution and Biology of SARS-CoV-2 Variants. Cold Spring Harb. Perspect. Med. 12 (2022), 10.1101/cshperspect.a041390. - PMC - PubMed
    1. the Nextstrain team, Genomic epidemiology of novel coronavirus - Global subsampling. Nextstrainhttps://nextstrain.org/ncov/gisaid/global (2022).

Publication types

Supplementary concepts