. 2023 Jan 16;9(1):4.
doi: 10.1038/s41531-023-00444-w.

Dynamic physiological α-synuclein S129 phosphorylation is driven by neuronal activity

Affiliations

Dynamic physiological α-synuclein S129 phosphorylation is driven by neuronal activity

Nagendran Ramalingam et al. NPJ Parkinsons Dis. .

Abstract

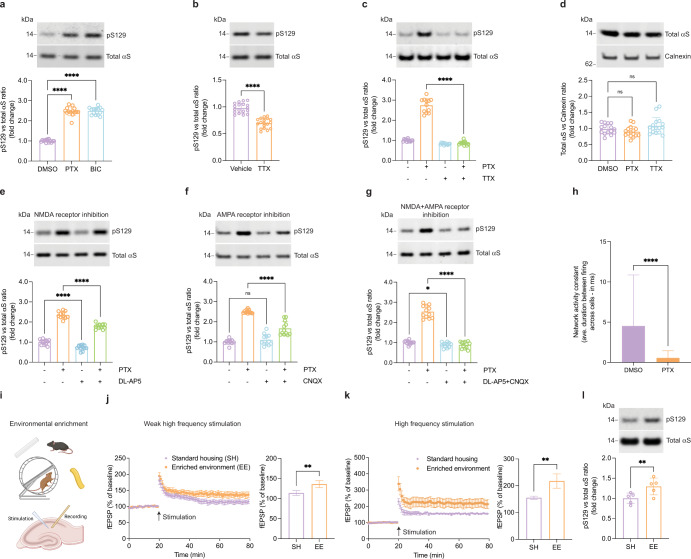
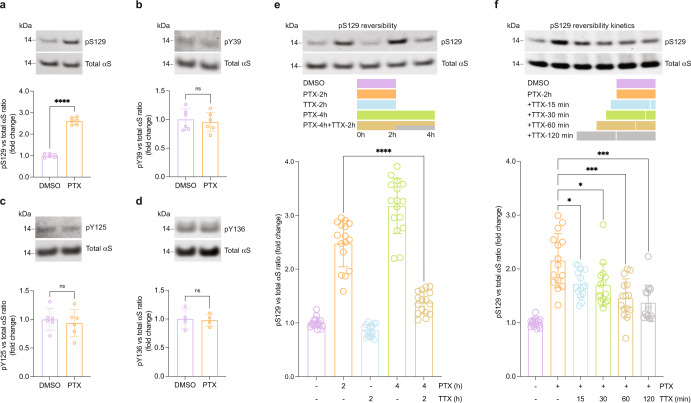
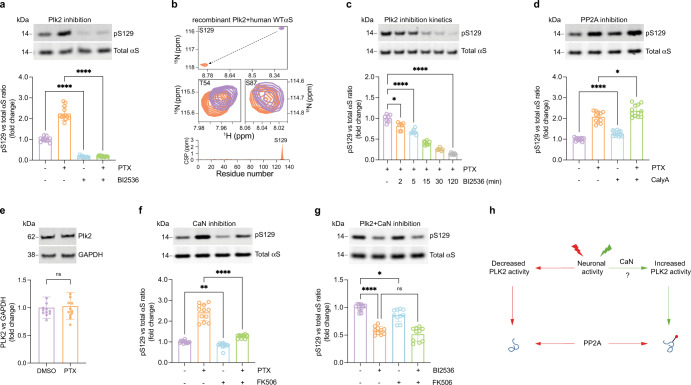
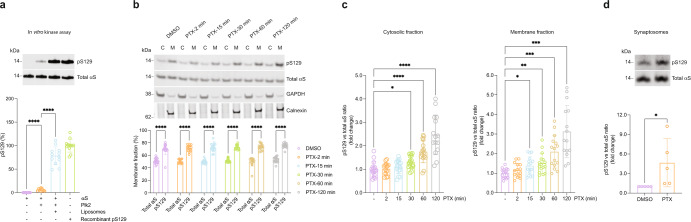
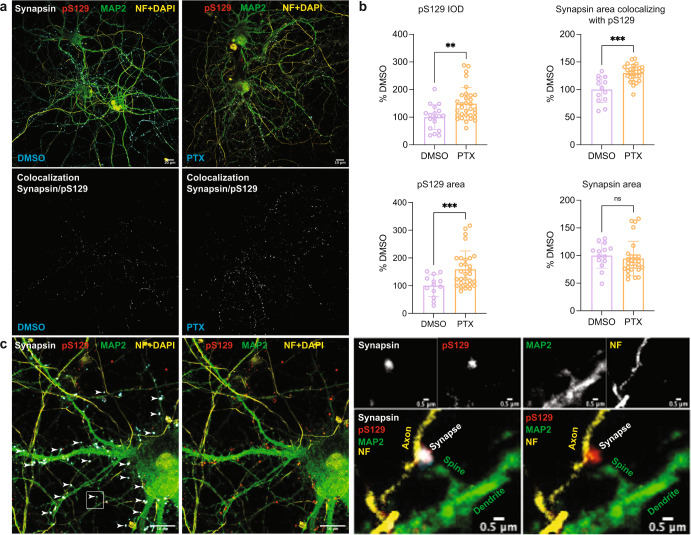
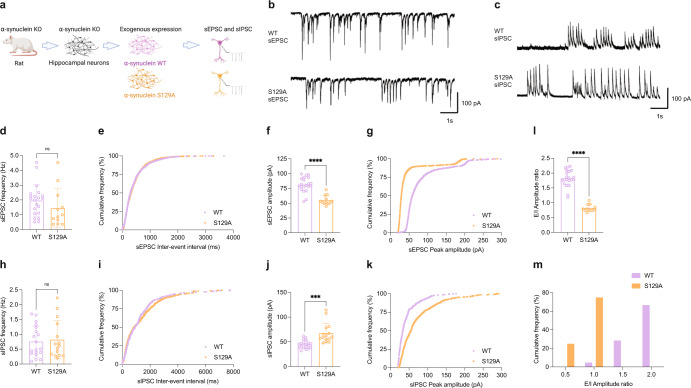
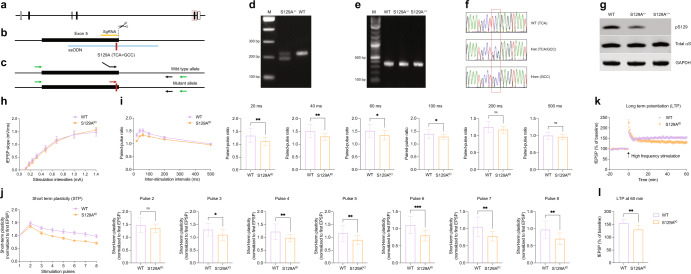
In Parkinson's disease and other synucleinopathies, the elevation of α-synuclein phosphorylated at Serine129 (pS129) is a widely cited marker of pathology. However, the physiological role for pS129 has remained undefined. Here we use multiple approaches to show for the first time that pS129 functions as a physiological regulator of neuronal activity. Neuronal activity triggers a sustained increase of pS129 in cultured neurons (200% within 4 h). In accord, brain pS129 is elevated in environmentally enriched mice exhibiting enhanced long-term potentiation. Activity-dependent α-synuclein phosphorylation is S129-specific, reversible, confers no cytotoxicity, and accumulates at synapsin-containing presynaptic boutons. Mechanistically, our findings are consistent with a model in which neuronal stimulation enhances Plk2 kinase activity via a calcium/calcineurin pathway to counteract PP2A phosphatase activity for efficient phosphorylation of membrane-bound α-synuclein. Patch clamping of rat SNCA-/- neurons expressing exogenous wild-type or phospho-incompetent (S129A) α-synuclein suggests that pS129 fine-tunes the balance between excitatory and inhibitory neuronal currents. Consistently, our novel S129A knock-in (S129AKI) mice exhibit impaired hippocampal plasticity. The discovery of a key physiological function for pS129 has implications for understanding the role of α-synuclein in neurotransmission and adds nuance to the interpretation of pS129 as a synucleinopathy biomarker.


Conflict of interest statement

D.J.S. is a director and consultant to Prothena Biosciences. W.V.C. is the CEO of Leveragen. The other authors declare no competing financial or non-financial interests.

Figures

Fig. 1
Fig. 1. pS129 correlates with neuronal activity.
a DIV17–21 rat cortical neurons treated with the GABAA receptor antagonists picrotoxin (PTX, 20 µM) or bicuculline (BIC, 20 µM) for 2 h. WB for total αS and pS129. N = 3 independent experiments on different days, n = 14 biological replicates total. ****p < 0.0001. Mean +/− SD. Brown-Forsythe and Welch ANOVA with Dunnett’s T3 post hoc test for multiple comparisons. b DIV17-21 rat cortical neurons treated with vehicle or the sodium channel blocker tetrodotoxin (TTX, 1 µM). WB for total αS and pS129. N = 3 independent experiments on different days, n = 18 biological replicates total. ****p < 0.0001. Mean +/− SD. Unpaired t-tests with Welch’s correction; two-tailed. c DIV17-21 rat cortical neurons treated with PTX (20 µM), TTX (1 µM), or PTX + TTX. WB for total αS and pS129. N = 3 independent experiments on different days, n = 18 biological replicates total. ****p < 0.0001. Mean +/− SD. Brown-Forsythe and Welch ANOVA with Dunnett’s T3 post hoc test for multiple comparisons. d DIV17-21 rat cortical neurons treated with 20 µM PTX or 1 µM TTX for 2 h. WB for total αS and Calnexin (loading control). N = 2 independent experiments on different days, n = 16 biological replicates total. ns not significant. Mean +/− SD. Brown-Forsythe and Welch ANOVA with Dunnett’s T3 post hoc test for multiple comparisons. e DIV17-21 rat cortical neurons treated with 20 µM PTX, 25 µM DL-AP5 (NMDA receptor antagonist) or PTX + DL-AP5 for 2 h. WB for total αS and pS129. N = 3 independent experiments on different days, n = 12 biological replicates total; ***p < 0.001; ****p < 0.0001. Mean +/− SD. Brown-Forsythe and Welch ANOVA with Dunnett’s T3 post hoc test for multiple comparisons. f DIV17-21 rat cortical neurons treated with 20 µM PTX, 10 µM CNQX (AMPA receptor antagonist) or PTX + CNQX for 2 h. WB for total αS and pS129. N = 3 independent experiments on different days, n = 12 biological replicates total; ****p < 0.0001; ns not significant. Mean +/− SD. Brown-Forsythe and Welch ANOVA with Dunnett’s T3 post hoc test for multiple comparisons. g DIV17-21 rat cortical neurons treated with PTX, DL-AP5 + CNQX or PTX + DL-AP5 + CNQX for 2 h. WB for total αS and pS129. N = 3 independent experiments on different days, n = 12 biological replicates total; *p < 0.1; ****p < 0.0001; ns not significant. Mean +/− SD. Brown-Forsythe and Welch ANOVA with Dunnett’s T3 post hoc test for multiple comparisons. h Network activity constant of calcium transients, as expressed by inter-event interval between and across cells. N = 95 individual events for DMSO, N = 74 individual events for PTX. ****p < 0.0001. Mean +/− SD. Welch’s t-test; two-tailed. A total of 20 individual cells analyzed from one of the three independent experiments performed on different days. Time lapse movies related to this panel can be viewed in supplementary section—Supplementary Movie 2 (DMSO) and 3 (PTX). i Schematics of environmental enrichment and slice recording (created with BioRender.com). j LTP measurements in mouse hippocampal slices, weak high frequency stimulation. Mice kept under standard housing (SH) vs. enriched environment (EE). N = 5 hippocampal slices. **p < 0.002; Mean +/− SD. Unpaired t-test, two-tailed. k Analogous to j, but standard high-frequency stimulation (HFS). N = 5 hippocampal slices. **p < 0.002; Mean +/− SD. Unpaired t-test, two-tailed. l EE vs. SH mice: WB for total αS and pS129. N = 5 pairs of animals. **p < 0.002; Mean +/− SD. Paired t-test; two-tailed. A time lapse movie of mice training in the environmentally enriched cage can be viewed in supplementary section—Supplementary Movie 1.
Fig. 2
Fig. 2. Activity-dependent αS phosphorylation is S129-specific and reversible.
ad DIV17-21 rat cortical neurons treated with 20 µM PTX for 2 h. WB for total αS and indicated phospho-sites. N = 6 (ac) or 4 (d) independent experiments on different days. ****p < 0.0001; ns not significant. Mean +/− SD. Paired t-tests; two-tailed. e Reversible pS129 triggered by neuronal activity in DIV17-21 rat cortical neurons as indicated in the schematic (20 µM PTX, 1 µM TTX). WB for total αS and pS129. N = 4 independent experiments on different days, n = 16 biological replicates total; ****p < 0.0001. Mean +/− SD. Brown-Forsythe and Welch ANOVA with Dunnett’s T3 post hoc test for multiple comparisons. f Kinetics of reversible pS129 in DIV17-21 rat cortical neurons as indicated in the schematic (20 µM PTX, 1 µM TTX). WB for total αS and pS129. N = 5 independent experiments on different days, n = 15 biological replicates total; *p < 0.1; ***p < 0.001. Mean +/− SD. Brown-Forsythe and Welch ANOVA with Dunnett’s T3 post hoc test for multiple comparisons.
Fig. 3
Fig. 3. Activity-dependent pS129 is regulated by Plk2, PP2A, and calcineurin.
a DIV17-21 rat cortical neurons treated with 20 µM PTX, 500 nM BI2536 (Plk2 inhibitor) or PTX + BI2536 for 2 h. WB for total αS and pS129. N = 3 independent experiments on different days, n = 12 biological replicates total. *p < 0.1; ****p < 0.0001. Mean +/− SD. Brown-Forsythe and Welch ANOVA with Dunnett’s T3 post hoc test for multiple comparisons. b 2D 1H-15N HSQC NMR spectrum of recombinant, N-terminally acetylated human αS in the presence (orange) or absence (purple) of recombinant Plk2 (see “Methods” for details and Supplementary Fig. 4). Spectrum in the presence (purple) or absence of Plk2 (orange) is shown for S129 (top), T54, and S87 (middle); residue-resolved combined chemical shift perturbations (CSPs) of backbone amide resonances (bottom). c DIV17-21 rat cortical neurons treated with 20 µM PTX for 2 h and 500 nM BI2536 co-administered for 0, 2, 5, 15, 30, or 120 min. WB for total αS and pS129. N = 2 independent experiments on different days, n = 7 biological replicates total. *p < 0.1; ****p < 0.0001. Mean +/− SD. Brown-Forsythe and Welch ANOVA with Dunnett’s T3 post hoc test for multiple comparisons. d 1.5 nM PP2A inhibitor calyculin A (Caly A) treatment for 2 h. WB for total αS and pS129. N = 3 independent experiments on different days, n = 12 biological replicates total. ***p < 0.1; ****p < 0.0001. Mean +/− SD. Brown-Forsythe and Welch ANOVA with Dunnett’s T3 post hoc test for multiple comparisons. e DIV17-21 rat cortical neurons treated with 20 µM PTX or DMSO control for 2 h. WB for PLK2 and GAPDH (loading control). N = 3 independent experiments on different days, n = 12 biological replicates. ns not significant. Mean +/− SD. Unpaired t-test, Welch’s correction; two-tailed. f DIV17-21 rat cortical neurons treated with DMSO, 20 µM PTX, 2 µM CaN inhibitor FK506, or both for 2 h. WBs to total αS and pS129. N = 3 independent experiments on different days, n = 12 biological replicates total. **p < 0.01; ****p < 0.0001. Mean +/− SD. Brown-Forsythe and Welch ANOVA with Dunnett’s T3 post hoc test for multiple comparisons. g DIV18 rat cortical neurons treated with 50 nM Plk2 inhibitor BI2536, 2 µM CaN inhibitor FK506, or both for 2 h. WB for total αS and pS129. N = 3 independent experiments on different days, n = 10 biological replicates total. ns not significant; **p < 0.01; ****p < 0.0001. Mean +/− SD. Brown-Forsythe and Welch ANOVA with Dunnett’s T3 post hoc test for multiple comparisons. h Schematic: the molecular cascade leading to activity-dependent pS129 (see main text for details).
Fig. 4
Fig. 4. Activity-induced pS129 is enriched in membrane fractions.
a In vitro kinase assay was carried out by incubating 2 µM recombinant αS alone, αS + 2 µM Plk2, and αS + Plk2 + 0.2 mM liposomes. N = 3 independent experiments on different days, n = 12 biological replicates total; ****p < 0.0001. Mean +/− SD. RM one-way ANOVA with post hoc Sidak’s multiple comparisons test. b DIV18-20 rat cortical neurons treated with 20 µM PTX for the indicated time points and subjected to sequential extraction to generate cytosol (C) vs. membrane (M) protein lysates. WB for total αS and pS129. Quantification of total αS and pS129 in membrane fractions. N = 4 independent experiments on different days, n = 16 biological replicates total. ****p < 0.0001. Mean +/− SD. Two-way ANOVA with post hoc Tukey’s multiple comparisons test. c Samples as in b. Quantification of total αS vs pS129 ratios as indicated in cytosolic and membrane fractions, respectively. *p < 0.05; **p < 0.01; ***p < 0.001; ****p < 0.0001. Mean +/− SD. Brown-Forsythe and Welch ANOVA with Dunnett’s T3 post hoc test for multiple comparisons. d DIV18-21 rat cortical neurons treated with DMSO or 20 µM PTX followed by isolation of synaptosomes. WBs for total αS and pS129. N = 6 independent experiments on different days. *p < 0.04. Mean +/− SD. Ratio paired t-test; two-tailed.
Fig. 5
Fig. 5. Increased pS129 signal and localization in synapsin-containing boutons after PTX stimulation.
a Representative images of synapsin/pS129 colocalization in DIV18 rat cortical neurons treated with DMSO vs. 20 µM PTX. Top images: synapsin, pS129, MAP2, and neurofilament (NF) + DAPI staining. DMSO control on the left, PTX treatment on the right. Bottom images: colocalization mask synapsin/pS129. DMSO control on the left, PTX treatment on the right. Scale bar, 10 μm. b Quantifications (DMSO vs. PTX). Top left, pS129 integrated optical density (IOD). Quantification of N = 14 images for DMSO; N = 30 images for PTX. Top right, synapsin area colocalizing with pS129. N = 13 images for DMSO; N = 29 images for PTX. Bottom left, pS129 area. N = 13 images for DMSO; N = 30 images for PTX. Bottom right, synapsin area. N = 14 images for DMSO; N = 30 images for PTX. Each image contained ~3–5 cells. **p < 0.01; ***p < 0.001; ns not significant. Mean ± SD. Unpaired t-tests with Welch’s correction; two-tailed. c Localization of pS129 at synapsin-immunopositive synapses in PTX-stimulated neurons. Arrowheads indicate synapses labeled for both pS129 and synapsin. All visualized images represent maximized 3D projection of 0.9 µm thick z-stacks. Scale bars in the left images, 10 µm; scale bars in the right images, 0.5 µm. Magnifications on the right: specific colocalization of pS129 with synapsin at presynaptic terminals in contrast to MAP2 positive dendritic profiles.
Fig. 6
Fig. 6. Phospho-deficient S129A αS reduces the excitatory/inhibitory balance in rat SNCA−/− hippocampal neurons.
a Spontaneous excitatory (sEPSC) and inhibitory postsynaptic currents (sIPSC) measured in DIV14-18 hippocampal neurons from SNCA−/− rats transduced with αS WT or αS S129A (schematics created with BioRender.com). b Representative sEPSC traces. c Representative sIPSC traces. Scale bars, X-axis = 1 s and Y-axis = 100 pA. d sEPSC frequency in SNCA−/− neurons expressing WT αS or αS S129A. e Cumulative frequency distribution of data shown in d, expressed as percentage. f sEPSC amplitude in SNCA−/− neurons expressing αS WT or αS S129A. g Cumulative frequency distribution plot of data shown in f, expressed as percentage. Total number of individual events analyzed in panels e and g: αS WT = 1228; αS S129A = 1701. Total number of individual cells across two independent neuronal cultures (N = 2) recorded in sEPSC experiments: WT αS = 21 and αS S129A  n = 12. h, i sIPSC frequency between conditions as bar charts and cumulative distribution, respectively. j sIPSC amplitude in SNCA−/− neurons expressing WT or S129A αS. k Cumulative frequency distribution of data shown in j. Total number of individual events analyzed in panels i and k: αS WT = 302; αS S129A = 585. Total number of individual cells across two independent neuronal cultures recorded in sIPSC experiments: αS WT = 19 and αS S129A = 15. l, m The excitatory/inhibitory ratio of the amplitude as a bar chart and cumulative frequency distribution, respectively. E/I amplitude ratios were derived from f and j. Respective averages in f (αS WT or αS S129A) were divided by respective individual values (αS WT or αS S129A) in j to obtain E/I amplitude ratios. Each circle represents an individual cell. Recordings performed on at least three different days. Unpaired t-tests with Welch’s correction; two-tailed; mean ± SD; ns not significant; ***p < 0.001; ****p < 0.0001.
Fig. 7
Fig. 7. Synaptic plasticity is impaired in S129AKI mouse.
af Generation of the S129A knock-in mutation in mice. a Genomic structure of the mouse SNCA gene. Exons are depicted after transcript variant SNCA-201 (ENSMUST00000114268.5), with coding and non-coding regions shown as filled or open boxes, respectively. Exon 5 is boxed with red dashed line. b A knock-in strategy using CRISPR-Cas9 and ssODN was employed to generate the S129A mutation in Exon 5 of the endogenous SNCA gene. Relative positions of sgRNA (orange horizontal line), ssODN (blue horizontal line), and the S129A mutation (red vertical line) are indicated. cf ES cell clone screening and mouse genotyping. A 3-primer PCR strategy (primers indicated with black and red arrows) was designed to distinguish WT and mutant alleles (c, d). For genotyping, a common pair of primers (indicated with green arrows) was used for PCR followed by sequencing to distinguish different genotypes (c, e, f). g Total mouse brain homogenates from indicated genotypes. WB for total αS, pS129 (D1R1R) and GAPDH. h Input and out current curve from hippocampal slices (CA1 region) of indicated mouse genotypes. N = 3 animals each, n = 16 (WT) or 17 (S129AKI) individual slices. i Paired-pulse facilitation of WT and S129AKI hippocampal slices. Inter-stimulation intervals as indicated. N = 3 animals each, n = 16 (WT) or 17 (S129AKI) individual slices. Unpaired t-tests for 20, 40, 60, 100, 200, and 500 ms with Welch’s correction; two-tailed; mean ± SD; ns not significant; *p < 0.05; **p < 0.01. j Short-term plasticity assessed by multi-pulse events. Values normalized to first excitatory post synaptic current (EPSP). N = 3 animals each, n = 16 (WT) or 17 (S129AKI) individual slices. Unpaired t-tests for pulses 2, 3, 4, 5, 6, 7, and 8 with Welch’s correction; two-tailed; mean ± SD; ns not significant; *p < 0.05; **p < 0.01; ***p < 0.001. k, l Long Term Potentiation (LTP) of WT and S129AKI. LTP induced by standard 100 Hz stimulation. N = 3 animals each, n = 8 (WT) or 10 (S129AKI) individual slices. Unpaired t-tests for panel l (values at 60 min from K) with Welch’s correction; two-tailed; mean ± SD; **p < 0.01.

References

    1. Fujiwara H, et al. alpha-Synuclein is phosphorylated in synucleinopathy lesions. Nat. Cell Biol. 2002;4:160–164. doi: 10.1038/ncb748. - DOI - PubMed
    1. Paleologou KE, et al. Phosphorylation at Ser-129 but not the phosphomimics S129E/D inhibits the fibrillation of alpha-synuclein. J. Biol. Chem. 2008;283:16895–16905. doi: 10.1074/jbc.M800747200. - DOI - PMC - PubMed
    1. Walker DG, et al. Changes in properties of serine 129 phosphorylated α-synuclein with progression of Lewy-type histopathology in human brains. Exp. Neurol. 2013;240:190–204. doi: 10.1016/j.expneurol.2012.11.020. - DOI - PMC - PubMed
    1. Ma MR, Hu ZW, Zhao YF, Chen YX, Li YM. Phosphorylation induces distinct alpha-synuclein strain formation. Sci. Rep. 2016;6:1–11. - PMC - PubMed
    1. Zhang, S. et al. LK6/Mnk2a is a new kinase of alpha synuclein phosphorylation mediating neurodegeneration. Sci. Rep. 10.1038/srep12564 (2015). - PMC - PubMed