. 2023 Jan 17;14(1):251.
doi: 10.1038/s41467-022-35348-5.

Expansion of interferon inducible gene pool via USP18 inhibition promotes cancer cell pyroptosis

Affiliations

Expansion of interferon inducible gene pool via USP18 inhibition promotes cancer cell pyroptosis

Kei-Ichiro Arimoto et al. Nat Commun. .

Abstract

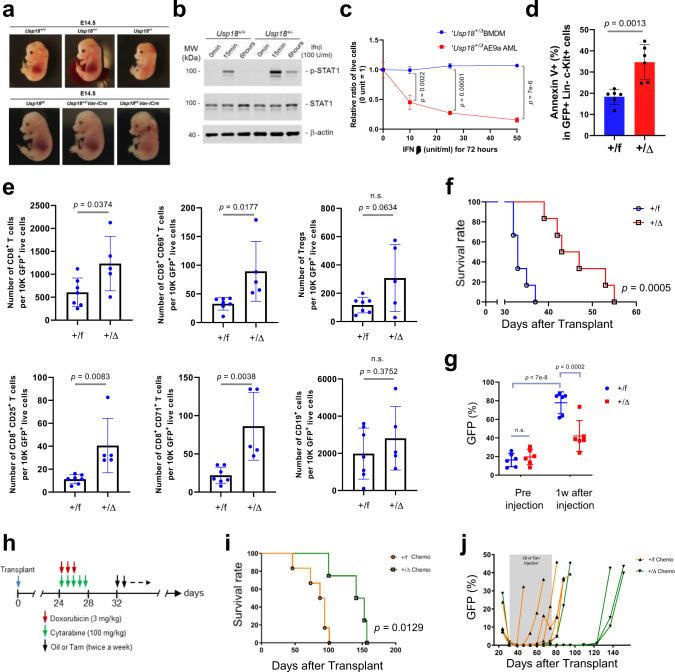
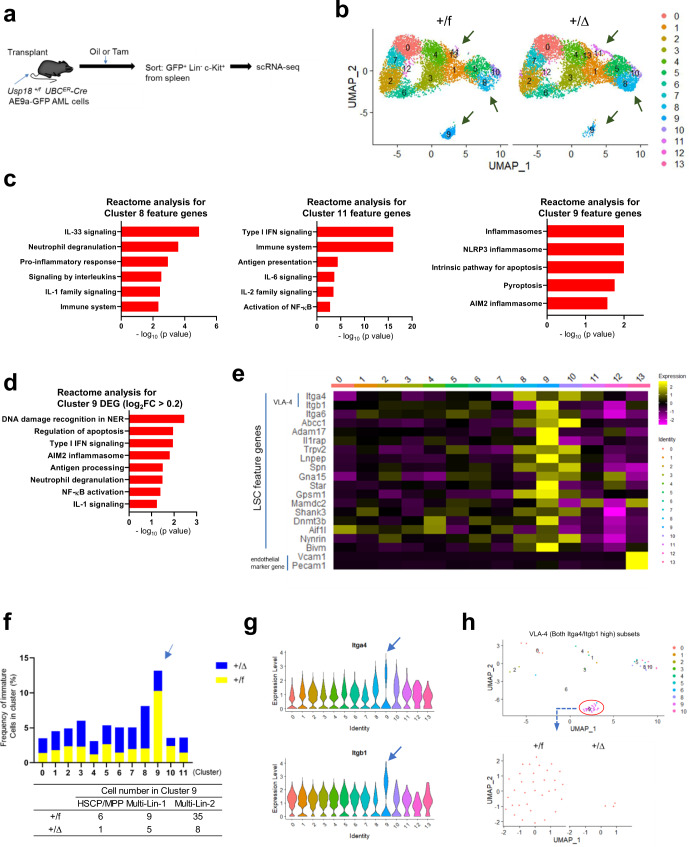
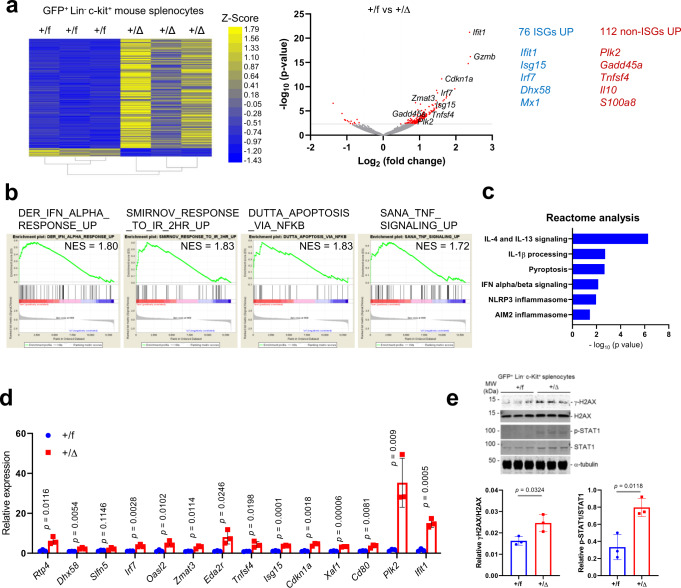
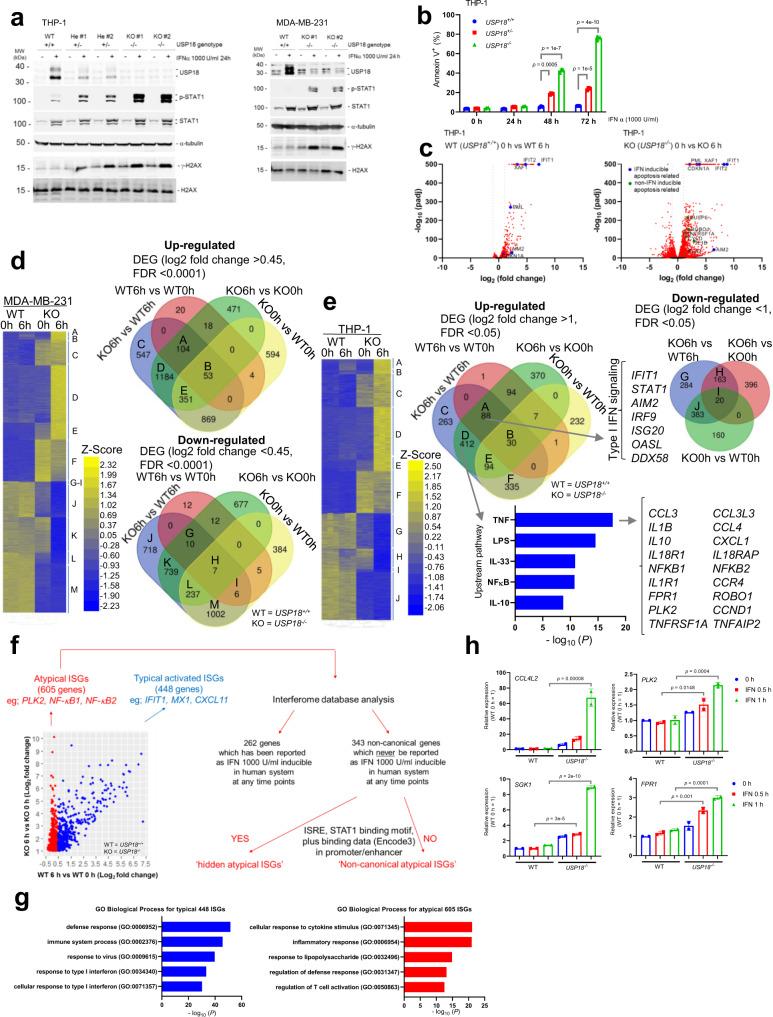
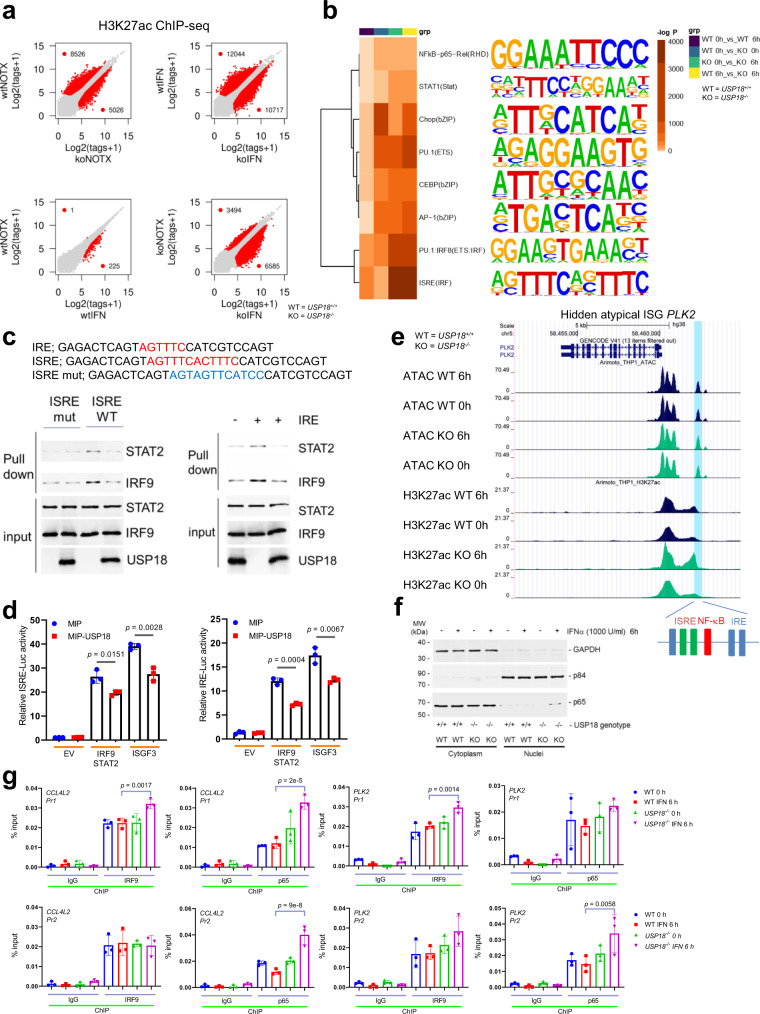
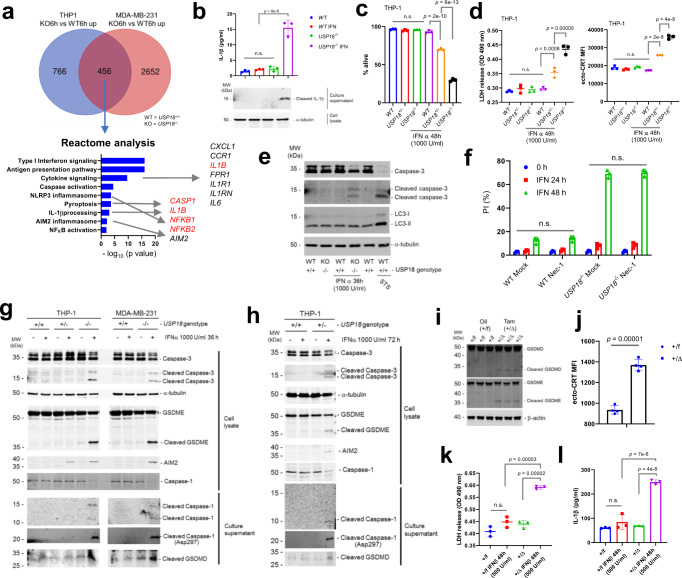
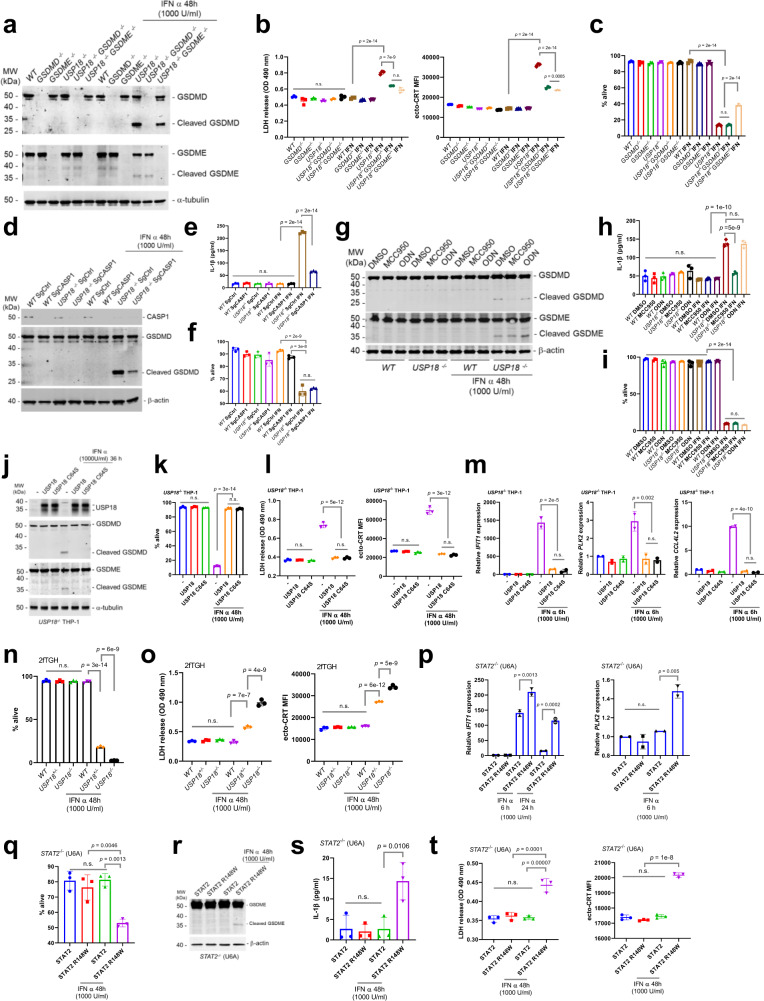
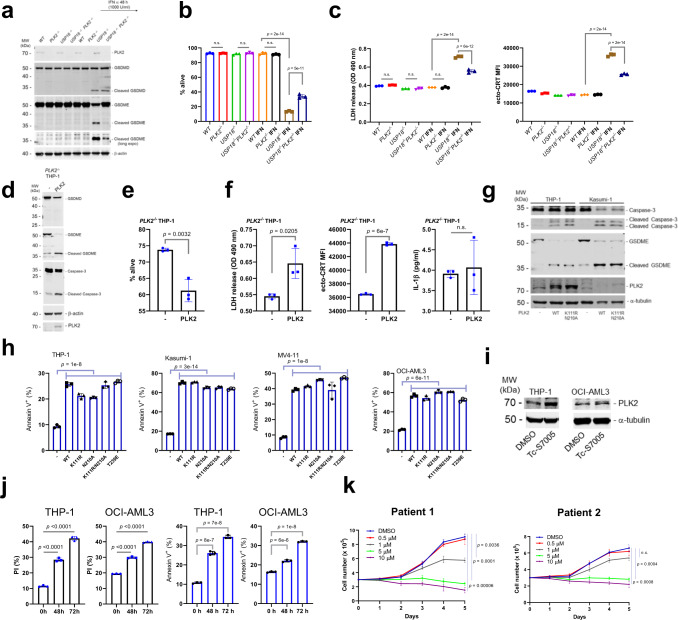
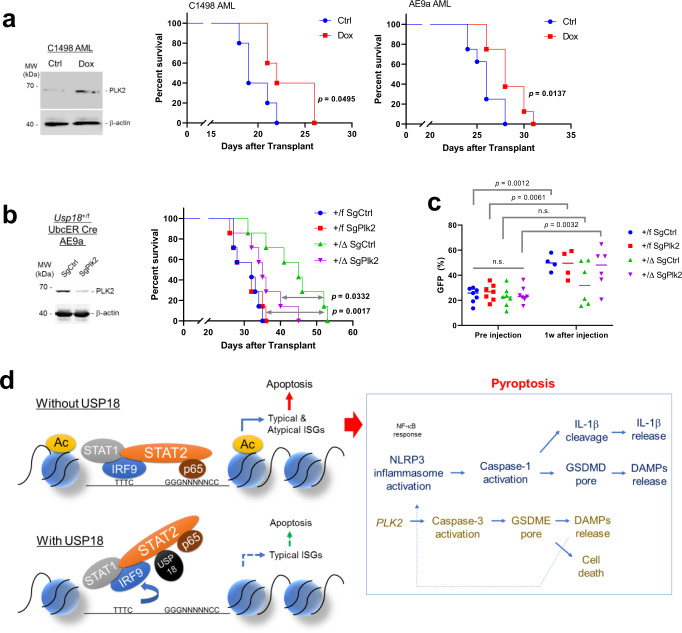
While immunotherapy has emerged as a breakthrough cancer therapy, it is only effective in some patients, indicating the need of alternative therapeutic strategies. Induction of cancer immunogenic cell death (ICD) is one promising way to elicit potent adaptive immune responses against tumor-associated antigens. Type I interferon (IFN) is well known to play important roles in different aspects of immune responses, including modulating ICD in anti-tumor action. However, how to expand IFN effect in promoting ICD responses has not been addressed. Here we show that depletion of ubiquitin specific protease 18 (USP18), a negative regulator of IFN signaling, selectively induces cancer cell ICD. Lower USP18 expression correlates with better survival across human selected cancer types and delays cancer progression in mouse models. Mechanistically, nuclear USP18 controls the enhancer landscape of cancer cells and diminishes STAT2-mediated transcription complex binding to IFN-responsive elements. Consequently, USP18 suppression not only enhances expression of canonical IFN-stimulated genes (ISGs), but also activates the expression of a set of atypical ISGs and NF-κB target genes, including genes such as Polo like kinase 2 (PLK2), that induce cancer pyroptosis. These findings may support the use of targeting USP18 as a potential cancer immunotherapy.


Conflict of interest statement

The authors declare no competing interests.

Figures

Fig. 1
Fig. 1. Reduction of Usp18 delays cancer progression.
a Representative pictures of embryos (E14.5) of Usp18+/+, Usp18+/−, and Usp18−/− (Top) and Usp18f/f, Usp18+/f Vav-iCre, and Usp18f/f Vav-iCre (Bottom) mice. b Western blots showing phosphorylated and total STAT1 protein and β-actin in Usp18 WT and Heterozygous bone marrows. c Ratio of live cells from Usp18+/Δ BMDM or Usp18+/Δ AE9a cells treated with different doses of IFNβ for 72 h in one representative set of three independent repeats. p-value was determined by one-way ANOVA test. (Usp18+/Δ BMDM n = 3, Usp18+/Δ AE9a n = 3). d Percentage of Annexin V+ GFP+Linc-Kit+ splenocytes from Usp18+/f and Usp18+/Δ AE9a recipient mice as analyzed by FACS. p-value was determined by two-tailed Student t-test. (Usp18+/f n = 6 mice, Usp18+/Δ n = 6 mice). e Absolute numbers of CD8+, activated T cells (CD8+/CD69+, CD8+/CD25+, CD8+/CD71+), Tregs (CD4+CD25+Foxp3+) and B cells (CD19+) in viable host splenocytes per 10,000 GFP+ cells from Usp18+/f and Usp18+/Δ AE9a recipient mice. Information on other immune cell populations is also shown in source data. P-value was determined by two-tailed Student t-test. (Usp18+/f n = 7 mice, Usp18+/Δ n = 5 mice). f Kaplan–Meier survival curve for recipients of Usp18+/f or +/Δ UBCER-Cre AE9a-GFP AMLs. p-value was determined by log-rank test. (Usp18+/f n = 6 mice, Usp18+/Δ n = 6 mice). g Percentage of GFP+ cells in the PB of mice from (f). p-value was determined by one-way ANOVA test. h Timeline of treatments combining chemotherapy with heterozygous deletion of Usp18 to treat AML. i Kaplan–Meier survival curve for mice treated as in (h). (Oil (+/f) n = 6 mice, Tam (+/Δ) n = 4 mice). p-value was determined by log-rank test. j Percentage of GFP+ cells in the PB of mice from (i), analyzed weekly by FACS. All data represent mean ± s.d, except where indicated. n.s. = not statistically significant. Source data are provided as a Source Data file.
Fig. 2
Fig. 2. Reduced Usp18 expression results in loss of niche resident LSCs.
a Single cell RNA-seq experimental design. GFP+Linc-Kit+ cells from Usp18+/f and Usp18+/Δ AE9a recipient mice (Usp18+/f n = 3 mice, Usp18+/Δ n = 3 mice) were sorted and pooled, and then scRNA-seq was performed. b UMAP of sorted GFP+Linc-Kit+ cells from Usp18+/f and Usp18+/Δ AE9a recipient mice. Allows indicate the clusters that significantly changed by Usp18 depletion. Arrows indicate clusters 8, 9, and 11. c Reactome analyses for feature genes of clusters 8, 9, and 11. d Reactome analysis for differentially expressed genes (DEG) in cluster 9. e Expression heat map for LSC feature and endothelial marker genes across all clusters from (b). f Frequencies of immature cells (HSCP/MPP, Multi-lin1, and Multi-lin2) in clusters with cell numbers >10, as defined by cellHarmony cell profiling analysis. Arrow indicates cluster 9. g Violin plots for Itga4 and Itgb1 in all clusters. Arrow indicate cluster 9. h Sub-clustering of VLA-4 expressing AML cells. VLA-4 high cells were mapped (top panel). Cluster 9 cells were then sub-clustered by Usp18+/f or Usp18+/Δ (bottom panel). p-values for reactome analysis in (c, d) were determined by two-sided binomial test adjusted with Benjamini–Hochberg approach. Source data are provided as a Source Data file.
Fig. 3
Fig. 3. Reduced Usp18 expression in murine leukemia cells alters the ISG landscape.
a Heat map and volcano plot of bulk RNA-seq data from GFP+Linc-Kit+ splenocytes from Usp18+/f and Usp18+/Δ AE9a recipients. (Usp18+/f n = 3 mice, Usp18+/Δ n = 3 mice) (log2 fold change >1 (Heatmap) or >0.5 (Volcano) and p-value <0.005). p-value was determined by two-sided Wald test adjusted with Benjamini–Hochberg approach. b Representative GSEA plots from RNA-seq data of (a). c Reactome analysis from RNA-seq data of (a). p-value was determined by two-sided binomial test adjusted with Benjamini-Hochberg approach. d; qRT-PCR analysis of IFN and DNA damage inducible genes in sorted GFP+Linc-Kit+ splenocytes from Usp18+/f and Usp18+/Δ AE9a recipient mice (Usp18+/f n = 3 mice, Usp18+/Δ n = 3 mice). Data represent mean ± s.d. e Western blot analysis of sorted GFP+Linc-Kit+ splenocytes from Usp18+/f and Usp18+/Δ AE9a recipient mice (Usp18+/f n = 3 mice, Usp18+/Δ n = 3 mice). The bar graphs show the indicated protein ratios. The protein samples ran separate gels because total and phosphorylated STAT1 or H2AX are same molecular weight. p-value was determined by two-tailed Student t-test. Data represent mean ± s.d. Source data are provided as a Source Data file.
Fig. 4
Fig. 4. USP18 loss in human cancer cells alters the landscape of ISGs.
a Western blots depicting proteins related to IFN-signaling and the DNA damage response in WT, USP18+/ (2 different clones) and USP18/ (2 different clones) THP-1, and WT, and USP18/ (2 different clones) MDA-MB-231 cells. b Percentage of annexin V+ THP-1 cells (WT, USP18+/ or USP18/) when treated with IFNα (1000 U/ml) for the indicated times. (n = 3 independent samples each). Data represent mean ± s.d. c Volcano plot of RNAseq data comparing WT vs WT + IFNα and USP18/ (KO) vs KO + IFNα (1000U/ml) THP-1 cells (n = 3 independent samples each). p-value was determined by two-sided Wald test adjusted with Benjamini–Hochberg approach. d Heat map representing RNAseq data for MDA-MB-231 WT and USP18/ cells with or without IFNα (1000 U/ml) for 6 h (n = 3 independent samples each). e Heat map representing RNAseq data from THP-1 WT and USP18/ cells with or without IFNα treatment for 6 h. IPA pathway analysis and representative genes in clusters A and D are shown. p-value was determined by right-tailed Fisher’s exact test adjusted with Benjamini–Hochberg approach. f Dot plot and schematic representing how ISGs were classified as ‘typical’ versus ‘atypical’. Genes upregulated in USP18/ + IFNα vs USP18/ and not in WT + IFNα vs WT were labeled ‘Atypical ISGs’ (605 genes) and genes upregulated in both were labeled ‘Typical ISGs’ (448 genes). Within atypical ISGs, 262 genes have been reported as IFNα (1000 U/ml) inducible in human cells. However, 343 genes are not reported as ISGs by Interferome analysis. These genes were further divided into ‘hidden atypical ISGs’ or ‘Non-canonical atypical ISGs’ depending on the respective presence or absence of an ISRE and/or STAT1 binding motif/data in their promoter/enhancers. g Typical ISGs and atypical ISGs were analyzed by GO biological process analysis. p-value was determined by one-sided Fisher’s exact test adjusted with Benjamini–Hochberg approach. h qRT-PCR analysis of WT and USP18/ THP-1 cells (n = 2 independent samples each) treated with or without IFNα (1000 U/ml) for indicated times. Data represent mean ± s.d. p-value was determined by one-way ANOVA test. Source data are provided as a Source Data file.
Fig. 5
Fig. 5. Nuclear USP18 regulates ISG landscape through IRF9/STAT2 and NFκB.
a Scatter plots of H3K27ac tag counts at promoter/enhancer regions in WT vs. USP18/, WT vs. WT IFN, WT IFN vs. USP18/ IFN, and USP18/ vs. USP18/ IFN THP-1 cells (n = 2 independent samples each). Red data points represent peaks with >2-fold change. b Heat map showing a comparative motif enrichment at enhancer regions defined by differential H3K27ac in (a). p-value was determined by two-tailed Hypergeometric test adjusted with Benjamini–Hochberg approach. c DNA pulldown assays with the indicated DNA probes and combinations of STAT2, IRF9, and USP18 proteins. d Relative firefly to renilla luciferase activity in U5A (IFNAR2−/−) cells expressing the indicated luciferase reporter constructs and combination of proteins. (n = 3 independent samples each). Data represent mean ± s.d. p-value was determined by one-way ANOVA test. e Genome browser tracks depicting ATAC and H3K27ac peaks in the atypical ISG PLK2. f Western blot analysis of the indicated proteins in cytoplasmic and nuclear fractions of USP18/ THP-1 cells with or without IFNα (1000 U/ml) treatment. g IRF9 or p65 ChIP qPCR of the PLK2 and CCL4L2 promoters in WT or USP18/ THP-1 cells with or without IFN treatment. (n = 3 independent samples each). Data represent mean ± s.d. p-value was determined by one-way ANOVA test. Source data are provided as a Source Data file.
Fig. 6
Fig. 6. Loss of USP18 switches IFN-induced apoptosis to pyroptosis by altering the ISG landscape.
a Reactome analysis of commonly enhanced genes in IFNα treated USP18/ THP-1 and MDA-MB-231 cells. p-value was determined by two-sided binomial test adjusted with Benjamini–Hochberg approach. b IL-1β secretions and cleaved IL-1β in culture supernatant were analyzed in MDA-MB-231 WT and USP18/ cells with or without IFNα (1000 U/ml) for 36 h (n = 3 independent samples each). c Percentage of live WT, USP18+/ and USP18/ THP-1 cells treated with or without IFNα (1000 U/ml) for 48 h (n = 3 independent samples each). d LDH release assay and MFI of surface-exposed calreticulin (ecto-CRT) of WT, USP18+/ and USP18/ cells with or without IFNα (1000U/ml) for 48 h (n = 3 independent samples each). e Western blot analysis of WT and USP18/ THP-1 cells treated with or without IFNα (1000U/ml) for 36 h (lane 1–4) or WT cells treated with staurosporine for 24 h (lanes 5, 6). f Percentage of live WT and USP18/ THP-1 cells pre-treated with mock or Necrostatin-1 (10 μM) for 6 h, then treated with IFNα (1000 U/ml) for the indicated times (n = 3 independent samples each). g Western blot analysis of THP-1 cells (WT, USP18+/ and USP18/) and MDA-MB-231 cells (WT and USP18/) treated with or without IFNα for 36 h. h Western blot analysis of WT and USP18+/ THP-1 cells treated with or without IFNα for 72 h. i Western blot of sorted GFP+Linc-Kit+ splenocytes from Usp18+/f and Usp18+/Δ AE9a recipient mice (Usp18+/f n = 3, Usp18+/Δ n = 3 mice). j MFI of ecto-CRT of sorted GFP+Linc-Kit+ splenocytes from Usp18+/f and Usp18+/Δ AE9a recipient mice (Usp18+/f n = 3, Usp18+/Δ n = 3 mice). p-value was determined by two-tailed Student t-test. k LDH release assay of Usp18+/f and Usp18+/Δ AE9a cells after 48 h of treatment with or without murine IFNβ (500U/ml) (n = 3 independent samples each). l Analysis of IL-1β secretions of culture supernatant from (k). All data represent mean ± s.d, except where indicated. n.s. = not statistically significant. p-value for (bd, f, and k, l was determined by one-way ANOVA test. Source data are provided as a Source Data file.
Fig. 7
Fig. 7. USP18-STAT2 regulates GSDMD and GSDME-dependent pyroptosis upon IFN stimulation.
a Western blot of WT, GSDMD/, GSDME/, USP18/, USP18/GSDMD/ and USP18/GSDME/ THP-1 cells treated with or without IFNα (1000 U/ml) for 48 h. b Analysis of ICD markers in (a). c Percentage of live cells in (a) analyzed by FACS. d Western blot of WT or USP18−/− cells expressing Control sgRNA or Caspase-1 sgRNA after treatment with IFNα (1000 U/ml) for 48 h. e Analysis of IL-1β secretions of culture supernatant in (d). f Percentage of live cells in (d) analyzed by FACS. g Western blot of DMSO, MCC950 or ODN-A151 treated WT or USP18/ THP-1 cells further treated with or without IFNα (1000 U/ml) for 48 h. h Analysis of IL-1β secretions of culture supernatant in (g). i Percentage of live cells in (g) analyzed by FACS. j Western blot of USP18/ THP-1 cells expressing Mock, USP18 or USP18C64S treated with or without IFNα for 48 h. k Percentage of live cells in (j) analyzed by FACS. l Analysis of ICD markers in (j). m qRT-PCR of IFIT1, PLK2 and CCL4L2 expression in USP18−/− THP-1 cells expressing Mock, USP18 or USP18C64S treated with or without IFNα (1000U/ml) for 6 h. n Percentage of live WT, USP18+/ and USP18/ 2fTGH cells after 48 h of treatment with or without IFNα (1000 U/ml). o Analysis of ICD markers in (n). p qRT-PCR of IFIT1 and PLK2 expression of STAT2 or STAT2 R148W expressing STAT2/ (U6A) cells that were treated with or without IFNα (1000 U/ml) as indicated. q Percentage of live cells of STAT2 or STAT2 R148W expressing STAT2/ (U6A) cells that were treated with or without IFNα (1000 U/ml) for 48 h. r Western blot of cell lysates in (q). s Analysis of IL-1β secretions of culture supernatant in (q). t Analysis of ICD markers in (q). n = 2 for Fig. 7p and n = 3 independent samples for (b, c, e, f, h, I, ko, q, st) were analyzed. All data represent mean ± s.d, except where indicated. n.s. = not statistically significant. All p-value in Fig. 7 was determined by one-way ANOVA test. Source data are provided as a Source Data file.
Fig. 8
Fig. 8. USP18 loss-induced atypical ISG PLK2 regulates GSDME cleavage dependent pyroptosis.
a Western blot of WT, PLK2/, USP18/, and USP18/PLK2/ THP-1 cells treated with or without IFNα (1000 U/ml) for 48 h with indicated antibodies. b Percentage of live cells in (a) (n = 3 independent samples each). p-value was determined by one-way ANOVA test. c Analysis of ICD markers (LDH release and ecto-CRT) in (b) (n = 3 independent samples each). p-value was determined by one-way ANOVA test. d Western blot of PLK2/ THP-1 cells infected with Mock or PLK2 after two days of blasticidin selection using the indicated antibodies. e; Percentage of live cells in (d) (n = 3 independent samples each). p-value was determined by two-tailed Student t-test. f Analysis of ICD markers (LDH release and ecto-CRT) and IL-1β secretions in (d) (n = 3 independent samples each). p-value was determined by two-tailed Student t-test. g; THP-1 and Kasumi-1 cells were transduced with MIP, MIP-PLK2 WT, or MIP-PLK2 enzyme activity mutants. Two days after puromycin selection, cell lysates were analyzed by western blot with indicated antibodies. h Ectopic PLK2 expression induces cell death in several AML cell lines independent of its kinase activity. THP-1, Kasumi-1, and MV4-11 cells were infected with MIP, MIP-PLK2 WT, or MIP-PLK2 enzyme activity mutants. Two days after puromycin selection, live cells were analyzed by FACS (n = 3 independent samples each). p-value was determined by one-way ANOVA test. i THP-1 or OCI-AML3 cells were treated with DMSO or TC-S7005 (final 10 µM) for 48 h, then cell lysates were analyzed. j THP-1 or OCI-AML3 cells were treated with DMSO or TC-S7005 for indicated times, then PI (%) and Annexin V+ (%) were analyzed by FACS (n = 3 independent samples each). p-value was determined by one-way ANOVA test. k Two different PDX AML cells were cultured with different dose of TC-S7005, and analyzed cell growth (n = 3 independent samples each conditions). All data represent mean ± s.d, except where indicated. n.s. not statistically significant. p-value was determined by one-way ANOVA test. Source data are provided as a Source Data file.
Fig. 9
Fig. 9. USP18 loss-induced atypical ISG PLK2 regulates leukemogenesis.
a Survival of sub-lethally irradiated recipient mice transplanted (i.v.) with Plk2 doxycycline inducible C1498 or AE9a cells (C1498, n = 5 mice each, AE9a, n = 8 mice each). Two weeks after transplantation, mice were fed with or without doxycycline water (400 μg/ml, 5 % sucrose). p-value was determined by two-tailed Gehan–Breslow–Wilcoxon test (for C1498) or log-rank test (for AE9a). PLK2 induction in C1498 cells are also shown. b Survival for recipients of SgCtrl or SgPlk2 infected Usp18+/f or +/Δ UBCER-Cre AE9a-GFP AMLs. p-value between +/f SgCtrl and +/Δ SgPLK2, and +/Δ SgCtrl and +/Δ SgPLK2 were determined by log-rank test. (right, n = 7 mice each group). Western blot of PLK2 protein level in SgRNAs expressing cells (left). c Analysis of GFP % of (m) in PB. p-value was determined by one-way ANOVA test. d Model of USP18-STAT2 mediated ISGs regulation followed by pyroptosis. Source data are provided as a Source Data file.

Similar articles

Cited by

References

    1. Waldman AD, Fritz JM, Lenardo MJ. A guide to cancer immunotherapy: from T cell basic science to clinical practice. Nat. Rev. Immunol. 2020;20:651–668. - PMC - PubMed
    1. Havel JJ, Chowell D, Chan TA. The evolving landscape of biomarkers for checkpoint inhibitor immunotherapy. Nat. Rev. Cancer. 2019;19:133–150. - PMC - PubMed
    1. Galluzzi L, Buque A, Kepp O, Zitvogel L, Kroemer G. Immunogenic cell death in cancer and infectious disease. Nat. Rev. Immunol. 2017;17:97–111. - PubMed
    1. Galon J, Bruni D. Approaches to treat immune hot, altered, and cold tumours with combination immunotherapies. Nat. Rev. Drug Discov. 2019;18:197–218. - PubMed
    1. Galluzzi L, Humeau J, Buque A, Zitvogel L, Kroemer G. Immunostimulation with chemotherapy in the era of immune checkpoint inhibitors. Nat. Rev. Clin. Oncol. 2020;17:725–741. - PubMed

Publication types