

Published Erratum
doi: 10.1038/s41598-022-26917-1.
Author Correction: Toll like receptor 4 mediates cell death in a mouse MPTP model of Parkinson disease
Affiliations
- PMID: 36646730
- PMCID: PMC9842711
- DOI: 10.1038/s41598-022-26917-1
Item in Clipboard
Published Erratum
Author Correction: Toll like receptor 4 mediates cell death in a mouse MPTP model of Parkinson disease
Sci Rep.
.
No abstract available
Figures
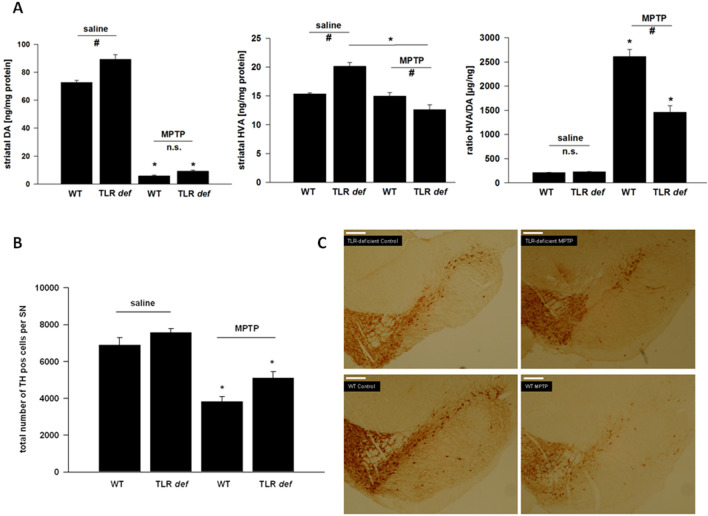
(A): HPLC measurement of striatal dopamine (DA) and homovanillic acid (HVA) levels, as well as calculation of the HVA/DA-ratio after MPTP-intoxication of TLR4- deficient (TLR def) and WT mice in comparison to saline treated mice. Values are expressed as mean ± SEM (*p < 0.05 comparing MPTP treated group with its saline control, #p < 0.05 comparing MPTP-treated groups of WT and TLR4-deficient mice. (B): TH-positive cell number in SN after MPTP treatment. WT = WT mice, TLR deficient = TLR4 deficient mice. Values are expressed as mean ± SEM (*p < 0.05 comparing MPTP treated group with its saline control). (C): Representative photographs of the SN of each treatment group is shown. TH-staining of free-floating cryomicrotome-cut sections at day 7. TLR4-deficient = TLR4-deficient mice, WT = wild-type mice. Control = saline treated mice, MPTP = MPTP-treated mice, Scale bars = 200 μm.

(A): Number of nigral Iba+ microglia at day 2 and day 7. WT = WT mice, TLR def = TLR4-deficient mice. Values are expressed as mean ± SEM (*p < 0.05 comparing MPTP-treated group with its saline control, #p < 0.05 comparing MPTP-treated groups of WT and TLR4-deficient mice). (B): MHC II+ cell number in SN after MPTP treatment at day 2. WT = WT mice, TLR def = TLR4-deficient mice. Values are expressed as mean ± SEM (*p < 0.05 comparing MPTP-treated group with its saline control, #p < 0.05 comparing MPTP-treated groups of WT and TLR4-deficient mice). (C): Representative photographs of the SN (Iba-1 staining) of each treatment group at day 2 are shown. TLR4 def = TLR4-deficient mice, WT = wild-type mice. Control = saline treated mice, MPTP = MPTP treated mice. Scale bars = 200 μm. (D): Correlation analysis of TH+- and Iba+-positive cells counts at day 7 in SNpc (r = −0.92, p < 0.001).
Erratum for
-
Toll like receptor 4 mediates cell death in a mouse MPTP model of Parkinson disease.Sci Rep. 2013;3:1393. doi: 10.1038/srep01393. Sci Rep. 2013. PMID: 23462811 Free PMC article.
Publication types
LinkOut - more resources
Full Text Sources
