. 2023 Jan;5(1):165-181.
doi: 10.1038/s42255-022-00722-6. Epub 2023 Jan 16.

Hepatic nonvesicular cholesterol transport is critical for systemic lipid homeostasis

Affiliations

Hepatic nonvesicular cholesterol transport is critical for systemic lipid homeostasis

Xu Xiao et al. Nat Metab. 2023 Jan.

Abstract

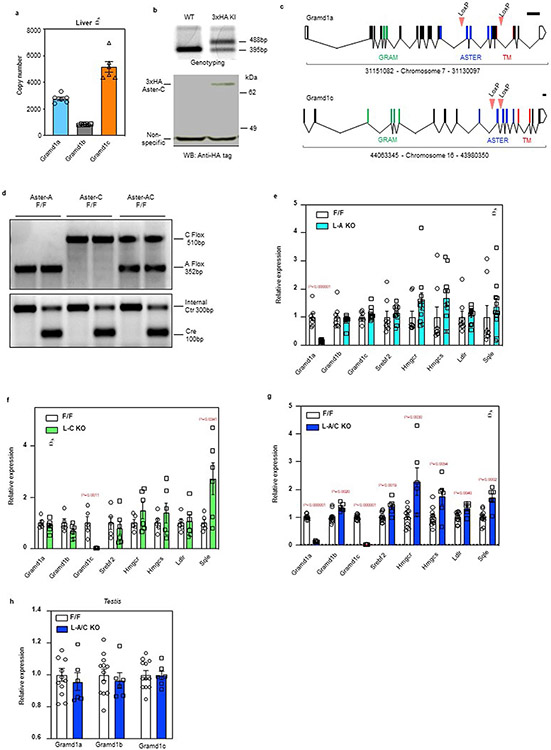
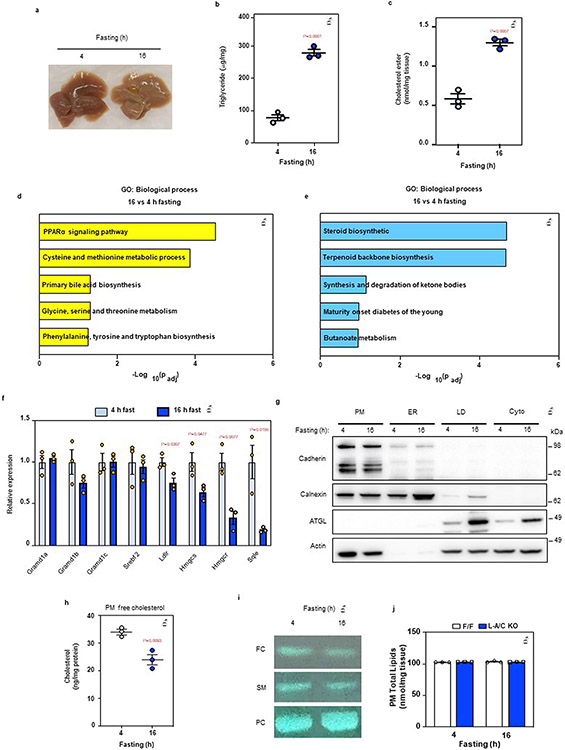
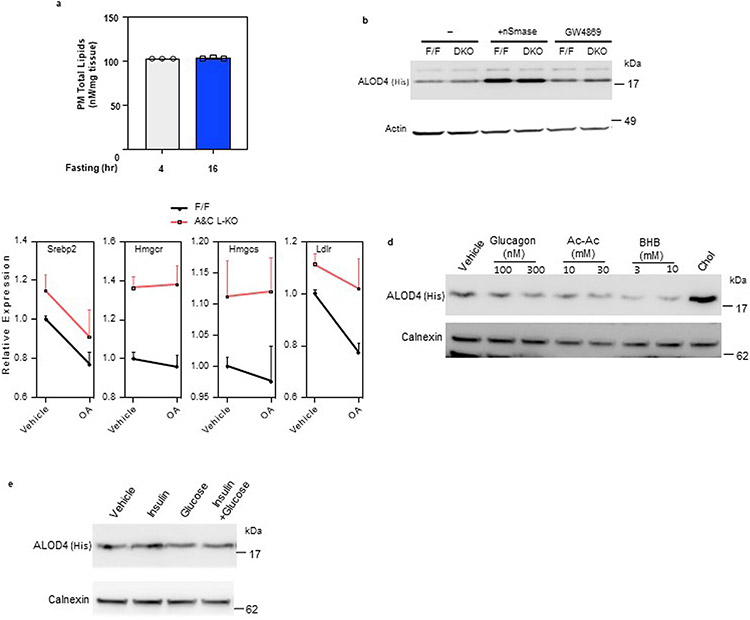
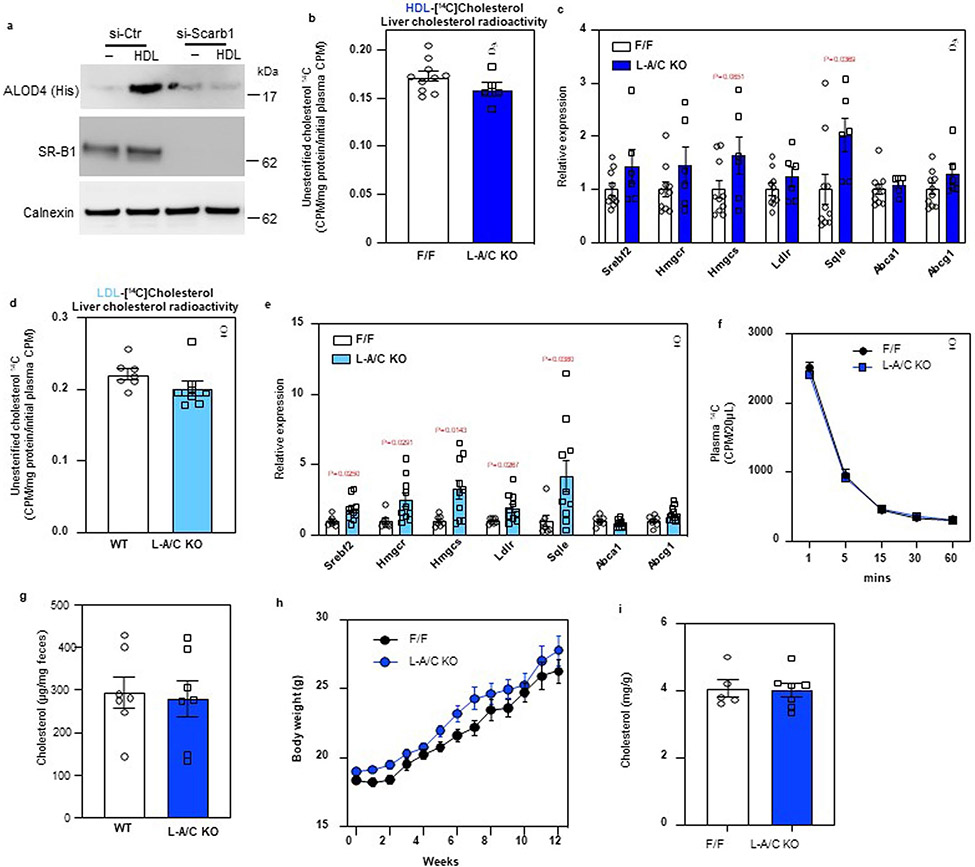
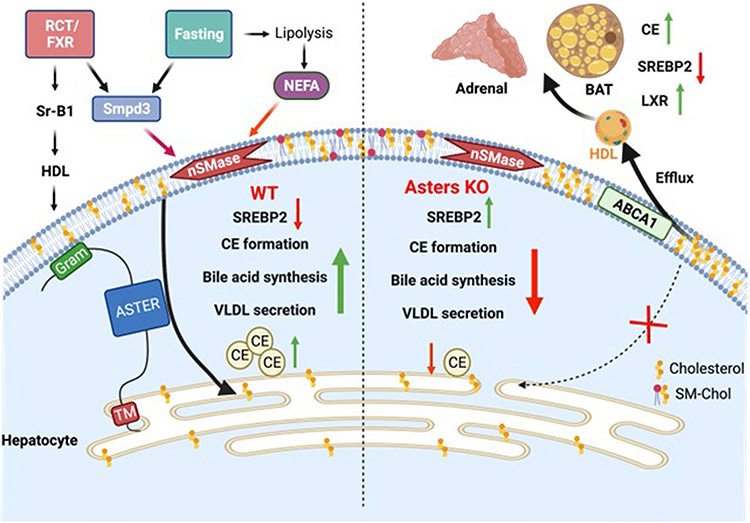
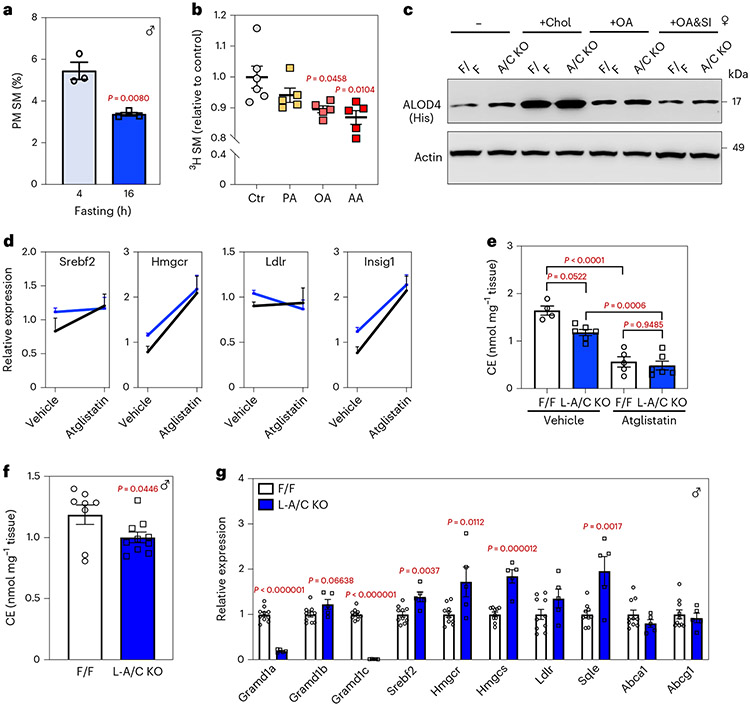
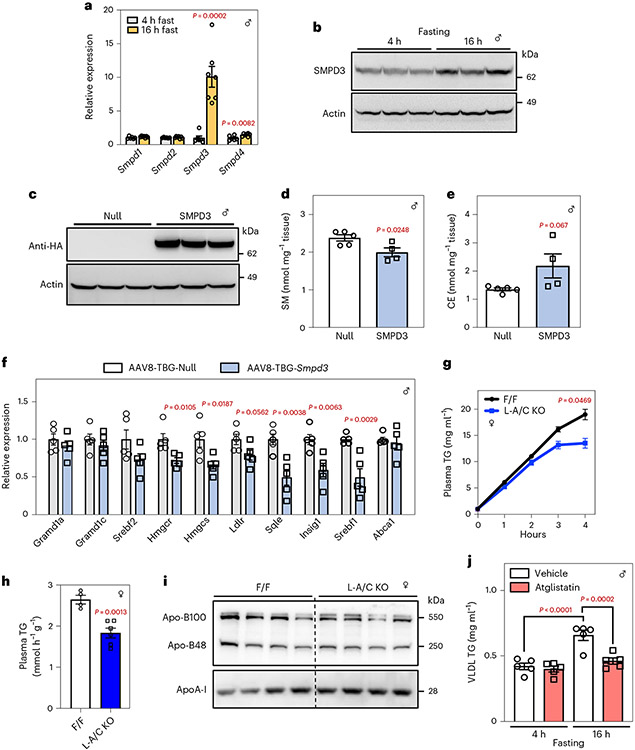
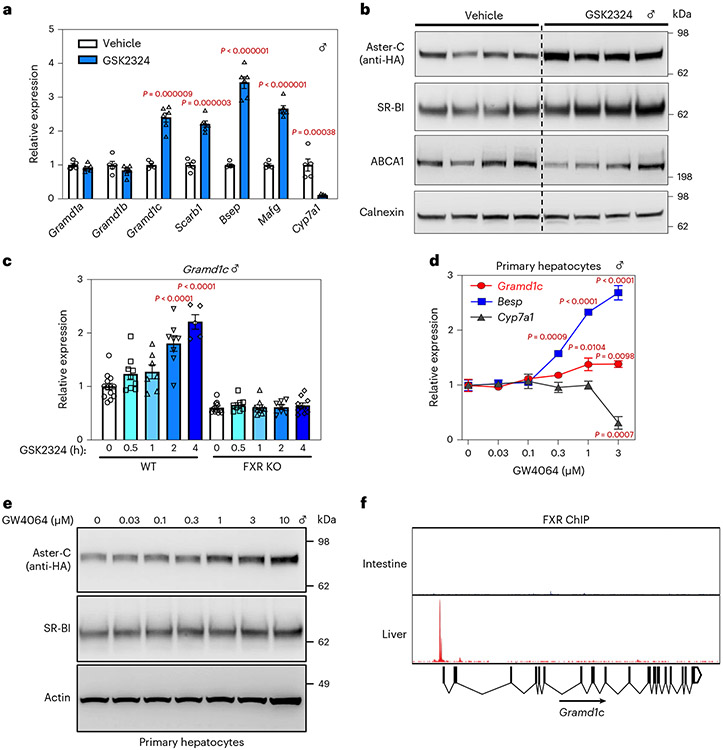
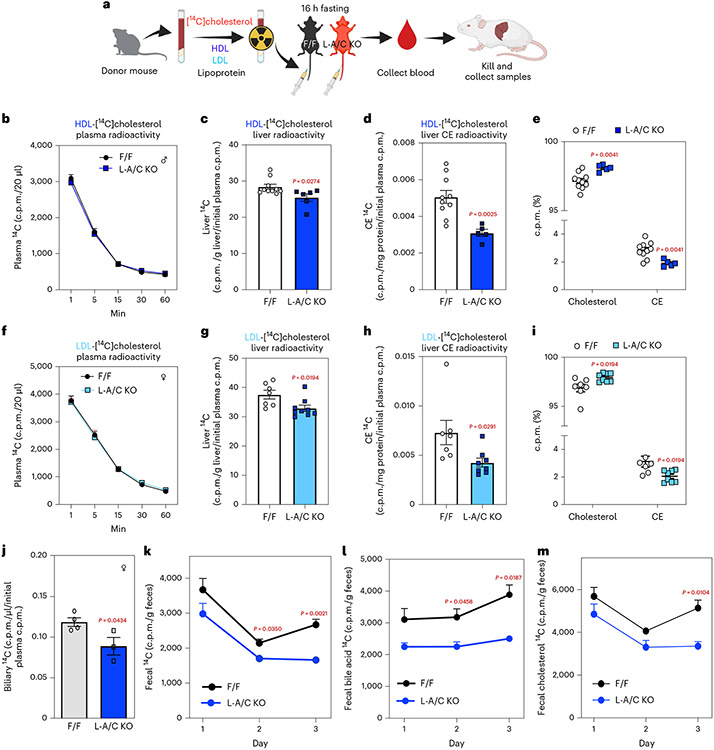
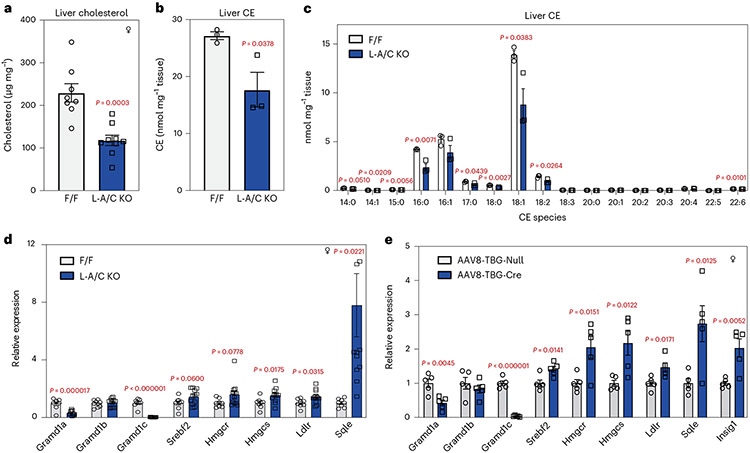
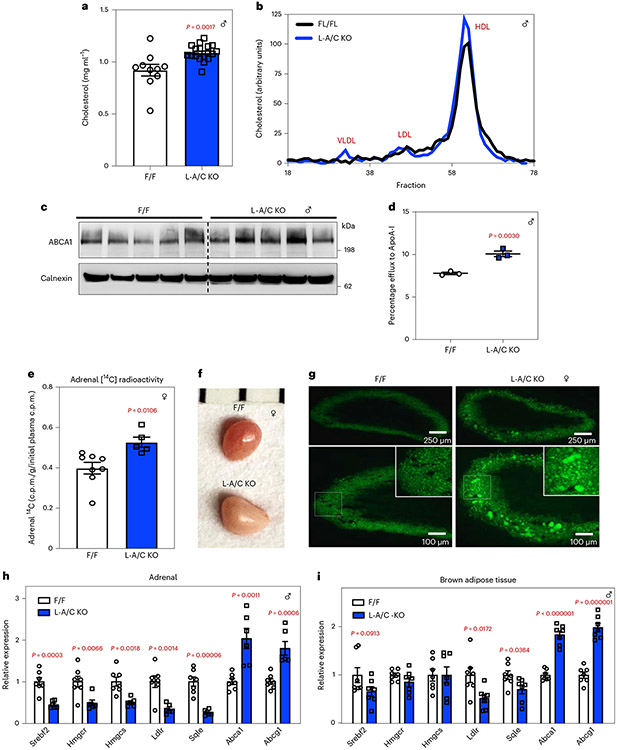
In cell models, changes in the 'accessible' pool of plasma membrane (PM) cholesterol are linked with the regulation of endoplasmic reticulum sterol synthesis and metabolism by the Aster family of nonvesicular transporters; however, the relevance of such nonvesicular transport mechanisms for lipid homeostasis in vivo has not been defined. Here we reveal two physiological contexts that generate accessible PM cholesterol and engage the Aster pathway in the liver: fasting and reverse cholesterol transport. During fasting, adipose-tissue-derived fatty acids activate hepatocyte sphingomyelinase to liberate sequestered PM cholesterol. Aster-dependent cholesterol transport during fasting facilitates cholesteryl ester formation, cholesterol movement into bile and very low-density lipoprotein production. During reverse cholesterol transport, high-density lipoprotein delivers excess cholesterol to the hepatocyte PM through scavenger receptor class B member 1. Loss of hepatic Asters impairs cholesterol movement into feces, raises plasma cholesterol levels and causes cholesterol accumulation in peripheral tissues. These results reveal fundamental mechanisms by which Aster cholesterol flux contributes to hepatic and systemic lipid homeostasis.


Figures

Extended Data Fig. 1 ∣
Extended Data Fig. 1 ∣. Generation of Aster-C 3xHA KI and Asters hepatocyte specific KO mice.
a, Quantitative PCR of Asters expression in mouse liver (n = 6). b, Evaluation of 3xHA-Aster-C KI mice. Genotyping results (upper) and anti-HA tag immunoblot (bottom) for 3xHA-Aster-C KI mice. The genotyping result is representative of at least 50 similar results. The anti-HA-Aster-C western blot was repeated independently in Fig. 5e. c, Strategy for generating Gramd1a (Aster-A) and Gramd1c (Aster-C) Flox/Flox (F/F) mice. Coding exons are depicted in black. Exons that correspond to the GRAM domain, ASTER domain, and transmembrane (TM) domain are depicted in green, blue, and red respectively. Scale bar represents 1 kb. d, Genotyping results for L-A KO, L-C KO and L-A/C KO mice. The genotyping results are representative of at least 100 similar results per condition. *****(e, f and g) Expression levels of the indicated genes in liver from F/F control and L-A KO mice (e, n = 8/11); L-C KO mice (f, n = 5/6); L-A/C KO mice (g, n = 12/6). h, Gramd1a, Gramd1b and Gramd1c expression level in the testis of F/F control and L-A/C KO mice (n = 12/6). All data are presented as mean ± SEM. P values were determined by two-sided Student’s t-test with Benjamini, Krieger and Yekutieli correction for multiple comparisons (e, f, g and h).
Extended Data Fig. 2 ∣
Extended Data Fig. 2 ∣. Fasting stimulates hepatic PM–ER cholesterol transport.
a, Gross appearance of livers from mice fasted for 4- or 16-h. b, Hepatic triglycerides in mice fasted for 4- or 16-h (n = 3/3). c, Hepatic CE in mice fasted for 4- or 16-h (n = 3/3). d, Significantly upregulated pathways in the livers of mice fasted for 16-h compared to 4-h according to pathway analysis of RNA Sequencing data. e, Significantly downregulated pathways in the livers of mice fasted for 16-h compared to 4-h according to pathway analysis of RNA Sequencing data. f, Hepatic mRNA expression of SREBP-2 pathway targets from the livers of mice fasted for 4- or 16-h (n = 3/3). g, Quality control of plasma membrane isolation from the mouse liver. Cadherin: PM maker; Calnexin: ER maker; ATGL: lipid droplet (LD) maker; Actin: cytoskeleton maker. This analysis was completed once as the organelle isolation method has been previously validated (further method details are in the Methods section). h, Free cholesterol analysis from purified PMs of wild-type mice (n = 3/3). i, TLC analysis of free cholesterol (FC), sphingomyelin (SM) and phosphatidylcholine (PC) from the livers of mice fasted for either 4 or 16 h. j, PM total lipids as measured by mass-spec from livers of F/F control and L-A/C KO after 4- and 16-h fasting (n = 3/3). All data are presented as mean ± SEM. P values were determined by two-sided Student’s t-test (b, c and h), or two-sided Student’s t-test with Benjamini, Krieger and Yekutieli correction (f).
Extended Data Fig. 3 ∣
Extended Data Fig. 3 ∣. Aster-mediated cholesterol transport determines the size of the accessible PM cholesterol pool.
a, PM total lipids from mouse liver after 4- and 16-h fasting as determined by mass spec (n = 3/3). b, Immunoblot analysis of ALOD4 binding in F/F control and L-A/C KO primary hepatocytes after treatment with vehicle, nSmase (100 mU/ml) and GW4869 (10 μM) for 1-h. Actin was used as a loading control. c, Expression levels of the indicated genes in primary hepatocyte that had been cultured in Maintenance medium and Ro 48-8071 (1μM) overnight before being treated with or without oleic acid (30μM) for 6-h (n = 3). d, Immunoblot analysis of ALOD4 binding in primary hepatocytes after treatment with vehicle or indicated concentration of glucagon, acetoacetate (Ac-Ac), beta-hydroxybutyrate (BHB) or MβCD-cholesterol (35 μM) for 1-h. Calnexin was used as a loading control. e, Immunoblot analysis of ALOD4 binding in primary hepatocytes after treatment with vehicle or insulin (300 nM), glucose (50 mM) and both for 1-h. Calnexin was used as a loading control. All data are presented as mean ± SEM.
Extended Data Fig. 4 ∣
Extended Data Fig. 4 ∣. Asters transport lipoprotein-derived cholesterol from the PM to ER in hepatocytes.
a. Immunoblot analysis of ALOD4 binding in control or Sr-b1 knockdown HAECs after treatment with vehicle or HDL (400 ug/ml) for 1-h. Calnexin was used as a sample processing control. b, [14C] counts in liver unesterified cholesterol of mice from Fig. 6c (n = 10/6). c, mRNA expression levels of the indicated genes in the livers of mice from Fig. 6c (n = 10/6). d, [14C] counts in unesterified cholesterol in the livers of mice from Fig. 6g (n = 7/9). e, mRNA expression levels of the indicated genes in the livers of mice from Fig. 6g (n = 7/9). f, The rate of [14C] lipoprotein clearance from the circulation (n = 6/5), related to Figs. 6j-6m. Data are represented as mean ± SEM with individual animals noted as dots. *p < 0.05. g. Fecal cholesterol analysis of F/F and L-A/C KO mice fed a cholesterol-free diet for 48 hours (n = 7/7). h, Growth curves for F/F and L-A/C KO mice fed a Western diet from 8 weeks of age (n = 8/12). Masses are shown as mean ± SEM. i, Whole-body cholesterol content from F/F control and L-A/C KO mice on chow diet at 15 weeks old (n = 5/7). All data are presented as mean ± SEM. P values were determined by two-sided Student’s t-test (b, d, g and i), two-sided Student’s t-test with Benjamini, Krieger and Yekutieli correction (c and e), or two-way ANOVA with Sidak’s correction for multiple comparisons (h).
Extended Data Fig. 5 ∣
Extended Data Fig. 5 ∣. Model for the role of hepatic Asters in liver and systemic cholesterol homeostasis.
In normal physiology (left side of schematic), fasting stimulates fatty acid release from adipose tissue to promote hepatic sphingomyelinase activity, which liberates sequestered cholesterol in the hepatocyte PM. Aster proteins recognize this newly accessible cholesterol and transport it to the ER for CE formation, suppression of SREBP-2 pathway targets, bile acid synthesis and VLDL production. Hepatic Asters are also induced by FXR and function in the RCT pathway by moving HDL-derived cholesterol (and LDL-derived cholesterol) within hepatocytes. Loss of hepatic Aster function (right side of the schematic) impairs CE formation and VLDL output during fasting. Loss of Asters in the liver also decreases the appearance of HDL-derived cholesterol in bile and feces, raises plasma cholesterol levels (due to enhanced liver cholesterol efflux), and causes peripheral cholesterol accumulation (for example, adrenal gland, brown adipose tissue).
Extended Data Fig. 6 ∣
Extended Data Fig. 6 ∣. Western blot quantifications.
a, Western blot quantifications of ALOD4 binding from Fig. 1c. Normalized to loading control Actin (n = 1). b, Western blot quantifications of indicated proteins from Fig. 1c. Normalized to sample processing control calnexin (n = 5). c, Western blot quantifications of indicated proteins from Fig. 2g. Normalized to sample processing controls calnexin or lamin a/c (n = 4). d, Western blot quantifications of ALOD4 binding from Fig. 3c. Normalized to loading control actin (n = 1). e and f, Western blot quantifications of SMPD3 from Fig. 4b and Fig. 4c. Normalized to loading control actin (n = 3). g, Western blot quantifications of indicated proteins from Fig. 4i. Equal amounts of protein was loaded for each line (n = 4). h, Western blot quantifications of indicated proteins from Fig. 5b. Normalized to sample processing control calnexin (n = 4). i, Western blot quantifications of indicated proteins from Fig. 5e. Normalized to actin which served as a loading control for SRB1 and a sample processing control for Aster-C (n = 1). j, Western blot quantifications of ABCA1 from Fig. 8c. Normalized to sample processing control calnexin (n = 5). k, l and m, Western blot quantifications of ALOD4 binding from extended data Figs. 3b, 3d and 3e. Normalized to loading control actin or calnexin (n = 1). n, Western blot quantifications of ALOD4 binding and Sr-B1 from Fig. 4a. Normalized to calnexin which served as a loading control for ALOD4 and a sample processing control for SRB1 (n = 1). Data are presented as mean ± SEM. P values were determined by two-sided Student’s t-test (b, c, e, f and h).
Fig. 1 ∣
Fig. 1 ∣. Asters transport accessible PM cholesterol in hepatocytes.
a, Localization of Aster-C (green) in primary hepatocytes from 3xHA-Aster-C knock-in mice. Red, E-cadherin (PM marker). b, ALOD4 staining (green) of PM accessible cholesterol in primary hepatocytes from F/F control and L-A/C KO mice. Blue, DAPI nuclear stain. Data in a and b are representative of three independent samples. DAPI, 4,6-diamidino-2-phenylindole. c, Immunoblot analysis of ALOD4 binding in hepatocytes from b. Actin was used as a loading control. d, Flow cytometry plots of ALOD4 staining in hepatocytes from b. MFI, mean fluorescence intensity. e, Violin plots of cellular fluorescence intensity quantified in hepatocytes from b. The 25th, 50th and 75th percentiles are shown as dashed lines. P values were determined by two-sided Student’s t-test.
Fig. 2 ∣
Fig. 2 ∣. Asters facilitate hepatocyte PM to ER cholesterol transport during fasting.
a, PM free cholesterol from F/F and L-A/C KO mice after 4 or 16 h fasting (n = 3 and 3). b, Total hepatic CEs from F/F and L-A/C KO mice after 4 and 16 h fasting (n = 7, 6, 5 and 6). c, Individual hepatic CE species (nmol mg−1 liver) from F/F and L-A/C KO mice after 16 h fasting (n = 3 and 3). d, Hepatic mRNA expression of SREBP-2 pathway targets from livers of F/F and L-A/C KO mice after 16 h fasting (n = 10 and 18). e, Immunoblot analysis of indicated proteins from livers of F/F and L-A/C KO mice after 16 h fasting (n = 5 and 5). Calnexin was used as a sample processing control. f, Hepatic mRNA expression of SREBP-2 pathway targets from livers of F/F and L-A/C KO mice after chow or statin diet feeding for 5 d (n = 10 and 18 for chow diet and n = 7 and 8 for statin diet). g, Immunoblot analysis of membrane (top) and nuclear (bottom) SREBP-2 protein levels from livers of F/F and L-A/C KO mice after statin diet feeding (n = 4 and 4). Calnexin (top) and Lamin A/C (bottom) were used as sample processing controls. h, Total hepatic CEs from livers of F/F and L-A/C KO mice after statin diet feeding (n = 7 and 8). i, Individual hepatic CE species (nmol mg−1 liver) from livers of F/F and L-A/C KO mice after statin diet feeding (n = 7 and 8). All data are presented as mean ± s.e.m. P values were determined by two-way analysis of variance (ANOVA) with Sidak’s correction for multiple comparisons (a,b), two-sided Student’s t-test (h) or two-sided Student’s t-test with Benjamini, Krieger and Yekutieli correction for multiple comparisons (c,d,i). *P < 0.05, **P < 0.01, ***P < 0.001, ****P < 0.0001.
Fig. 3 ∣
Fig. 3 ∣. Adipose-derived fatty acids liberate sequestered PM cholesterol during fasting.
a, Lipidomic analysis of PM SM from mice that had been fasted for 4 or 16 h (n = 3 and 3). b, [3H]choline-labeled SM in HepG2 cells after incubation with 300 μM BSA-conjugated PA, OA or AA for 1 h (n = 6, 5, 5 and 5). c, Immunoblot analysis of ALOD4 binding in F/F and L-A/C KO primary hepatocytes after treatment with vehicle, MβCD-cholesterol (35 μM), OA (30 μM) and OA (30 μM) plus GW4869 (10 μM) for 1 h. Actin was used as a loading control. d, Expression levels of the indicated genes in livers of mice that had been administered with vehicle or Atglistatin (200 μmol kg−1) for 16 h (n = 3, 4 for vehicle and n = 5 and 5 for Atglistatin). e, Total hepatic CEs in mice from d (n = 4 and 6 for vehicle and n = 5 and 6 for Atglistatin). f, Total hepatic CEs from F/F and L-A/C KO mice after acute cold exposure (n = 8 and 10). g, Hepatic mRNA expression of SREBP-2 pathway targets from livers of F/F control and L-A/C KO mice after 5 h cold exposure (n = 10 and 5). All data are presented as mean ± s.e.m. P values were determined by two-sided Student’s t-test (a,f), two-sided Student’s t-test with Benjamini, Krieger and Yekutieli correction for multiple comparisons (g), one-way ANOVA with Tukey’s post-test (b) or two-way ANOVA with Sidak’s correction for multiple comparisons (e). *P < 0.05, **P < 0.01, ***P < 0.001, ****P < 0.0001.
Fig. 4 ∣
Fig. 4 ∣. Fasting induces Smpd3 expression to regulate cholesterol metabolism and VLDL production.
a, Hepatic mRNA expression of Smpd1, Smpd2, Smpd3 and Smpd4 in mice fasted for 4 h or 16 h (n = 6 and 7). b, Immunoblot analysis of hepatic SMPD3/nSMase2 in the livers of mice fasted for 4 h or 16 h (n = 3 and 3). Actin was used as a loading control. c, Immunoblot analysis of HA-tagged SMPD3/nSMase2 in the livers of mice transduced with AAV8-TBG-Ctr or AAV8-TBG-Smpd3 for 3 d (n = 3 and 3). Actin was used as a loading control. d,e, Hepatic SM (d) and CEs (e) in mice 3 d after i.v. injection of AAV8-TBG-Ctr or AAV8-TBG-Smpd3 (n = 5 and 4). f, Hepatic mRNA expression of indicated genes from WT mice transduced with AAV8-TBG-Ctr or AAV8-TBG-Smpd3 for 3 d (n = 5 and 5). g, VLDL-TG secretion in F/F control and L-A/C KO mice (n = 4 and 6). h. The rate of VLDL-TG production from F/F control and L-A/C KO mice (n = 4 and 6). i, Apo-B and ApoA-I protein levels in plasma of F/F and L-A/C KO mice (n = 4 and 4). j, TGs in isolated VLDL particles from mice treated with vehicle or Atglistatin (200 μmol kg−1) for 16 h (n = 5). All data are presented as mean ± s.e.m. P values were determined by two-sided Student’s t-test (d,e,h), two-sided Student’s t-test with Benjamini, Krieger and Yekutieli correction for multiple comparisons (a,f), or two-way ANOVA with Sidak’s correction for multiple comparisons (g,j). *P < 0.05, **P < 0.01, ***P < 0.001.
Fig. 5 ∣
Fig. 5 ∣. Aster-C is a direct target gene of FXR in mouse liver.
a, Hepatic mRNA expression of Asters and FXR target genes after vehicle or GSK2324 treatment (n = 5 and 6). b, Immunoblot analysis of hepatic Aster-C (HA tag), SR-BI and ABCA1 from a. Calnexin was used as a sample processing control (n = 4 and 4). c, Hepatic mRNA expression of Aster-C from WT or FXR KO mice after vehicle or GSK2324 treatment (n = 13, 9, 7, 8, 5, 11, 8, 9, 7 and 10). d, qPCR analysis of indicated genes in response to GW4064 treatment for 16 h in primary hepatocytes (n = 3 for each time point). e, Immunoblot analysis of Aster-C (HA tag) and SR-BI in response to GW4064 treatment for 16 h in primary hepatocytes. Actin was used as a loading control for SRB1 and a sample processing control for HA-Aster-C. f, ChIP assay of FXR recruitment to the Aster-C promoter in the intestine or liver. All data are presented as mean ± s.e.m. P values were determined by two-sided Student’s t-test with Benjamini, Krieger and Yekutieli correction for multiple comparisons (a) or one-way ANOVA with Dunnett’s correction for multiple comparisons (c,d). *P < 0.05, **P < 0.01, ***P < 0.001, ****P < 0.0001.
Fig. 6 ∣
Fig. 6 ∣. Hepatic Aster deficiency impairs transport of lipoprotein-derived cholesterol and RCT.
a, Experiment schematic of the [14C]cholesterol-labeled lipoprotein tracing studies. HDL/LDL particles were freshly isolated from donor mice by density-gradient ultracentrifugation. F/F control and L-A/C KO mice received intravenous injections of [14C]-HDL or -LDL and blood was collected at the indicated timepoints for up to 1 h. After 1 h, mice were killed for tissue collection and analysis. Liver total [14C] radioactivity was normalized per gram of liver and expressed relative to radioactivity in plasma 1 min after lipoprotein injection (which we defined as 100% of radioactivity administered). [14C] radioactivity in liver CEs was normalized per mg protein and expressed relative to radioactivity in plasma 1 min after lipoprotein injection. b, Rate of [14C]-HDL clearance from circulation, as indicated by radioactive counts in plasma at 1, 5, 15, 30 and 60 min after lipoprotein administration (n = 9 and 6). c, Total [14C] counts in livers (n = 10 and 6). d, [14C] counts in liver CE of mice from c. e, The ratio of radioactivity in free cholesterol or CE to total radioactivity in cholesterol from c (n = 10 and 5). f, Rate of [14C]-LDL clearance from circulation, as indicated by radioactive counts in plasma at 1, 5, 15, 30 and 60 min after lipoprotein administration (n = 7 and 9). g, Total [14C] counts in livers (n = 7 and 9). h, [14C] counts in liver CE of mice from g. i, The ratio of radioactivity in free cholesterol or CE to total radioactivity in cholesterol from g (n = 7 and 8). j, Total biliary [14C] counts from F/F and L-A/C KO mice 3 d after [14C]-HDL administration (n = 4 and 3). Total biliary [14C] counts are normalized per μL bile and expressed relative to radioactivity in plasma 1 min after [14C]-HDL administration. k, Total [14C] counts in feces of mice over 3 d after [14C]-HDL administration (n = 6 and 5). l, [14C] counts in the fecal bile acids from k (n = 6 and 5). m, [14C] counts in fecal cholesterol from k (n = 6 and 5). All data are presented as mean ± s.e.m. P values were determined by two-sided Student’s t-test (c–e,g–h,j) or two-way ANOVA with Sidak’s correction for multiple comparisons (k–m). *P < 0.05, **P < 0.01.
Fig. 7 ∣
Fig. 7 ∣. Asters are required for storage of dietary cholesterol as CEs in hepatocytes.
a, Total liver cholesterol in F/F and L-A/C KO mice after 12 weeks of WD feeding (n = 8 and 9). b, Total liver CEs from a (n = 3 and 3). c, Individual hepatic CE species (nmol mg−1 liver) from a (n = 3 and 3). d, Expression levels of the indicated genes from a (n = 8 and 12). e, Expression levels of the indicated genes in livers from Aster-A and Aster-C F/F mice transduced with AAV8-TBG-Cre compared to control AAV8-TBG-null for 2 weeks. Mice were then fed with WD for 4 weeks (n = 5 and 5). All data are presented as mean ± s.e.m. P values were determined by two-sided Student’s t-test (a,b), or two-sided Student’s t-test with Benjamini, Krieger and Yekutieli correction for multiple comparisons (c–e). *P < 0.05, **P < 0.01, ***P < 0.001, ****P < 0.0001.
Fig. 8 ∣
Fig. 8 ∣. Hepatic Aster deficiency disrupts systemic cholesterol homeostasis.
a, Plasma total cholesterol from 8-week-old F/F control and L-A/C KO mice fed a chow diet (n = 10 and 18). b, Cholesterol content of plasma lipoproteins fractionated by FPLC. c, Immunoblot analysis of hepatic ABCA1. Calnexin was used as a sample processing control (n = 5 and 5). d, Cholesterol efflux to ApoA-I by control and L-A/C KO primary hepatocytes (n = 3 and 3). e, Total adrenal [14C] radioactivity 3 d after [14C]-HDL administration (n = 8 and 5). Total adrenal [14C] counts are normalized per gram tissue and expressed relative to radioactivity in plasma 1 min after [14C]-HDL administration. f, Gross appearance of adrenal glands from representative 8-week-old F/F control and L-A/C KO mice (1 mm scale). g, Histological sections of the adrenal cortex stained with BODIPY from f. Data are representative of three independent samples. h,i, mRNA expression levels of the indicated genes in adrenal glands (h; n = 7 and 6) and brown adipose tissue (i, n = 7 and 7) from F/F control and L-A/C KO mice. All data are presented as mean ± s.e.m. P values were determined by two-sided Student’s t-test (a,d,e) or two-sided Student’s t-test with Benjamini, Krieger and Yekutieli correction for multiple comparisons (h,i). *P < 0.05, **P < 0.01, ***P < 0.001, ****P < 0.0001, *****P < 0.00001.

Comment in

References

    1. Lange Y, Swaisgood MH, Ramos BV & Steck TL Plasma membranes contain half the phospholipid and 90% of the cholesterol and sphingomyelin in cultured human fibroblasts. J. Biol. Chem 264, 3786–3793 (1989). - PubMed
    1. Das A, Brown MS, Anderson DD, Goldstein JL & Radhakrishnan A Three pools of plasma membrane cholesterol and their relation to cholesterol homeostasis. eLife 3, e02882 (2014). - PMC - PubMed
    1. Radhakrishnan A, Goldstein JL, McDonald JG & Brown MS Switch-like control of SREBP-2 transport triggered by small changes in ER cholesterol: a delicate balance. Cell Metab. 8, 512–521 (2008). - PMC - PubMed
    1. Anderson RA et al. Identification of a form of acyl-CoA: cholesterol acyltransferase specific to liver and intestine in nonhuman primates. J. Biol. Chem 273, 26747–26754 (1998). - PubMed
    1. Pikuleva IA Cholesterol-metabolizing cytochromes P450. Drug Metab. Dispos 34, 513–P520 (2006). - PubMed

Publication types