. 2023 Jan 16;13(1):803.
doi: 10.1038/s41598-023-27807-w.

Generation of myocyte agonal Ca2+ waves and contraction bands in perfused rat hearts following irreversible membrane permeabilisation

Affiliations

Generation of myocyte agonal Ca2+ waves and contraction bands in perfused rat hearts following irreversible membrane permeabilisation

Yuma Morishita et al. Sci Rep. .

Abstract

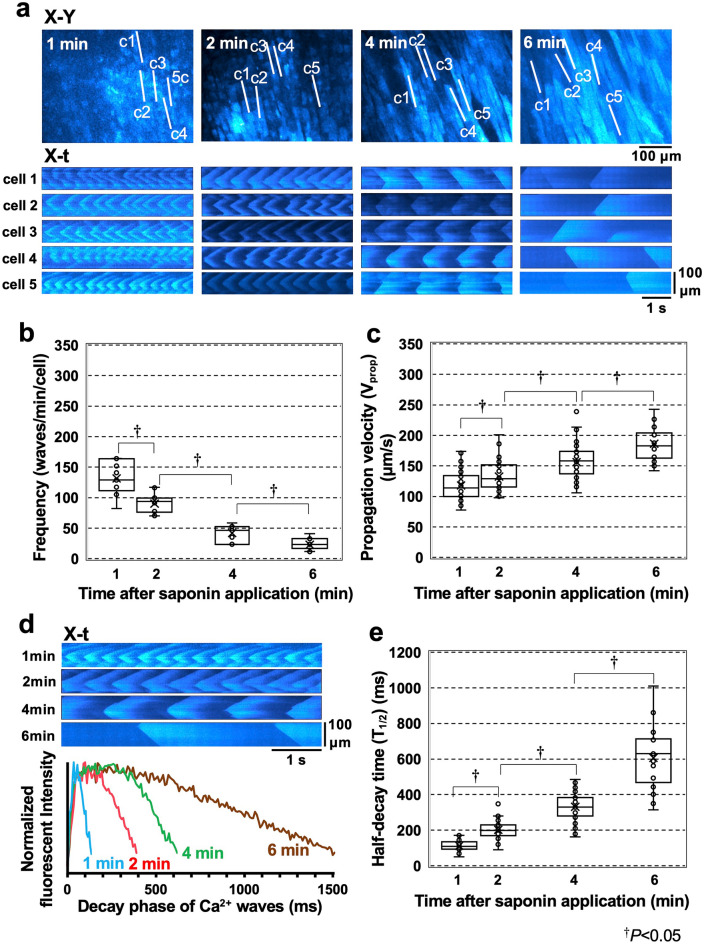
Although irreversible cardiomyocyte injury provokes intracellular Ca2+ ([Ca2+]i) overload, the underlying dynamics of this response and its effects on cellular morphology remain unknown. We therefore visualised rapid-scanning confocal fluo4-[Ca2+]i dynamics and morphology of cardiomyocytes in Langendorff-perfused rat hearts following saponin-membrane permeabilisation. Our data demonstrate that 0.4% saponin-treated myocytes immediately exhibited high-frequency Ca2+ waves (131.3 waves/min/cell) with asynchronous, oscillatory contractions having a mean propagation velocity of 117.8 μm/s. These waves slowly decreased in frequency, developed a prolonged decay phase, and disappeared in 10 min resulting in high-static, fluo4-fluorescence intensity. The myocytes showing these waves displayed contraction bands, i.e., band-like actin-fibre aggregates with disruption of sarcomeric α-actinin. The contraction bands were not attenuated by the abolition of Ca2+ waves under pretreatment with ryanodine plus thapsigargin, but were partially attenuated by the calpain inhibitor MDL28170, while mechanical arrest of the myocytes by 2,3-butanedione monoxime completely attenuated contraction-band formation. The depletion of adenosine 5'-triphosphate by the mitochondrial electron uncoupler carbonyl cyanide 4-trifluoromethoxy phenylhydrazone also attenuated Ca2+ waves and contraction bands. Overall, saponin-induced myocyte [Ca2+]i overload provokes agonal Ca2+ waves and contraction bands. Contraction bands are not the direct consequence of the waves but are caused by cross-bridge interactions of the myocytes under calpain-mediated proteolysis.


Conflict of interest statement

The authors declare no competing interests.

Figures

Figure 1
Figure 1
Development of high-frequency Ca2+ waves in response to saponin treatment. Sequential X–Y images (top panels, taken every 250 ms) of the subepicardial regions in the left ventricular myocardium over a 1500-ms period as indicated by the horizontal lines below the electrocardiogram (ECG) under the control conditions (left) and 1 min after the introduction of the saponin treatment (right). The X-t images (lower panels) for the fluo4-fluorescence intensity of five different cardiomyocytes (cells 1–5) when evaluated along the c1–c5 lines (100 μm) identified in the top panels.
Figure 2
Figure 2
Sequential changes in the nature of the high-frequency Ca2+ waves induced by saponin treatment. (a) X–Y images (upper panel) and corresponding X-t images (lower panel) for each of the five different cardiomyocytes (cells 1–5) scanned along the lines (c1–c5) identified in the X–Y images over a 6 min period. The sequential changes in the frequency (b) and propagation velocity (Vprop) (c) of the Ca2+ waves in these cells are represented as box plots. (d) Representative X-t images for each of the Ca2+ waves (upper panel) and the superimposed plot profiles of the wave decay patterns at 1, 2, 4, and 6 min after saponin treatment (lower panel). Each plot profile is shown as an averaged value of the profiles obtained from five different horizontal lines in each X-t image. (e) Sequential changes in the half-decay time (T1/2) of the Ca2+ waves. Statistical analyses were performed using the Kruskal‒Wallis test followed by the Steel‒Dwass test. P < 0.05.
Figure 3
Figure 3
Contraction-band formation in saponin-treated myocardial samples as revealed by confocal fluorescence imaging of actin and α-actinin. Images present the high-affinity actin probe phalloidin (red), sarcomeric α-actinin immunohistochemistry (green), and merged images in the absence (left) and presence of saponin (right). Magnified images of the merged evaluations are shown on the bottom. Note that saponin induces contraction-band formation, increasing actin aggregation and disrupting α-actinin.
Figure 4
Figure 4
Changes in the saponin-induced contraction bands under depletion of Ca2+ released from the SR by ryanodine (1 μM) and thapsigargin (5 μM). (a) The X–Y and X-t fluo4-fluorescence images before and 2 min, 4 min, and 6 min after commencement of saponin perfusion. Note the absence of Ca2+ waves before and after saponin application. (b) Fluorescence images of the subepicardial myocardium in the absence of saponin with (middle) and without (left) ryanodine (1 μM) and thapsigargin (5 μM). Fluorescence images of the saponin-induced contraction bands under combined pretreatment with ryanodine and thapsigargin (right).
Figure 5
Figure 5
Role of calpain in the production of saponin-induced contraction bands. (a) Sequential changes in the saponin-induced Ca2+ waves following pretreatment with MDL28170 at 100 μM. (b) Confocal fluorescence images of the myocardium in the absence (left) and presence (middle) of MDL28170 at 100 μM. Confocal fluorescence images of saponin-induced contraction bands in the presence of MDL28170 (right). Note that the saponin fails to disrupt α-actinin under pretreatment with MDL28170.
Figure 6
Figure 6
Prevention of saponin-induced contraction-band formation under pretreatment with 2,3-butanedione monoxime (BDM). (a) Sequential changes in saponin-induced Ca2+ waves in the presence of BDM (20 mM). X–Y images (upper) and the corresponding X-t images (cells 1–5) scanned along the c1–c5 lines (100 μm) derived from the individual myocytes identified in the X–Y images. (b) Images include myocytes under control conditions (left), in the presence of 20 mM BDM (middle), and under saponin treatment in the presence of BDM (right).
Figure 7
Figure 7
Saponin attenuates contraction-band formation in the myocardium treated with the mitochondrial uncoupling agent FCCP. (a) Fluo4-fluorescence images of the myocytes (cell 1–cell 5) before and 2-, 6-, and 10-min after the addition of saponin in the presence of FCCP at 10 μM. (b) Confocal fluorescence images of both actin filaments and α-actinin in the subepicardial myocardium of the control (left), in the presence of 10 μM FCCP (middle), and saponin treatment in the presence of FCCP (right).
Figure 8
Figure 8
Schematic presentation of the saponin-induced generation of Ca2+ waves and contraction bands with effects of various pharmacological interventions.

References

    1. Poole-Wilson PA, Harding DP, Bourdillon PD, Tones MA. Calcium out of control. J. Mol. Cell. Cardiol. 1984;16:175–187. doi: 10.1016/S0022-2828(84)80706-3. - DOI - PubMed
    1. Dong Z, Saikumar P, Weinberg JM, Venkatachalam MA. Calcium in cell injury and death. Annu. Rev. Pathol. 2006;1:405–434. doi: 10.1146/annurev.pathol.1.110304.100218. - DOI - PubMed
    1. Wier WG, Cannell MB, Berlin JR, Marban E, Lederer WJ. Cellular and subcellular heterogeneity of [Ca2+]i in single heart cells revealed by fura-2. Science. 1987;235:325–328. doi: 10.1126/science.3798114. - DOI - PubMed
    1. Berlin JR, Cannell MB, Lederer WJ. Cellular origins of the transient inward current in cardiac myocytes. Role of fluctuations and waves of elevated intracellular calcium. Circ. Res. 1989;65:115–126. doi: 10.1161/01.RES.65.1.115. - DOI - PubMed
    1. Takamatsu T, Wier WG. Calcium waves in mammalian heart: Quantification of origin, magnitude, waveform, and velocity. FASEB J. 1990;4:1519–1525. doi: 10.1096/fasebj.4.5.2307330. - DOI - PubMed

Publication types