. 2023 Feb;26(2):274-284.
doi: 10.1038/s41593-022-01229-9. Epub 2023 Jan 16.

A neural substrate of sex-dependent modulation of motivation

Affiliations

A neural substrate of sex-dependent modulation of motivation

Julia Cox et al. Nat Neurosci. 2023 Feb.

Abstract

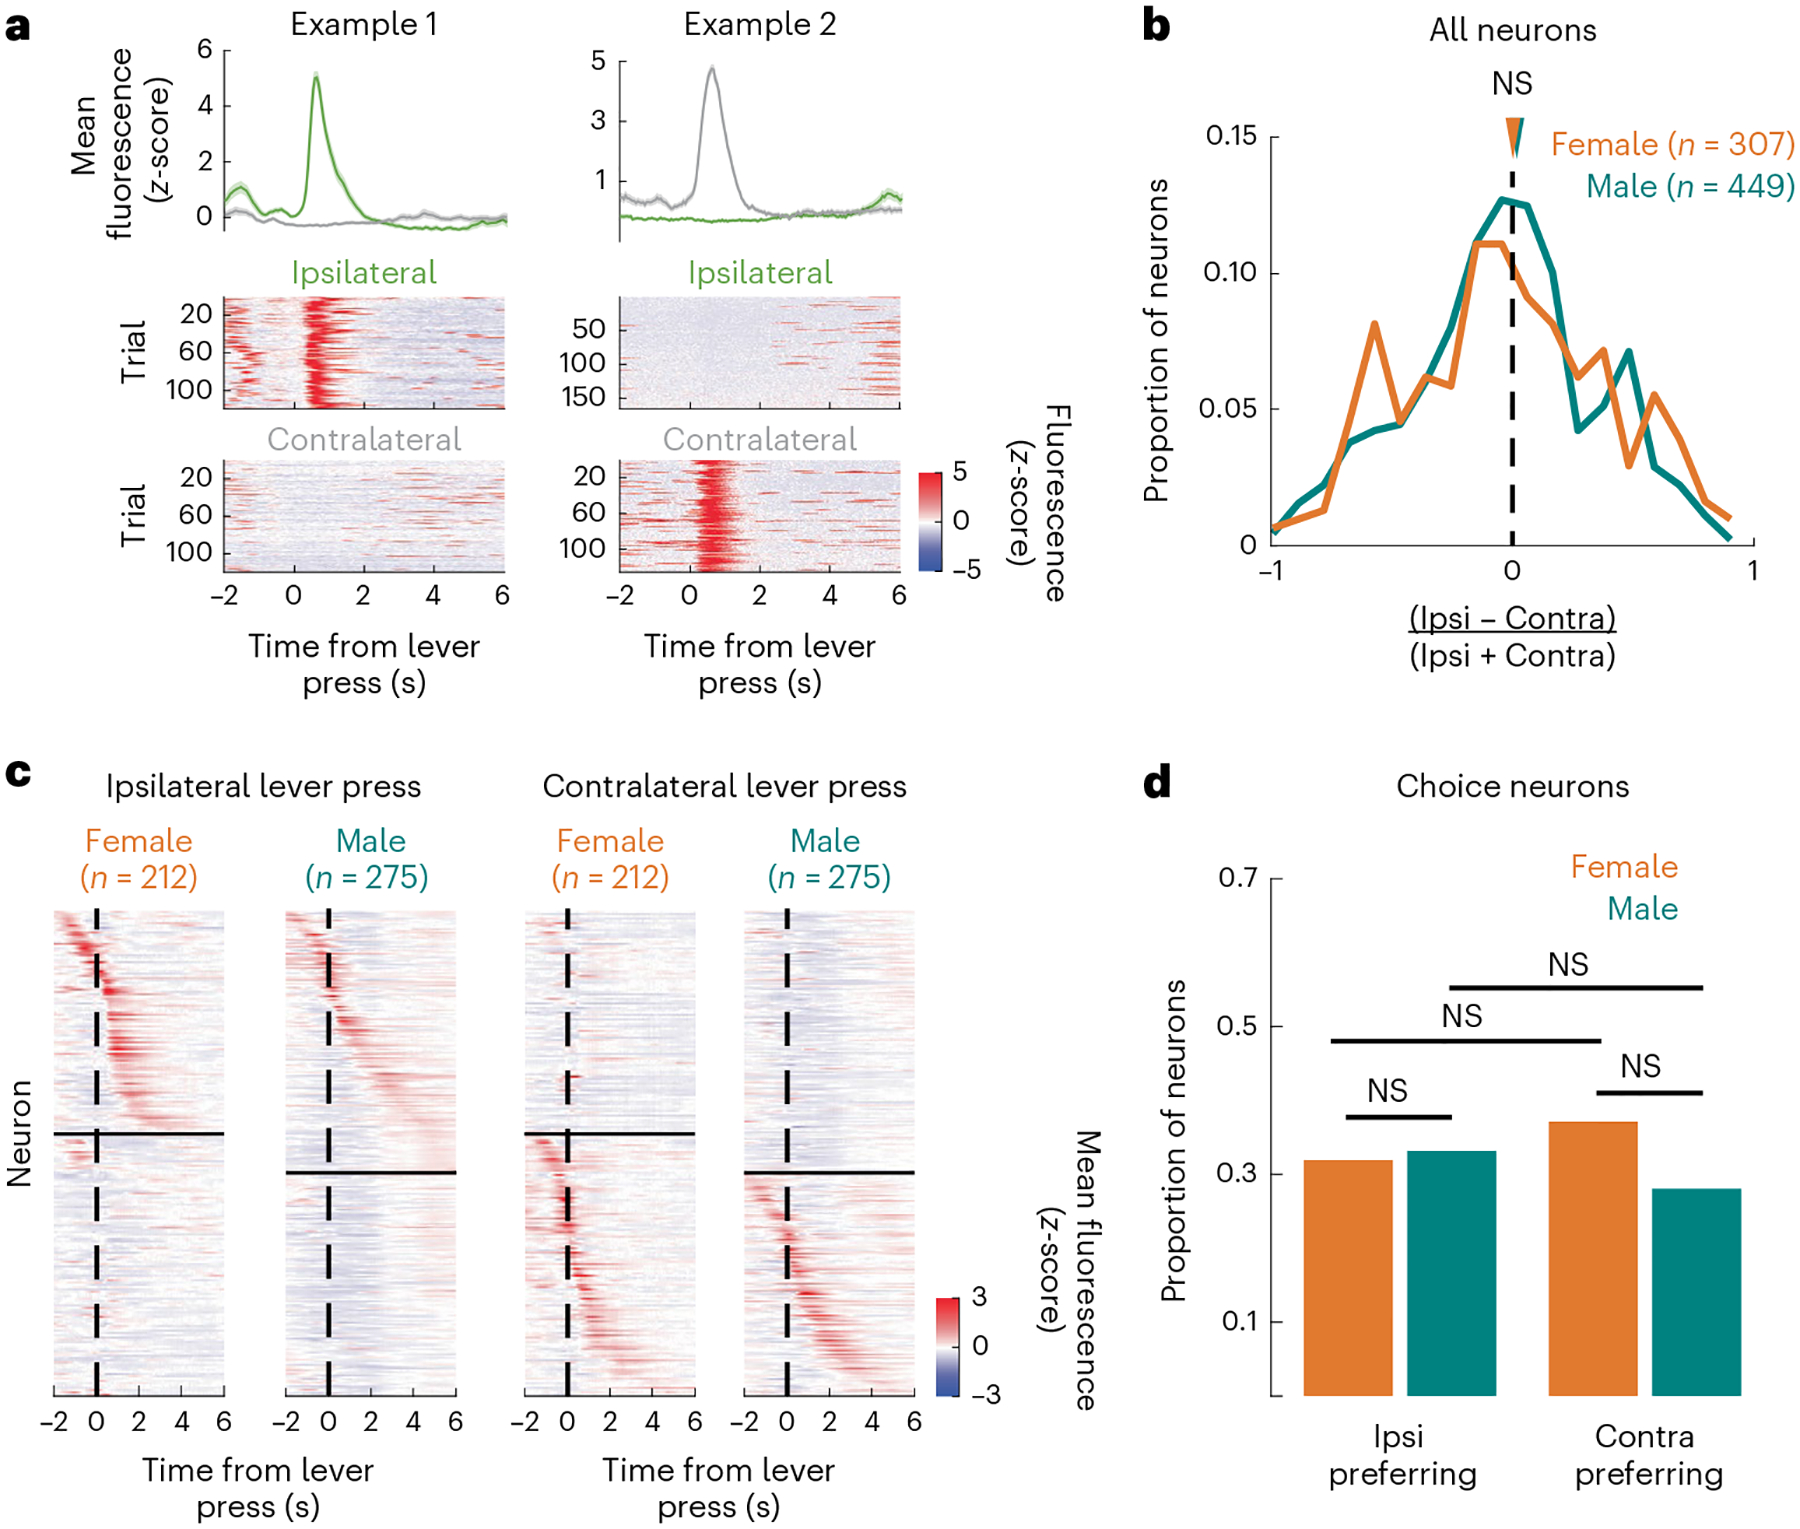
While there is emerging evidence of sex differences in decision-making behavior, the neural substrates that underlie such differences remain largely unknown. Here we demonstrate that in mice performing a value-based decision-making task, while choices are similar between the sexes, motivation to engage in the task is modulated by action value more strongly in females than in males. Inhibition of activity in anterior cingulate cortex (ACC) neurons that project to the dorsomedial striatum (DMS) preferentially disrupts this relationship between value and motivation in females, without affecting choice in either sex. In line with these effects, in females compared to males, ACC-DMS neurons have stronger representations of negative outcomes and more neurons are active when the value of the chosen option is low. By contrast, the representation of each choice is similar between the sexes. Thus, we identify a neural substrate that contributes to sex-specific modulation of motivation by value.


Conflict of interest statement

Competing interests

The authors declare no competing interests.

Figures

Extended Data Fig. 1 |
Extended Data Fig. 1 |. Sex differences in motivation to perform a value-based decision-making task in mice.
a. To quantify sex differences in the distribution of trial initiation latencies, we fit each animal’s data with a shifted inverse gaussian distribution. Top: probability distribution function for the shifted inverse gaussian. Middle: Cumulative distribution of trial initiation latencies (shaded line) and fit (dashed line) for example females (orange) and males (green). Bottom: Probability distribution function of trial initiation latencies (shading) and fit (dashed line) for example females (orange) and males (green) for 1–10 seconds. b. Parameter estimates for each mouse. Translucent circles are individual animals, crosses are mean and SEM across males or females. Comparisons between males and females were performed with 2-sided Wilcoxon rank sum tests. μ:Z=-4.44,p=9.04×10⁶; λ:Z=-5.46,p=4.65×10⁸; θ:Z=5.19,p=2.06×10⁷. c. Histograms of trial initiation latencies binned in log-space for males and females following rewarded and unrewarded trials. Top panels are the mean and SEM across animals, and the bottom panels show the histograms separately for each animal. Trials preceded by reward or no reward are plotted separately. d. Trial initiation latencies binned as short (<1 s), medium (1–10 s) and long (>10 s) for previously rewarded and unrewarded trials for males and females. Males had more short trials than females (2-sided Wilcoxon rank sum tests, reward: Z = −3.90, p = 9.7 × 10⁻⁵; unrewarded: Z = −6.01, p = 1.9 × 10⁻⁹). Females had more medium trials than males (2-sided Wilcoxon rank sum tests, rewarded: Z = 4.20, p = 2.6 × 10⁻⁵; unrewarded: Z = 5.62, p = 1.9 × 10⁻⁸). Females had more long trials only following unrewarded outcomes (2-sided Wilcoxon rank sum tests, rewarded: Z = 1.37, p = 0.17; unrewarded: Z = 4.21, p = 2.5 × 10⁻⁵). e. Daily fluctuations in weight affected value modulation of trial initiation latencies similarly in males and females (mixed effects regression of latency with sex, weight, relative chosen value, trial number and their interactions as fixed effects; see Supplementary Table 5 for details. Significance of coefficients was assessed with F tests: weight: F(1,55.95) = 8.87, p = 0.004; sex:weight: F(1,55.95) = 13.03, p = 6.55 × 10⁻⁴; relative_chosen_value:weight: F(3,135.8)=28.57, p = 2.20 × 10⁻¹⁴; sex:relative_chosen_value:weight: F(3,135.8) = 1.60, p = 0.19. For each mouse, sessions were binned in terciles of weight and trials were divided into quantile bins of relative chosen value. Trial initiation latencies were then averaged for each bin. n = 35 females and 36 males. One male maintained constant weight throughout the experiment and was excluded from this plot. f. Sessions were divided based on weight, and trial initiation latencies were binned in 4 quantile bins of relative chosen value and averaged for each animal. g. Average trial initiation latency versus relative chosen value in 30 min bins for males and females. Trials were binned based on time in session as well as in quantiles of relative chosen value and averaged for each mouse. Trial number significantly affected trial initiation latencies but there was no effect of trial on the interaction between relative chosen value and sex (see Supplementary Table 5 for details; trial: F(1,66.20) = 392.34, p = 1.60 × 10⁻²⁹; sex:trial: F(1,66.20) = 4.08, p = 0.05; sex:trial:relative_chosen_value: F(3,100.02) = 1.45, p = 0.23). h. Following unrewarded trials, only females modulated their trial initiation latencies based on the upcoming stay versus switch decision. There was a significant effect of sex, stay/switch and a significant interaction between sex and stay/switch, reflecting greater modulation of trial initiation latency by whether or not the upcoming trial was a stay or switch trial in females compared to males (mixed-effects regression: latency ~ sex + stay + sex:stay + (1 + stay|subject); sex: F(1,424000) = 857.46, p = 6.67 × 10−188; stay: F(1,37.27) = 13.02, p = 8.99 × 10⁻⁴; sex:stay: F(1,23373) = 9.54, p = 0.002). Females were significantly slower than males to initiate stay and switch trials (2-sided Wilcoxon rank sum tests; switch male vs. female: Z = 4.55, p = 5.3 × 10⁻⁶; stay male vs. female: Z = 4.83, p = 1.34 × 10⁻⁶). In females, trial initiation latencies for switch trials were slower than stay trials. There was no difference between trial types in males (2-sided Wilcoxon signed rank tests. Female: Z = 3.52, p = 4.29 × 10⁻⁴; Male: Z = 1.26, p = 0.21). ** p < 0.01, *** p < 0.001; n = 37 males, 35 females. b–h. Error bars or shading are standard error of the mean.
Extended Data Fig. 2 |
Extended Data Fig. 2 |. Trial initiation latency was modulated by total value.
a. Trial-by-trial total value (QCh+QU, where QCh and QU are the action values for the chosen and unchosen lever, respectively) was divided into quartiles for each animal, and trial initiation latencies were averaged in quartile bins. To compare how total value influenced trial initiation latency in males and females we fit the following mixed effects regression: trial_initiation_ latency ~ Sex + Total_value + Trial + Weight + Sex:Total_value + Trial:Total_value + Trial:Sex + Weight:Total_value + Weight:Sex + Weight:Sex:Total_value + Trial:Sex:Total_value + (1 + Total_value + Weight + Trial + Weight:Total_value + Trial:Total_value|subject) + (1 + Total_value + Trial + Total_value:Trial|ses sion:subject). Model was fit with effects coding and significance was determined with F tests using the Satterthwaite method to estimate degrees of freedom. Total value and the interaction between sex and total value significantly affected trial initiation latency (Sex: F(1,56.35) = 4.13, p = 0.05; Trial: F(1,66.31) = 355.60, p < 0.001; Total_value: F(3,108.22) = 84.79, p = 2.71 × 10⁻²⁸; Weight: F(1,57.03) = 12.21, p = 9.27 × 10⁻⁴; Trial:Sex: F(1, 66.31) = 2.42 p = 0.13; Trial:Total_value: F(3,97.95) = 49.40, p = 1.56 × 10⁻¹⁹; Sex:Total_value: F(3, 108.22) = 19.03, p = 5.52 × 10⁻¹⁰; Sex:Weight: F(1, 57.03) = 11.97, p = 0.001; Total_Value:Weight: F(1,144.71) = 17.59, p = 8.66 × 10⁻¹⁰; Trial:Sex:Total_value: F(3, 97.95) = 0.10, p = 0.96; Weight:Sex:Total_ value: F(3, 144.71) = 1.52, p = 0.21). Specifically, females were slower than males to initiate low total value trials (2-sided Wilcoxon rank sum tests between males and females: bin 1: Z = 4.06, p = 4.99 × 10⁻⁵; bin 2: Z = 3.46, p = 5.42 × 10⁻⁴; bin 3: Z = 3.17, p = 0.002; bin 4: Z = 1.75 p = 0.08). n = 37 females, 35 males. b. Inhibition of ACC-DMS neurons decreased the influence of total value on trial initiation latency in females. To determine how the effect of inhibition on trial initiation latencies was influenced by sex and opsin, we divided trials into quartile bins of total value and averaged trial initiation latencies for laser and non-laser trials in each bin. We then fit a linear mixed-effects model to the difference between laser and non-laser trials with sex, total value, opsin and their interactions as fixed effects and random intercepts for each subject. The effect of inhibition depended on sex and and its interaction with opsin (2-sided F-tests: sex:opsin: F(1,29) = 4.95, p = 0.03, sex: F(1,29) = 14.48, p = 6.77 × 10⁻⁴; opsin: F(1,29) = 3.25, p = 0.08; total value: F(1,29) = 4.13, p = 0.01, sex:total value quantile: F(3,29) = 1.51, p = 0.23; opsin:total value quantile: F(3,29) = 0.36, p = 0.78, sex:opsin:total value quantile: F(3,29) = 0.55, p = 0.65). Specifically, females expressing NpHR were significantly faster to initiate trials following inhibition compared to control trials (2-sided Wilcoxon rank sum tests, bin 1: W = 35, p = 0.02; bin 2: W = 35, p = 0.02; bin 3: W = 36, p = 0.008, bin 4: W = 36, p = 0.008). In males, trial initiation latencies for laser and non-laser trials did not differ in any bin (2-sided Wilcoxon signed rank tests, p > 0.1 for all comparisons). n = 8 females, 9 males. c. Significantly more neurons encoded upcoming total value during the outcome in females than males (χ2-test, χ2(1,N=756)=13.58, p = 2.3 × 10⁻⁴). Proportions of neurons encoding current trial total value did not differ between males and females for any task event (χ2-tests, all p > 0.3). d. Outcome activity was averaged across time (8 seconds from presentation of the outcome) and averaged in 3 quantile bins of total value. The left plots show the value modulation for all total value encoding neurons in females and males and the right-most plot shows the mean and SEM across neurons for males and females. (a, b) Circles are data from individual mice and lines show across animal averages and error bars standard error of the mean. * p < 0.05, ** p < 0.01, ***p < 0.001.
Extended Data Fig. 3 |
Extended Data Fig. 3 |. Estrous cycle modulates trial initiation latencies.
a. Representative images of vaginal cells across the estrous cycle. Scale bar is 50 μm. b. Estrous cycle significantly modulated the relationship between relative chosen value and trial initiation latency. (Mixed effects regression, significance assessed with one-sided F tests using the Satterthwaite method to estimate degrees of freedom: trial initiation latency ~ relative_chosen_value + estrous_stage + relative_chosen_value:estrous_stage + (1 + relative_chosen_value|subject)). Relative_chosen_value: F(3,13.54) = 95.70, p = 2.32 × 10⁻⁹; Estrous_stage: F(1,164410) = 0.72, p = 0.40; Relative_chosen_value:Estrous_stage: F(3,8481) = 6.07, p = 4.04 × 10⁻⁴. Post-hoc comparisons of trial initiation latencies during proestrus/estrus and metestrus/diestrus for each value bin were performed with F tests for each contrast using the Satterthwaite method to estimate degrees of freedom (bin 1: F(1,69433) = 13.35, p = 2.59 × 10⁻⁴; bin 2: F(1,34944) = 0.48, p = 0.45; bin 3: F(1,10493) = 1.46, p = 0.23; bin 4: F(1,4571) = 2.82, p = 0.09). *** p < 0.001.
Extended Data Fig. 4 |
Extended Data Fig. 4 |. Gender differences in human subjects performing the self-initiated probabilistic reversal learning task.
a. Schematic of the online task. After an intertrial interval (ITI), trial start was cued with the appearance of a plus sign (‘+’) on the screen. Subjects initiated a trial by pressing the spacebar which led to the presentation of 2 colored circles on either side of the screen. Subjects indicated their choice by pressing the ‘a’ key for a left choice and the ‘l’ key for a right choice. The outcome was then presented, indicating the number of points received for that choice (rewarded: +10, unrewarded +0) accompanied by auditory cues indicating reward (bell-like sound) or no reward (buzzer). High probability choices were rewarded 60% of the time and low probability choices 10% of the time and the identity of the high and low choice alternated as in the mouse task (see Methods for details). b. Box-plots of the estimates of Q-learning parameters fit with the same hierarchical model used for the mice. The centers are median, the bottom and top of the boxes indicate 25th and 75th percentiles, respectively. Whiskers are the minimum and maximum values that are not outliers (outliers defined as greater (or less) than the 75th percentile (or 25th percentile) plus (or minus) 1.5x the interquartile range. c-d) Choice was similar between men and women. There was a significant main effect of relative side value, but no effect of gender on how relative side value modulated the probability of choosing the right option (mixed-effects, logistic regression: choice ~ relative_side_value_quantile + gender + age + sex:relative_side_value_quantile + sex:age + relative_side_value_quantile:age + sex*relative_side_value_quantile:age + (1 + relative_side_value_quantile|subject). relative side value: F(1,142180) = 100.5, p = 8.58 × 10−209; gender: F(1,142180) = 1.20, p = 0.27; age: F(1,142180) = 0.98, p = 0.32; relative_side_value:gender: F(1,142180) = 0.72, p = 0.71; gender:age: F(1,142180) = 1.26, p = 0.26; relative_side_value:age: F(10,142180) = 0.73, p = 0.70; relative_side_value:gender:age: F(1,142180) = 0.62, p = 0.80, gender was a categorical variable and age was z-scored. Significance was assessed with 2-sided F tests). c. Trials were divided into 11 quantile bins of relative side value and the probability of making a right choice was averaged by bin for each subject younger than or equal to the median age (between 19 and 39 years old). Error bars are standard error of the mean. d. Same as c, except for subjects 40–70 years old. e. Trial initiation latencies were significantly affected by age in men, but not women (linear correlation, males: r = 0.16, p = 0.02, females: r = −0.006, p = 0.95). f-g) The modulation of trial initiation latency by value differed in males and females, and this effect was modulated by age (mixed-effects regression with relative chosen value quantile, gender, age and their interactions as fixed effects and random effects of subject. relative_chosen_value: F(4,1754) = 3.46, p = 0.008: gender: F(1,1754) = 1.68 × 10⁻⁴, p = 0.99; age: F(1,1754) = 1.62 × 10⁻⁴, p = 0.99; relative_chosen_value:gender: F(4,1754) = 2.49, p = 0.04; relative_chosen_value:age: F(4,1754) = 6.71, p = 2.36 × 10⁻⁵; gender:age: F(1,1754) = 1.16 × 10⁻⁴, p = 0.99; relative_chosen_value:gender:age: F(4,1754) = 2.46, p = 0.04; n = 141 women, 209 men). f. Trials were divided into 5 quantile bins of relative chosen value for males and females 19–39 years old and trial initiation latencies were averaged by bin. Error bars are standard error of the mean. Two-sided Wilcoxon rank sum tests showed that women were significantly slower than men to initiate trials in the lowest quantile bin of relative chosen value (bin 1: Z = −2.01, p = 0.04, bin 2: Z = −0.10, p = 0.92, bin 3: Z = 0.79, p = 0.43, bin 4: Z = 1.35, p = 0.18, bin 5: Z = 0.54, p = 0.59) g. Same as f except for subjects aged between 40 and 70. There were no significant differences in trial initiation latencies between males and females older than 39 (2-sided Wilcoxon rank sum tests, p > 0.07). QCh: action value for the chosen lever; QU: action value for the unchosen lever; QR: action value for the right lever; QL: action value for the left lever; * p < 0.05.
Extended Data Fig. 5 |
Extended Data Fig. 5 |. Location of fiber tips for optogenetic inhibition.
Circles indicate animals expressing NpHR and squares indicate animals expressing EYFP. Orange: females, green: males.
Extended Data Fig. 6 |
Extended Data Fig. 6 |. Laser during outcome presentation had no effect on trial initiation latencies or choice in mice expressing EYFP in ACC-DMS neurons.
a. Comparisons between shifted inverse gaussian fits from laser and non-laser trials revealed no differences in EYFP-expressing males or females. (2-sided Wilcoxon signed rank tests, females: scale: W = 19, p = 0.09, shape: W = 4, p = 0.22 shift: W = 12, p = 0.84, males: shape: W = 15, p = 0.44, scale: W = 12, p = 0.84, shift: W = 15, p = 0.44, n = 6 females, 6 males; Data is presented as mean ± SEM). b. Trial initiation latencies averaged in quartile bins of relative chosen value (QCh-QU, where QCh and QU are the action values for the chosen and unchosen lever, respectively) for mice expressing EYFP in ACC-DMS neurons. Paired comparisons between laser and non-laser trials were performed for each bin with 2-sided Wilcoxon signed rank tests (Female laser v. no laser bin 1: W = 17, p = 0.22, bin 2: W = 20, p = 0.06, bin 3: W = 6, p = 0.31, bin 4: W = 20, p = 0.06; Male bin 1: W = 16, p = 0.31, bin 2: W = 10, p = 1, bin 3: W = 19, p = 0.09, bin 4: W = 13, p = 0.69; Data is presented as mean ± SEM). c. The probability of making a right choice was averaged in quantile bins of relative side value (QR-QL, where QR and QL are the action values for the right and left lever, respectively) for each animal and averaged. Error bars are SEM.
Extended Data Fig. 7 |
Extended Data Fig. 7 |. Similar excitatory postsynaptic potentials evoked by ACC-DMS stimulation in D1R and D2R MSNs in males.
a. Schematic of viral strategy to express ChR2 in ACC neurons (top), and record optogeneticallyevoked excitatory postsynaptic potentials (EPSPs) in DMS (bottom). b. Schematic of paired, sequential recordings of neighboring MSNs, where MSNs were visually identified as D1R MSNs (tdTomato+) or D2R MSNs (tdTomato−). Brief light pulses elicited EPSPs from ChR2-expressing ACC terminals. c. Example EPSPs measured in pairs from a D1R MSN (red) and D2R MSN (grey). Traces are mean responses across trials from a single cell. Shading is SEM. Blue line indicates the time of light stimulation. d. Summary of EPSP amplitudes. Each line is data from a pair of MSNs. A mixed effects regression revealed no effect of cell-type on EPSP. The model was EPSP ~ msn_type + (1|subject) + (1|subject:pair). Significance was assessed with a 2-sided F-test using the Satterthwaite method to estimate degrees of freedom; msn_type: F(1,9) = 0.67, p = 0.43. N = 3 mice, 9 pairs.
Extended Data Fig. 8 |
Extended Data Fig. 8 |. Center of imaging fields in ACC.
Color indicates whether the subject was male (green) or female (orange). Circles indicate lens implants and squares are prism implants.
Extended Data Fig. 9 |
Extended Data Fig. 9 |. Task-related activity of ACC-DMS neurons.
a. Trial-averaged, time-locked fluorescence to each task event for all imaged neurons. Neurons are sorted by the time of their peak fluorescence. b. Histograms showing the distribution of all imaged neurons, of the approximate numerical integral of the response kernel for the ‘no reward’ temporal kernel from the regression used to assess significant outcome encoding. The histograms are plotted separately for male and female neurons. The sign of the integral of the ‘no reward’ response kernel was used to classify neurons as reward-preferring (negative) or no reward-preferring (positive). c. Same as b for the ‘ipsilateral lever press’ event in the regression used to assess significant choice encoding. The sign of the integral was used to classify neurons as contra-preferring (negative) or ipsi-preferring (positive). d. Same as b for the ‘reward to stay’ event (left) and the ‘no reward to stay’ event (right) in the regression used to assess significant stay versus switch encoding. The sign of the integral was used to classify neurons as stay-preferring (positive) or switch-preferring (negative) for rewarded (left) and unrewarded (right) trials. n = 307 female neurons, 449 male neurons.
Extended Data Fig. 10 |
Extended Data Fig. 10 |. Bilinear encoding models allow value to multiplicatively modulate all event-related temporal kernels.
a. Schematic of the encoding model used to estimate how trial-by-trial fluctuations in relative side value (QI-QL, where QI and QC are the action values for the lever ipsilateral and contralateral to the imaging field, respectively) or relative chosen value (QCh-QU, where QCh and QU are the action values for the chosen and unchosen lever, respectively) influences responses to each task event. For each neuron, GCaMP6f fluorescence was estimated as the sum of all event kernels multiplied by the gain coefficients (an offset gain as well as gains for relative chosen value (Fig. 6a–c) or relative side value (Fig. 6d–f)). b. Fluorescence (gray) and estimated fluorescence (green) from the same neuron during the outcome period on 3 trials with different upcoming relative chosen values (labeled on bottom). c. Schematic of the 2-step iterative fitting procedure (see Methods for more details). d. The proportion of neurons significantly encoding current relative chosen value during all task events for males and females. Significantly more neurons encoded current trial relative chosen values in females compared to males during the nose poke event (χ2-test, χ2(1,N=756)=4.04, p = 0.04) and significantly more neurons encoded current trial relative chosen value in males compared to females during the outcome event (χ2-test, χ2(1,N=756)=5.30, p = 0.02). There were no sex differences in the encoding of relative chosen value for any other task events (χ2-test, p > 0.05). e. The proportion of neurons significantly encoding current relative side value during the nose poke, lever presentation, and outcome periods and the upcoming relative side value during rewarded and unrewarded outcomes. Significantly more neurons encoded upcoming relative side value in males compared to females during rewarded outcomes (χ2-test, χ2(1,N=756)=5.35, p = 0.02).
Fig. 1 |
Fig. 1 |. Sex-dependent modulation of motivation, but not choices, by previous outcome and value.
a, Schematic of the self-initiated probabilistic reversal learning task. Rewarded outcomes were signaled with a tone (‘CS+’) whereas unrewarded outcomes were signaled with a white noise auditory stimulus (‘CS’). b, The probability that mice returned to the previously selected lever was similarly modulated by previous outcome in males and females (see Supplementary Table 1 for statistics). c, Previous outcome affected trial initiation latencies to a greater extent in females than in males (Supplementary Table 2). Both males and females were significantly slower to initiate trials following rewarded compared to unrewarded outcomes (females: F(1,72)=190.35, P=6.66×10²²; males: F(1,72)=93.81, P=1.12×10¹⁴; one-sided F tests of contrast). Females were significantly slower than males to initiate trials following unrewarded outcomes (males versus females previously unrewarded: F(1,136.5)=27.80, P=5.13×10⁷; F tests of contrast) but not following rewarded trials (males versus females previously rewarded: F(1,136.5)=1.95, P=0.16; one-sided F tests of contrast). d, Q-learning model used to estimate trial-by-trial action values for the right and left levers. See Methods for details. e, Box plots of Q-learning model parameter estimates for males and females averaged across sessions. The center line is the median, and the bottom and top of the box indicate the 25th and 75th percentiles, respectively. Whiskers extend to the minimum and maximum values that are not outliers (with outliers defined as values greater (less) than the 75th (25th) percentile plus (minus) 1.5 times the interquartile range). f, Example performance of a mouse and the model. Shading indicates that the lever was rewarded with a high probability: gray shading, right lever; no shading, left lever. Black lines indicate the choice made by the mouse (right on top, left on bottom). Rewarded trials are marked with a blue oval, and relative side value (QR-QL, where QR and QL are the action values for the right and left levers, respectively) is plotted in black. g, Choice was significantly and similarly modulated by relative side value in males and females (one-sided F tests: sex: F(1,817,473)=1.85, P=0.17; relative side value: F(1,817,473)=310.3, P<0.001; sex × relative side value: F(1,817,473)=0.94, P=0.48; see Supplementary Table 4 for details). For plotting, trials were divided into nine quantile bins of relative side value and the probability of making a right choice was calculated for each bin for each mouse. h, Trial initiation latency was significantly modulated by relative chosen value (QCh-QU, where QCh and QU are the action values for the chosen and unchosen levers, respectively) to a greater extent in females than in males (one-sided F tests: sex: F(1,51.99)=7.70, P=0.01; relative chosen value: F(3,110.40)=78.37, P=3.11×1027; sex × relative chosen value: F(3,110.40)=24.70, P=2.62×10¹²; see Supplementary Table 5 for details; post hoc two-sided Wilcoxon rank-sum tests (male versus female): bin 1: z=3.43, P=6.15×10⁴; bin 2: z=4.00, P=6.34×10⁵; bin 3: z=2.30, P=0.02; bin 4: z=2.23, P=0.03). For each mouse, trials were divided into quartiles of relative chosen value and trial initiation latencies were averaged for each bin. In b,c,e,g,h, circles represent individual mice, lines or bars represent averages across mice and error bars are s.e.m.; males (green): n=37; females (orange): n=35. ***P < 0.001, *P < 0.05.
Fig. 2 |
Fig. 2 |. ACC–DMS inhibition increases motivation in female mice, especially on trials with low relative chosen value, without affecting choice in either sex.
a, Left, schematic of the viral strategy to target ACC neurons projecting to the DMS. Right, example histology showing NpHR–EYFP expression and the lesions from optic fibers. Inset, confocal image of neurons expressing NpHR–EYFP. Scale bar, 50 μm. b, Schematic of the inhibition experiment. Effects of inhibition were assessed by comparing trial initiation latencies on trials preceded by inhibition (laser trials; indicated by the green arrow) to those not preceded by inhibition (non-laser trials). c, Each mouse’s trial initiation latencies were fit with a shifted inverse Gaussian distribution separately for laser and non-laser trials. Top, the shifted inverse Gaussian distribution. Bottom, illustration of the influence of each parameter on the distribution. d, The laser significantly affected trial initiation latencies only in females. The scale parameter (μ) was significantly lower for laser trials than for control trials in females expressing NpHR (W=36, P=0.008, two-sided Wilcoxon signed-rank test). There were no differences between estimates for the shape or shift parameter for laser and control trials, and no parameters were affected in males (two-sided Wilcoxon signed-rank tests, P>0.1). Transparent circles, individual mice; opaque circles, average across mice; error bars, s.e.m. e, ACC–DMS inhibition affected trial initiation latencies in females expressing NpHR on trials with low relative chosen value (see Supplementary Table 7 for details of the mixed-effects regression; post hoc comparisons between laser and control trials for males and females: female laser versus no laser: value bin 1: W=35, P=0.02; value bin 2: W=34, P=0.02; value bin 3: W=32; P=0.06; value bin 4: W=31, P=0.08; n=8; male laser versus no laser: value bin 1: W=27, P=0.65; value bin 2: W=27, P=0.65; value bin 3: W=37, P=0.10; value bin 4: W=34, P=0.20; two-sided Wilcoxon signed-rank tests). f, ACC–DMS inhibition had no effect on choice (see Supplementary Table 9 for details of the mixed-effects regression). In e,f, average and s.e.m. across mice (top) and data from individual mice (bottom) are shown. n=8 females and 9 males. *P < 0.05, **P < 0.01; NS, not significant.
Fig. 3 |
Fig. 3 |. Similar excitatory synaptic strength of ACC–DMS neurons on D1R versus D2R MSNs in males and females.
a, Schematic of the viral strategy to express ChR2 in ACC neurons (top) and record optogenetically evoked excitatory postsynaptic currents (EPSCs) in the DMS (bottom). b, Schematic of paired, sequential recordings of neighboring MSNs, where MSNs were visually identified as D1R MSNs (tdTomato+) or D2R MSNs (tdTomato). Brief light pulses elicited EPSCs from ChR2-expressing ACC terminals. c, Example EPSCs measured in pairs including a D1R MSN (red) and a D2R MSN (gray) in brain slices taken from female (top row) or male (bottom row) mice. Traces are mean responses across trials from a single cell. Shading corresponds to s.e.m. The blue line indicates the time of light stimulation. d, Summary of EPSC amplitudes in MSN pairs from female (left) and male (right) mice. A linear mixed-effects regression on EPSC amplitudes showed no effect of MSN subtype, sex or their interaction (one-sided F tests: MSN subtype: F(1,25)=0.940, P=0.342; sex: F(1,8.497)=0.062, P=0.809; MSN subtype × sex: F(1,25)=2.442, P=0.131; see Supplementary Table 10 for details of the mixed-effects regression).
Fig. 4 |
Fig. 4 |. More ACC–DMS neurons respond during unrewarded outcomes in female than in male mice.
a, Left, schematic of the strategy to express GCaMP6f specifically in ACC–DMS neurons. Right, example histological section with a lesion from the GRIN lens in the ACC and expression of GCaMP6f. Inset, confocal image of expression in individual ACC–DMS neurons. Scale bar, 50 μm. b, Top, mean projection from an example imaging session (left) and the location of regions of interest extracted using CNMFe (right). Bottom, example fluorescence traces from the circled regions of interest. c, Example outcome responses of two ACC–DMS neurons. Top, trial-averaged z-scored fluorescence time-locked to the CS+ (red) and CS (blue) presentation. Heatmaps show the CS-triggered activity for all rewarded (middle) and unrewarded (bottom) trials. d, Distributions of an outcome-modulation index for ACC–DMS neurons. The outcome-modulation index was significantly more negative (that is, biased toward negative outcomes) in neurons from female versus male mice (two-sided Wilcoxon rank-sum test: z=5.22, P=1.78×10⁷). Arrowheads indicate the median of each distribution. e, Trial-averaged z-scored fluorescence time-locked to CS presentation for all neurons that significantly encoded outcome (Methods). Outcome-encoding neurons were reward-preferring or no reward-preferring neurons (above or below the black line, respectively; Methods and Extended Data Fig. 9b), and each subset of neurons was then separately sorted by the time of their peak fluorescence. f, Females had more outcome-encoding and more no reward-preferring neurons than males, and males had more reward-preferring neurons than females (χ2 test for the proportion of outcome-encoding neurons in males and females: χ2(2,n=756)=24.16, P=5.67×10⁶; paired comparisons performed with the Marascuilo procedure with alpha = 0.01). In females, 177 of 307 neurons (57.7%) significantly encoded outcome, with 13 of these (7.3%) reward-preferring and 164 (92.7%) no reward-preferring. In males, 213 of 449 neurons (47.4%) significantly encoded outcome, with 47 of these (22.1%) reward-preferring neurons and 166 (77.9%) no reward-preferring neurons. g, Example neurons that were preferentially active during unrewarded outcomes preceding trials when the mouse was going to switch to the alternative lever (left) or return to the previously selected lever (right) on the next trial. Top, trial-averaged fluorescence. Fluorescence during unrewarded outcomes for all upcoming stay trials (middle) and switch trials (bottom). h, Top, there was no difference in the proportion of neurons significantly encoding stay versus switch during rewarded outcomes in male versus female mice (χ2 test: χ2(2,n=756)=3.5, P=0.17). Bottom, significantly more neurons encoded stay versus switch in females than in males during unrewarded outcomes (χ2 test: χ2(2,n=756)=27.35, P=1.1×10⁶). There was no sex difference in the proportion of stay-preferring neurons (see Methods and Extended Data Fig. 9d for classification of neurons), but females had significantly more switch-preferring neurons than males. Additionally, females had more switch-preferring than stay-preferring neurons, while in males there was no difference (Marascuilo procedure with alpha = 0.01 for paired comparisons). In c,g, shading is s.e.m. ** P < 0.01, *** P < 0.001.
Fig. 5 |
Fig. 5 |. Similar correlates of contralateral versus ipsilateral actions in ACC–DMS neurons of females and males.
a, Example neurons preferentially active during ipsilateral (left) and contralateral (right) trials relative to the imaged side. Top, trial-averaged fluorescence traces. All ipsilateral (middle) and contralateral (bottom) trials are shown. Shading corresponds to s.e.m. b, Distribution of choice-modulation index in males and females. The choice-modulation indices were not different between males and females (two-sided Wilcoxon rank-sum test: z=1.10, P=0.27). Arrowheads indicate the median of each distribution. c, Trial-averaged z-scored fluorescence for ipsilateral and contralateral lever press events for neurons significantly modulated by choice (212/307, 69.1% in females and 275/449, 61.25% in males). Neurons above the black line were classified as ipsilateral choice-preferring neurons and those below the black line were classified as contralateral choice-preferring neurons (see Extended Data Fig. 9c and Methods for details). d, There were no significant differences in the proportion of ipsilateral- and contralateral-preferring neurons within or between the sexes (χ2 test: χ2(2,n=756)=7.94, P=0.02; Marascuilo procedure with alpha = 0.05).
Fig. 6 |
Fig. 6 |. More relative chosen value encoding, but similar relative side value encoding, in females compared to males.
a, Example fluorescence time-locked to the CS, plotted by quantile bin of relative chosen value (QChosenQunchosen). Examples 1 and 2 were more active preceding trials with low relative chosen value, and examples 3 and 4 were more active preceding trials with high relative chosen value. Shading corresponds to s.e.m. b, Females had a significantly larger proportion of neurons encoding relative chosen value during the outcome than males (χ2 test: χ2(1,n=756)=11.26, P=0.0008, see Extended Data Fig. 10d for all events). c, Average fluorescence during the outcome period versus relative chosen value quantile bin for neurons significantly encoding relative chosen value during the outcome for females (left) and males (middle). Right, mean and s.e.m. across significant neurons (n=44/307 neurons in females, n=31/449 neurons in males). d, Example fluorescence time-locked to CS, plotted by quantile bin of relative side value (QIQC, where QI and QC are action values for the lever ipsilateral or contralateral to the imaging side, respectively). Examples 1 and 2 were preferentially active during lever presses with low relative side value, and examples 3 and 4 were preferentially active during lever presses with high relative side value. Shading corresponds to s.e.m. e, There was no significant difference in the proportion of neurons significantly encoding relative side value in males versus females during the lever press (χ2 test: χ2(1,n=756)=1.44, P=0.23; see Extended Data Fig. 10e for all events). f, Average lever press activity versus relative side value quantile bin for neurons significantly encoding relative side value during the lever press for females (left) and males (middle). Right, mean and s.e.m. across significant neurons (n=34/307 neurons from females, n=38/449 neurons from males).

References

    1. Grissom NM & Reyes TM Let’s call the whole thing off: evaluating gender and sex differences in executive function. Neuropsychopharmacology 44, 86–96 (2019). - PMC - PubMed
    1. van den Bos R, Homberg J & de Visser L A critical review of sex differences in decision-making tasks: focus on the Iowa gambling task. Behav. Brain Res 238, 95–108 (2013). - PubMed
    1. Orsini CA & Setlow B Sex differences in animal models of decision making. J. Neurosci. Res 95, 260–269 (2017). - PMC - PubMed
    1. Shansky RM & Murphy AZ Considering sex as a biological variable will require a global shift in science culture. Nat. Neurosci 24, 457–464 (2021). - PubMed
    1. Chowdhury T et al. Sex differences in reward- and punishment-guided actions. Biol. Psychiatry 87, S62 (2020). - PMC - PubMed

Publication types

LinkOut - more resources